
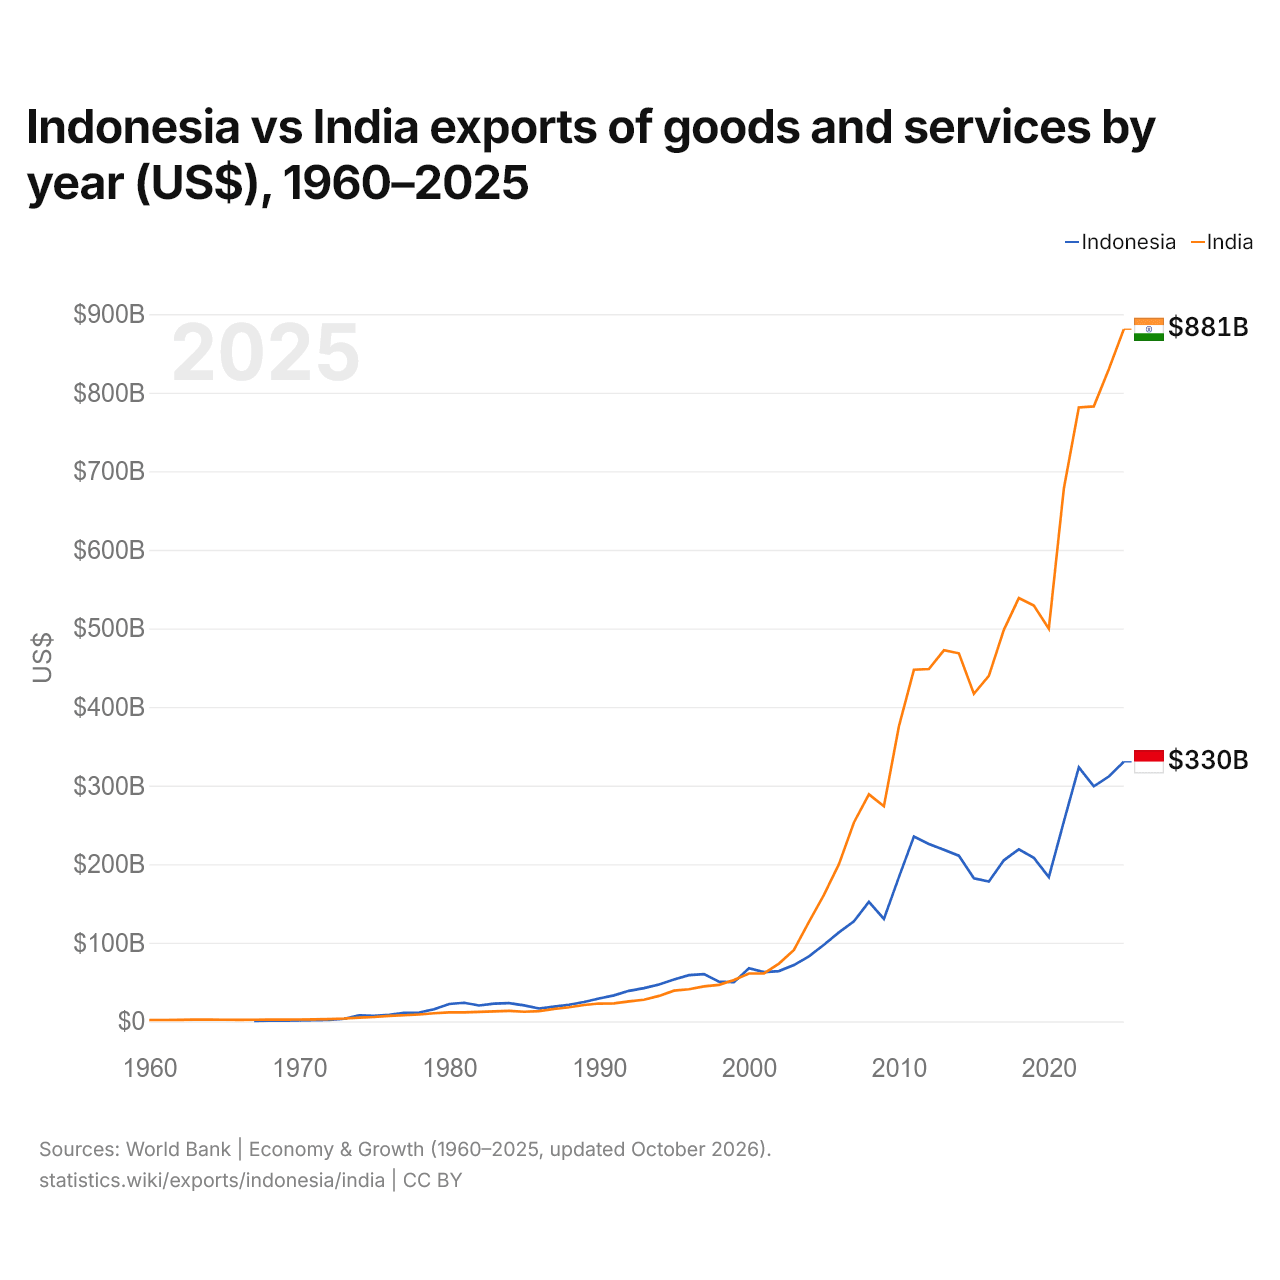
Indonésie vs Inde : exportations de biens et services par année ($ US), 1960–2025
| Année | $ US | |
|---|---|---|
 Indonésie |
 Inde |
|
| 2025 | 330 279 431 219 $ US | 880 740 846 622 $ US |
| 2024 | 311 510 024 779 $ US | 829 785 193 474 $ US |
| 2023 | 299 031 805 851 $ US | 782 620 610 192 $ US |
| 2022 | 323 218 198 016 $ US | 781 290 791 564 $ US |
| 2021 | 254 109 508 154 $ US | 677 769 255 429 $ US |
| 2020 | 183 546 577 017 $ US | 499 728 529 073 $ US |
| 2019 | 208 057 763 659 $ US | 529 245 063 167 $ US |
| 2018 | 218 905 647 887 $ US | 538 635 186 135 $ US |
| 2017 | 204 924 485 909 $ US | 498 258 808 232 $ US |
| 2016 | 177 886 012 745 $ US | 439 642 578 076 $ US |
| 2015 | 182 158 298 802 $ US | 416 787 940 848 $ US |
| 2014 | 210 820 082 832 $ US | 468 345 815 421 $ US |
| 2013 | 218 308 408 828 $ US | 472 180 271 340 $ US |
| 2012 | 225 744 403 268 $ US | 448 400 477 361 $ US |
| 2011 | 235 095 129 133 $ US | 447 384 417 625 $ US |
| 2010 | 183 480 562 961 $ US | 375 353 514 026 $ US |
| 2009 | 130 357 798 591 $ US | 273 752 124 889 $ US |
| 2008 | 152 090 401 422 $ US | 288 902 044 821 $ US |
| 2007 | 127 226 102 177 $ US | 253 077 526 013 $ US |
| 2006 | 113 143 425 288 $ US | 199 973 922 364 $ US |
| 2005 | 97 387 627 566 $ US | 160 838 260 681 $ US |
| 2004 | 82 744 351 781 $ US | 126 648 472 021 $ US |
| 2003 | 71 553 141 045 $ US | 90 838 575 244 $ US |
| 2002 | 63 956 798 805 $ US | 73 452 895 952 $ US |
| 2001 | 62 625 875 834 $ US | 60 963 415 577 $ US |
| 2000 | 67 621 169 166 $ US | 60 878 472 821 $ US |
| 1999 | 49 720 260 590 $ US | 52 544 483 403 $ US |
| 1998 | 50 555 726 235 $ US | 46 426 465 025 $ US |
| 1997 | 60 106 038 404 $ US | 44 459 225 643 $ US |
| 1996 | 58 717 201 042 $ US | 40 803 004 618 $ US |
| 1995 | 53 185 312 942 $ US | 39 068 855 118 $ US |
| 1994 | 46 896 633 114 $ US | 32 361 214 431 $ US |
| 1993 | 42 274 397 859 $ US | 27 466 541 463 $ US |
| 1992 | 38 801 726 176 $ US | 25 486 029 047 $ US |
| 1991 | 33 063 806 609 $ US | 22 943 398 073 $ US |
| 1990 | 28 982 531 183 $ US | 22 639 774 912 $ US |
| 1989 | 24 640 067 877 $ US | 20 770 696 112 $ US |
| 1988 | 21 110 162 564 $ US | 17 899 838 409 $ US |
| 1987 | 18 661 070 321 $ US | 15 638 662 914 $ US |
| 1986 | 16 387 068 857 $ US | 12 937 864 154 $ US |
| 1985 | 20 279 853 770 $ US | 12 217 447 522 $ US |
| 1984 | 23 177 770 013 $ US | 13 330 716 432 $ US |
| 1983 | 22 488 286 931 $ US | 12 741 335 281 $ US |
| 1982 | 20 176 590 280 $ US | 12 009 417 677 $ US |
| 1981 | 23 629 067 626 $ US | 11 485 699 151 $ US |
| 1980 | 22 088 390 917 $ US | 11 439 738 400 $ US |
| 1979 | 15 453 888 921 $ US | 10 326 638 766 $ US |
| 1978 | 11 251 894 888 $ US | 8 670 401 540 $ US |
| 1977 | 10 760 963 855 $ US | 7 754 701 054 $ US |
| 1976 | 8 264 096 386 $ US | 6 868 148 773 $ US |
| 1975 | 6 868 915 663 $ US | 5 560 878 503 $ US |
| 1974 | 7 482 168 675 $ US | 4 808 449 430 $ US |
| 1973 | 3 263 373 494 $ US | 3 599 236 351 $ US |
| 1972 | 1 816 385 542 $ US | 2 878 233 145 $ US |
| 1971 | 1 345 889 844 $ US | 2 469 914 214 $ US |
| 1970 | 1 175 342 466 $ US | 2 361 333 333 $ US |
| 1969 | 751 533 742 $ US | 2 170 666 667 $ US |
| 1968 | 769 173 674 $ US | 2 144 000 000 $ US |
| 1967 | 497 382 747 $ US | 2 022 666 667 $ US |
| 1966 | - | 1 888 225 565 $ US |
| 1965 | - | 1 969 801 970 $ US |
| 1964 | - | 2 104 202 104 $ US |
| 1963 | - | 2 072 702 073 $ US |
| 1962 | - | 1 757 701 758 $ US |
| 1961 | - | 1 688 401 688 $ US |
| 1960 | - | 1 652 701 653 $ US |
En 2025, les exportations de biens et services de l'Indonésie s'élevaient à 330 milliards de dollars et celles de l'Inde à 881 milliards de dollars : celles de l'Inde étaient 2,7 fois plus élevées. En 1967, les exportations de l'Inde étaient 4,1 fois plus élevées : 497 millions de dollars pour l'Indonésie et 2,02 milliards de dollars pour l'Inde.
Les exportations de biens et services de l'Inde sont supérieures à celles de l'Indonésie chaque année depuis 2002.
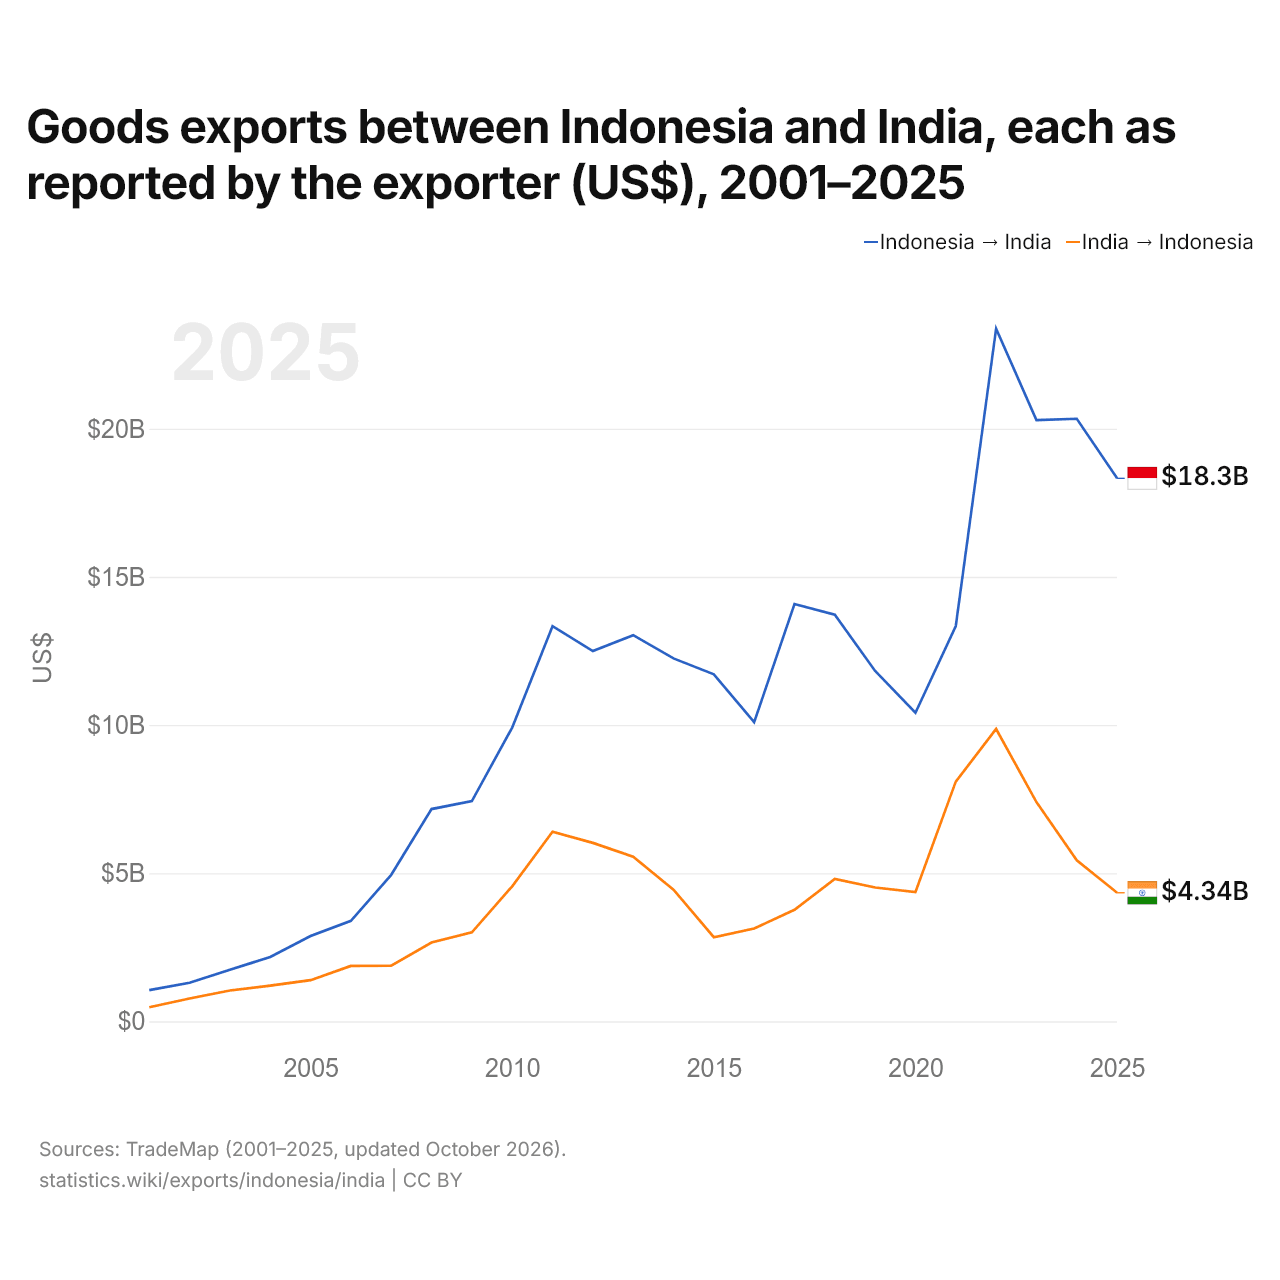
Exportations de biens entre l'Indonésie et l'Inde, selon chaque exportateur ($ US), 2001–2025
| Année | $ US | |
|---|---|---|
| Indonésie → Inde | Inde → Indonésie | |
| 2025 | 18 324 705 000 $ US | 4 339 678 000 $ US |
| 2024 | 20 335 686 000 $ US | 5 433 780 000 $ US |
| 2023 | 20 290 562 000 $ US | 7 397 770 000 $ US |
| 2022 | 23 378 836 000 $ US | 9 866 614 000 $ US |
| 2021 | 13 341 986 000 $ US | 8 089 416 000 $ US |
| 2020 | 10 413 999 000 $ US | 4 363 742 000 $ US |
| 2019 | 11 823 491 000 $ US | 4 515 383 000 $ US |
| 2018 | 13 725 676 000 $ US | 4 802 577 000 $ US |
| 2017 | 14 083 573 000 $ US | 3 763 710 000 $ US |
| 2016 | 10 093 805 000 $ US | 3 131 114 000 $ US |
| 2015 | 11 713 021 000 $ US | 2 838 951 000 $ US |
| 2014 | 12 248 960 000 $ US | 4 444 760 000 $ US |
| 2013 | 13 031 303 000 $ US | 5 557 939 000 $ US |
| 2012 | 12 496 314 000 $ US | 6 021 918 000 $ US |
| 2011 | 13 335 706 000 $ US | 6 400 248 000 $ US |
| 2010 | 9 915 039 000 $ US | 4 557 083 000 $ US |
| 2009 | 7 432 893 000 $ US | 3 002 991 000 $ US |
| 2008 | 7 163 336 000 $ US | 2 659 314 000 $ US |
| 2007 | 4 943 906 000 $ US | 1 878 196 000 $ US |
| 2006 | 3 390 790 000 $ US | 1 869 806 000 $ US |
| 2005 | 2 878 348 000 $ US | 1 390 066 000 $ US |
| 2004 | 2 170 507 000 $ US | 1 205 594 000 $ US |
| 2003 | 1 742 488 000 $ US | 1 039 615 000 $ US |
| 2002 | 1 301 960 000 $ US | 769 612 000 $ US |
| 2001 | 1 053 940 000 $ US | 476 779 000 $ US |
En 2025, les exportations de biens de l'Indonésie vers l'Inde, selon l'Indonésie, s'élevaient à 18,3 milliards de dollars, et celles de l'Inde vers l'Indonésie, selon l'Inde, à 4,34 milliards de dollars : 4,2 fois plus pour celles de l'Indonésie. En 2001, elles s'élevaient à 1,05 milliard de dollars pour l'Indonésie et à 477 millions de dollars pour l'Inde.
Indonésie vs Inde : chiffres des exportations
|
Indonésie
|
Inde
|
|
|---|---|---|
| Exportations | 330 Md $US (2025) | 881 Md $US (2025) |
| Rang mondial | 30/176 | 10/176 |
| Part mondiale | 0,95 % | 2,52 % |
| % du PIB | 22,8 % | 22,3 % |
| Première catégorie de biens | Pétrole, gaz, minerais et autres matières premières (22 %, 2025) | Machines, électronique et véhicules (28,5 %, 2025) |
| Première destination des biens | Chine (23,7 %, 2025) | États-Unis (20,7 %, 2025) |
Comparer les exportations de 2 pays au choix
Sources :
- Banque mondiale | Économie et croissance (1960–2025, mis à jour en octobre 2026)
- TradeMap (2001–2025, mis à jour en octobre 2026)
Creative Commons Attribution (CC BY) : vous pouvez copier, partager, adapter et réutiliser ce contenu, y compris à des fins commerciales, à condition de citer statistics.wiki et d’indiquer les modifications apportées. Les sources citées ci-dessus peuvent avoir leurs propres conditions de licence.