
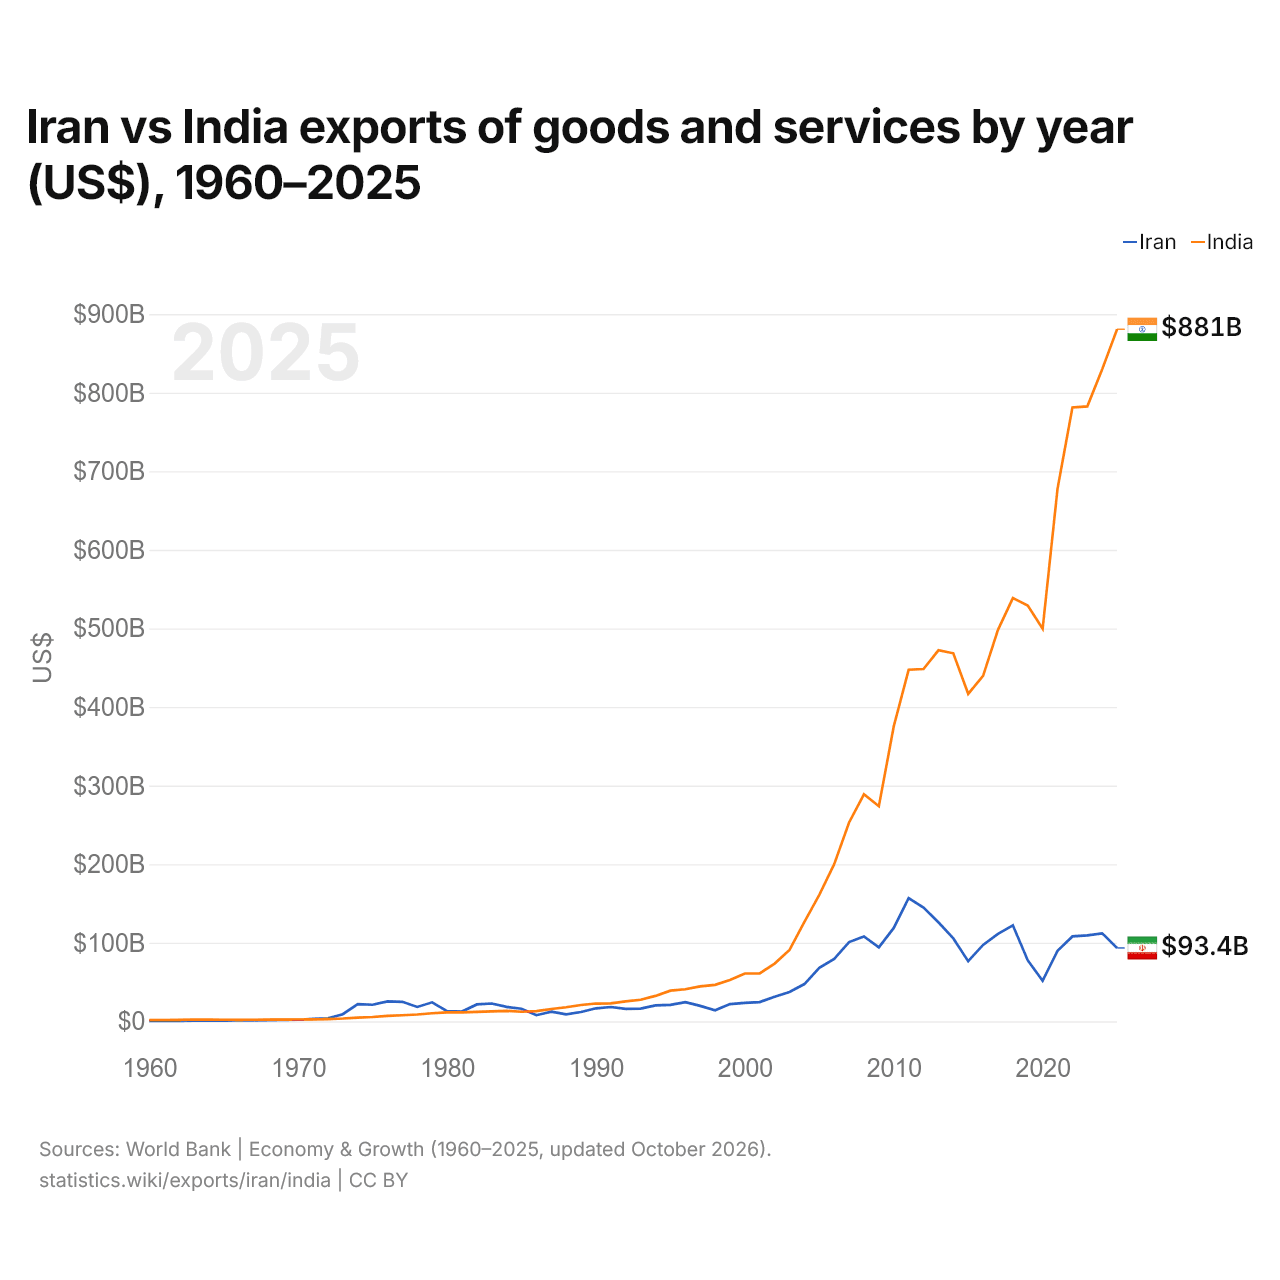
Iran vs Inde : exportations de biens et services par année ($ US), 1960–2025
| Année | $ US | |
|---|---|---|
 Iran |
 Inde |
|
| 2025 | 93 406 513 015 $ US | 880 740 846 622 $ US |
| 2024 | 111 928 863 188 $ US | 829 785 193 474 $ US |
| 2023 | 109 444 045 104 $ US | 782 620 610 192 $ US |
| 2022 | 108 060 448 022 $ US | 781 290 791 564 $ US |
| 2021 | 89 695 394 080 $ US | 677 769 255 429 $ US |
| 2020 | 51 664 876 276 $ US | 499 728 529 073 $ US |
| 2019 | 77 652 596 277 $ US | 529 245 063 167 $ US |
| 2018 | 122 086 879 298 $ US | 538 635 186 135 $ US |
| 2017 | 111 400 323 837 $ US | 498 258 808 232 $ US |
| 2016 | 97 206 283 743 $ US | 439 642 578 076 $ US |
| 2015 | 76 604 098 445 $ US | 416 787 940 848 $ US |
| 2014 | 105 542 726 659 $ US | 468 345 815 421 $ US |
| 2013 | 126 015 225 004 $ US | 472 180 271 340 $ US |
| 2012 | 144 745 274 388 $ US | 448 400 477 361 $ US |
| 2011 | 156 851 049 079 $ US | 447 384 417 625 $ US |
| 2010 | 118 843 286 440 $ US | 375 353 514 026 $ US |
| 2009 | 94 038 986 374 $ US | 273 752 124 889 $ US |
| 2008 | 107 921 993 809 $ US | 288 902 044 821 $ US |
| 2007 | 100 876 666 988 $ US | 253 077 526 013 $ US |
| 2006 | 79 332 810 982 $ US | 199 973 922 364 $ US |
| 2005 | 68 235 356 550 $ US | 160 838 260 681 $ US |
| 2004 | 47 439 812 814 $ US | 126 648 472 021 $ US |
| 2003 | 37 411 894 955 $ US | 90 838 575 244 $ US |
| 2002 | 31 402 849 783 $ US | 73 452 895 952 $ US |
| 2001 | 24 491 811 634 $ US | 60 963 415 577 $ US |
| 2000 | 23 526 115 003 $ US | 60 878 472 821 $ US |
| 1999 | 21 963 669 399 $ US | 52 544 483 403 $ US |
| 1998 | 13 986 840 980 $ US | 46 426 465 025 $ US |
| 1997 | 19 682 874 298 $ US | 44 459 225 643 $ US |
| 1996 | 24 315 730 858 $ US | 40 803 004 618 $ US |
| 1995 | 20 900 063 457 $ US | 39 068 855 118 $ US |
| 1994 | 20 321 213 941 $ US | 32 361 214 431 $ US |
| 1993 | 16 197 325 831 $ US | 27 466 541 463 $ US |
| 1992 | 15 767 057 949 $ US | 25 486 029 047 $ US |
| 1991 | 18 198 012 421 $ US | 22 943 398 073 $ US |
| 1990 | 16 573 631 050 $ US | 22 639 774 912 $ US |
| 1989 | 11 841 502 482 $ US | 20 770 696 112 $ US |
| 1988 | 8 964 962 592 $ US | 17 899 838 409 $ US |
| 1987 | 12 271 835 670 $ US | 15 638 662 914 $ US |
| 1986 | 7 802 605 539 $ US | 12 937 864 154 $ US |
| 1985 | 16 006 784 597 $ US | 12 217 447 522 $ US |
| 1984 | 18 359 078 550 $ US | 13 330 716 432 $ US |
| 1983 | 22 725 836 920 $ US | 12 741 335 281 $ US |
| 1982 | 21 524 982 663 $ US | 12 009 417 677 $ US |
| 1981 | 12 431 487 009 $ US | 11 485 699 151 $ US |
| 1980 | 12 961 626 484 $ US | 11 439 738 400 $ US |
| 1979 | 24 176 515 151 $ US | 10 326 638 766 $ US |
| 1978 | 18 308 804 923 $ US | 8 670 401 540 $ US |
| 1977 | 24 821 052 417 $ US | 7 754 701 054 $ US |
| 1976 | 25 319 975 896 $ US | 6 868 148 773 $ US |
| 1975 | 21 091 425 211 $ US | 5 560 878 503 $ US |
| 1974 | 21 889 677 077 $ US | 4 808 449 430 $ US |
| 1973 | 9 056 140 484 $ US | 3 599 236 351 $ US |
| 1972 | 3 936 283 736 $ US | 2 878 233 145 $ US |
| 1971 | 3 172 763 667 $ US | 2 469 914 214 $ US |
| 1970 | 2 026 823 485 $ US | 2 361 333 333 $ US |
| 1969 | 1 756 492 441 $ US | 2 170 666 667 $ US |
| 1968 | 1 507 260 406 $ US | 2 144 000 000 $ US |
| 1967 | 1 306 819 827 $ US | 2 022 666 667 $ US |
| 1966 | 1 106 379 248 $ US | 1 888 225 565 $ US |
| 1965 | 1 000 884 206 $ US | 1 969 801 970 $ US |
| 1964 | 882 202 285 $ US | 2 104 202 104 $ US |
| 1963 | 755 608 235 $ US | 2 072 702 073 $ US |
| 1962 | 680 443 018 $ US | 1 757 701 758 $ US |
| 1961 | 607 915 177 $ US | 1 688 401 688 $ US |
| 1960 | 581 541 416 $ US | 1 652 701 653 $ US |
En 2025, les exportations de biens et services de l'Iran s'élevaient à 93,4 milliards de dollars et celles de l'Inde à 881 milliards de dollars : celles de l'Inde étaient 9,4 fois plus élevées. En 1960, les exportations de l'Inde étaient 2,8 fois plus élevées : 582 millions de dollars pour l'Iran et 1,65 milliard de dollars pour l'Inde.
Les exportations de biens et services de l'Inde sont supérieures à celles de l'Iran chaque année depuis 1986.
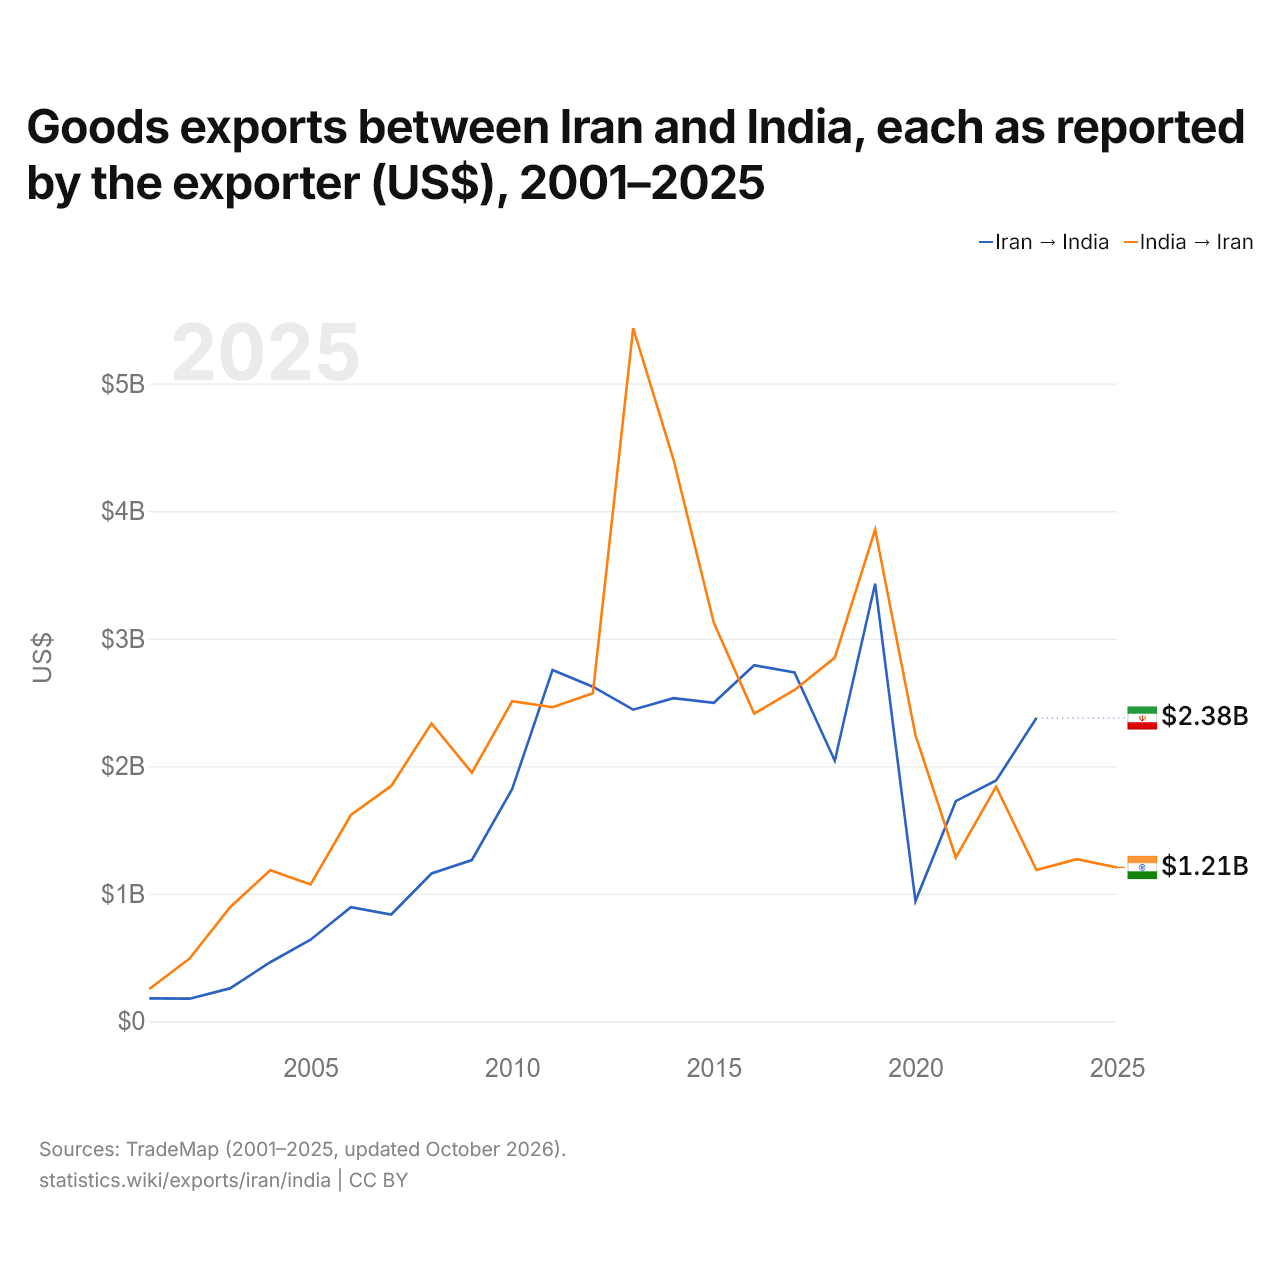
Exportations de biens entre l'Iran et l'Inde, selon chaque exportateur ($ US), 2001–2025
| Année | $ US | |
|---|---|---|
| Iran → Inde | Inde → Iran | |
| 2025 | - | 1 206 399 000 $ US |
| 2024 | - | 1 271 633 000 $ US |
| 2023 | 2 377 454 000 $ US | 1 186 241 000 $ US |
| 2022 | 1 887 791 000 $ US | 1 839 523 000 $ US |
| 2021 | 1 726 008 000 $ US | 1 284 001 000 $ US |
| 2020 | 942 456 000 $ US | 2 243 733 000 $ US |
| 2019 | 3 430 475 000 $ US | 3 855 008 000 $ US |
| 2018 | 2 042 922 000 $ US | 2 851 233 000 $ US |
| 2017 | 2 734 893 000 $ US | 2 597 498 000 $ US |
| 2016 | 2 791 192 000 $ US | 2 412 236 000 $ US |
| 2015 | 2 497 185 000 $ US | 3 124 071 000 $ US |
| 2014 | 2 533 281 000 $ US | 4 404 314 000 $ US |
| 2013 | 2 443 136 000 $ US | 5 433 901 000 $ US |
| 2012 | 2 623 820 000 $ US | 2 572 134 000 $ US |
| 2011 | 2 753 872 000 $ US | 2 462 295 000 $ US |
| 2010 | 1 821 698 000 $ US | 2 509 258 000 $ US |
| 2009 | 1 264 488 000 $ US | 1 949 088 000 $ US |
| 2008 | 1 159 445 000 $ US | 2 335 908 000 $ US |
| 2007 | 837 475 000 $ US | 1 845 260 000 $ US |
| 2006 | 895 410 000 $ US | 1 617 340 000 $ US |
| 2005 | 640 127 000 $ US | 1 072 988 000 $ US |
| 2004 | 463 333 000 $ US | 1 184 997 000 $ US |
| 2003 | 258 277 000 $ US | 892 990 000 $ US |
| 2002 | 177 465 000 $ US | 492 185 000 $ US |
| 2001 | 180 158 000 $ US | 253 276 000 $ US |
Les exportations de biens de l'Iran vers l'Inde, selon l'Iran, s'élevaient à 2,38 milliards de dollars, et celles de l'Inde vers l'Iran, selon l'Inde, à 1,19 milliard de dollars : 2,0 fois plus pour celles de l'Iran. En 2001, elles s'élevaient à 180 millions de dollars pour l'Iran et à 253 millions de dollars pour l'Inde.
Iran vs Inde : chiffres des exportations
|
Iran
|
Inde
|
|
|---|---|---|
| Exportations | 93,4 Md $US (2025) | 881 Md $US (2025) |
| Rang mondial | 50/176 | 10/176 |
| Part mondiale | 0,27 % | 2,52 % |
| % du PIB | 25,8 % | 22,3 % |
| Première catégorie de biens | Pétrole, gaz, minerais et autres matières premières (72,9 %, 2023) | Machines, électronique et véhicules (28,5 %, 2025) |
| Première destination des biens | Chine (27,1 %, 2023) | États-Unis (20,7 %, 2025) |
Comparer les exportations de 2 pays au choix
Sources :
- Banque mondiale | Économie et croissance (1960–2025, mis à jour en octobre 2026)
- TradeMap (2001–2025, mis à jour en octobre 2026)
Creative Commons Attribution (CC BY) : vous pouvez copier, partager, adapter et réutiliser ce contenu, y compris à des fins commerciales, à condition de citer statistics.wiki et d’indiquer les modifications apportées. Les sources citées ci-dessus peuvent avoir leurs propres conditions de licence.