
Exportations de biens et services de la Syrie par année ($ US)
| Année | $ US | Rang mondial |
|---|---|---|
| Exportations | Rang mondial | |
| 2022 | 1 608 744 496 $ US | #153 |
| 2021 | 2 226 608 573 $ US | #144 |
| 2020 | 1 648 856 244 $ US | #149 |
| 2019 | 2 938 069 172 $ US | #139 |
| 2018 | 3 206 830 228 $ US | #137 |
| 2017 | 3 165 874 598 $ US | #135 |
| 2016 | 2 731 227 397 $ US | #133 |
| 2015 | 2 353 296 642 $ US | #139 |
| 2014 | 1 508 537 236 $ US | #151 |
| 2013 | 1 661 482 225 $ US | #148 |
| 2012 | 3 331 967 972 $ US | #130 |
| 2011 | 13 081 933 251 $ US | #89 |
| 2010 | 19 747 456 812 $ US | #72 |
| 2009 | 15 724 551 096 $ US | #73 |
| 2008 | 19 741 840 053 $ US | #73 |
| 2007 | 15 617 340 809 $ US | #73 |
| 2006 | 13 167 057 674 $ US | #72 |
| 2005 | 11 844 406 130 $ US | #71 |
| 2004 | 10 147 425 743 $ US | #71 |
| 2003 | 7 030 359 683 $ US | #74 |
| 2002 | 8 216 795 445 $ US | #68 |
| 2001 | 7 464 741 326 $ US | #68 |
| 2000 | 6 839 334 310 $ US | #69 |
| 1999 | 5 129 922 481 $ US | #75 |
| 1998 | 4 640 692 308 $ US | #75 |
| 1997 | 4 702 704 280 $ US | #76 |
| 1996 | 4 388 662 675 $ US | #74 |
| 1995 | 3 537 504 990 $ US | #78 |
| 1994 | 3 346 540 000 $ US | #74 |
| 1993 | 3 816 418 531 $ US | #66 |
| 1992 | 3 479 921 417 $ US | #69 |
| 1991 | 3 168 250 000 $ US | #66 |
| 1990 | 3 488 165 298 $ US | #66 |
| 1989 | 2 962 782 879 $ US | #59 |
| 1988 | 1 774 447 445 $ US | #72 |
| 1987 | 1 778 676 863 $ US | #65 |
| 1986 | 1 497 286 368 $ US | #69 |
| 1985 | 1 960 935 036 $ US | #63 |
| 1984 | 2 174 468 579 $ US | #62 |
| 1983 | 2 331 285 399 $ US | #60 |
| 1982 | 2 268 031 466 $ US | #60 |
| 1981 | 2 427 631 113 $ US | #61 |
| 1980 | 2 380 891 720 $ US | #60 |
| 1979 | 1 900 127 389 $ US | #56 |
| 1978 | 1 376 861 397 $ US | #58 |
| 1977 | 1 398 290 598 $ US | #58 |
| 1976 | 1 490 583 513 $ US | #52 |
| 1975 | 1 461 385 482 $ US | #50 |
| 1974 | 1 242 591 990 $ US | #53 |
| 1973 | 714 520 368 $ US | #52 |
| 1972 | 555 039 788 $ US | #56 |
| 1971 | 449 256 626 $ US | #56 |
| 1970 | 374 567 202 $ US | #57 |
| 1969 | 384 128 067 $ US | - |
| 1968 | 304 528 181 $ US | - |
| 1967 | 248 911 547 $ US | - |
| 1966 | 237 017 340 $ US | - |
| 1965 | 250 836 076 $ US | - |
| 1964 | 223 808 508 $ US | - |
| 1963 | 233 218 639 $ US | - |
| 1962 | 232 483 198 $ US | - |
| 1961 | 166 354 553 $ US | - |
| 1960 | 183 179 972 $ US | - |
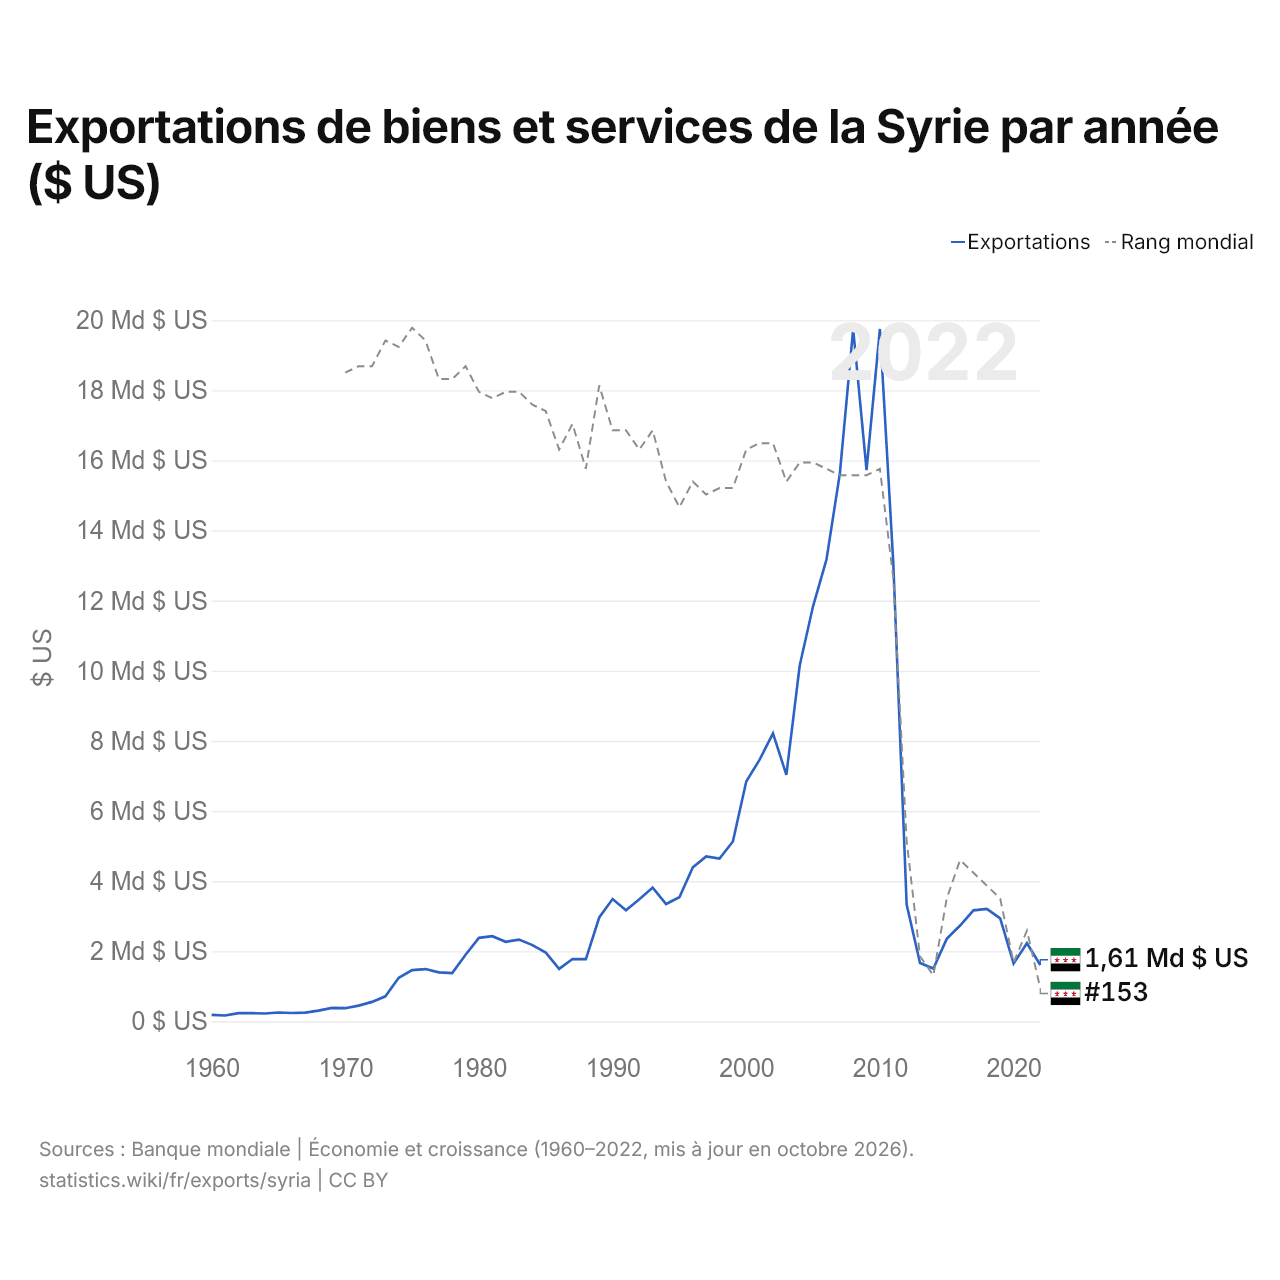
Les exportations de biens et services de la Syrie s'élèvent à 1,61 milliard de dollars (2022), contre 183 millions de dollars en 1960. Le maximum a été de 19,7 milliards de dollars, en 2010. Elles se classent au 153e rang mondial, en baisse par rapport au 144e rang l'année précédente. Leur meilleur rang a été le 50e, occupé pour la dernière fois en 1975.
Les exportations de biens et services de la Syrie sont les 42es plus élevées de 44 pays situés en Asie. Les importations de biens et services de la Syrie s'élèvent à 6,8 milliards de dollars (2022), au 131e rang mondial. Les importations de la Syrie dépassent ses exportations de 5,19 milliards de dollars, soit un déficit commercial (2022).
Exportations de biens et de services de la Syrie ($ US)
| Année | $ US | |
|---|---|---|
| Biens | Services | |
| 2010 | 12 272 749 953 $ US | 7 333 041 020 $ US |
| 2009 | 10 883 491 161 $ US | 4 798 415 719 $ US |
| 2008 | 15 334 000 000 $ US | 4 415 315 151 $ US |
| 2007 | 11 755 667 755 $ US | 3 861 348 442 $ US |
| 2006 | 10 244 800 000 $ US | 2 924 000 000 $ US |
| 2005 | 8 602 000 000 $ US | 2 910 000 000 $ US |
| 2004 | 7 220 400 000 $ US | 2 613 100 000 $ US |
| 2003 | 5 692 000 000 $ US | 1 353 000 000 $ US |
| 2002 | 6 668 000 000 $ US | 1 559 000 000 $ US |
| 2001 | 5 706 000 000 $ US | 1 781 000 000 $ US |
| 2000 | 5 146 000 000 $ US | 1 699 000 000 $ US |
| 1999 | 3 806 000 000 $ US | 1 651 000 000 $ US |
| 1998 | 3 142 000 000 $ US | 1 666 000 000 $ US |
| 1997 | 4 057 000 000 $ US | 1 582 000 000 $ US |
| 1996 | 4 178 000 000 $ US | 1 792 000 000 $ US |
| 1995 | 3 858 000 000 $ US | 1 899 000 000 $ US |
| 1994 | 3 329 000 000 $ US | 1 863 000 000 $ US |
| 1993 | 3 253 000 000 $ US | 1 595 000 000 $ US |
| 1992 | 3 100 000 000 $ US | 1 280 600 000 $ US |
| 1991 | 3 437 900 000 $ US | 1 064 600 000 $ US |
| 1990 | 4 156 000 000 $ US | 873 600 000 $ US |
| 1989 | 3 012 500 000 $ US | 893 400 000 $ US |
| 1988 | 1 347 600 000 $ US | 667 000 000 $ US |
| 1987 | 1 357 300 000 $ US | 600 000 000 $ US |
| 1986 | 1 036 900 000 $ US | 566 200 000 $ US |
| 1985 | 1 855 900 000 $ US | 655 600 000 $ US |
| 1984 | 1 834 200 000 $ US | 512 000 000 $ US |
| 1983 | 1 917 800 000 $ US | 559 500 000 $ US |
| 1982 | 2 002 100 000 $ US | 483 000 000 $ US |
| 1981 | 2 211 500 000 $ US | 431 300 000 $ US |
| 1980 | 2 112 000 000 $ US | 364 800 000 $ US |
| 1979 | 1 647 700 000 $ US | 376 300 000 $ US |
| 1978 | 1 061 200 000 $ US | 259 200 000 $ US |
| 1977 | 1 069 800 000 $ US | 329 500 000 $ US |
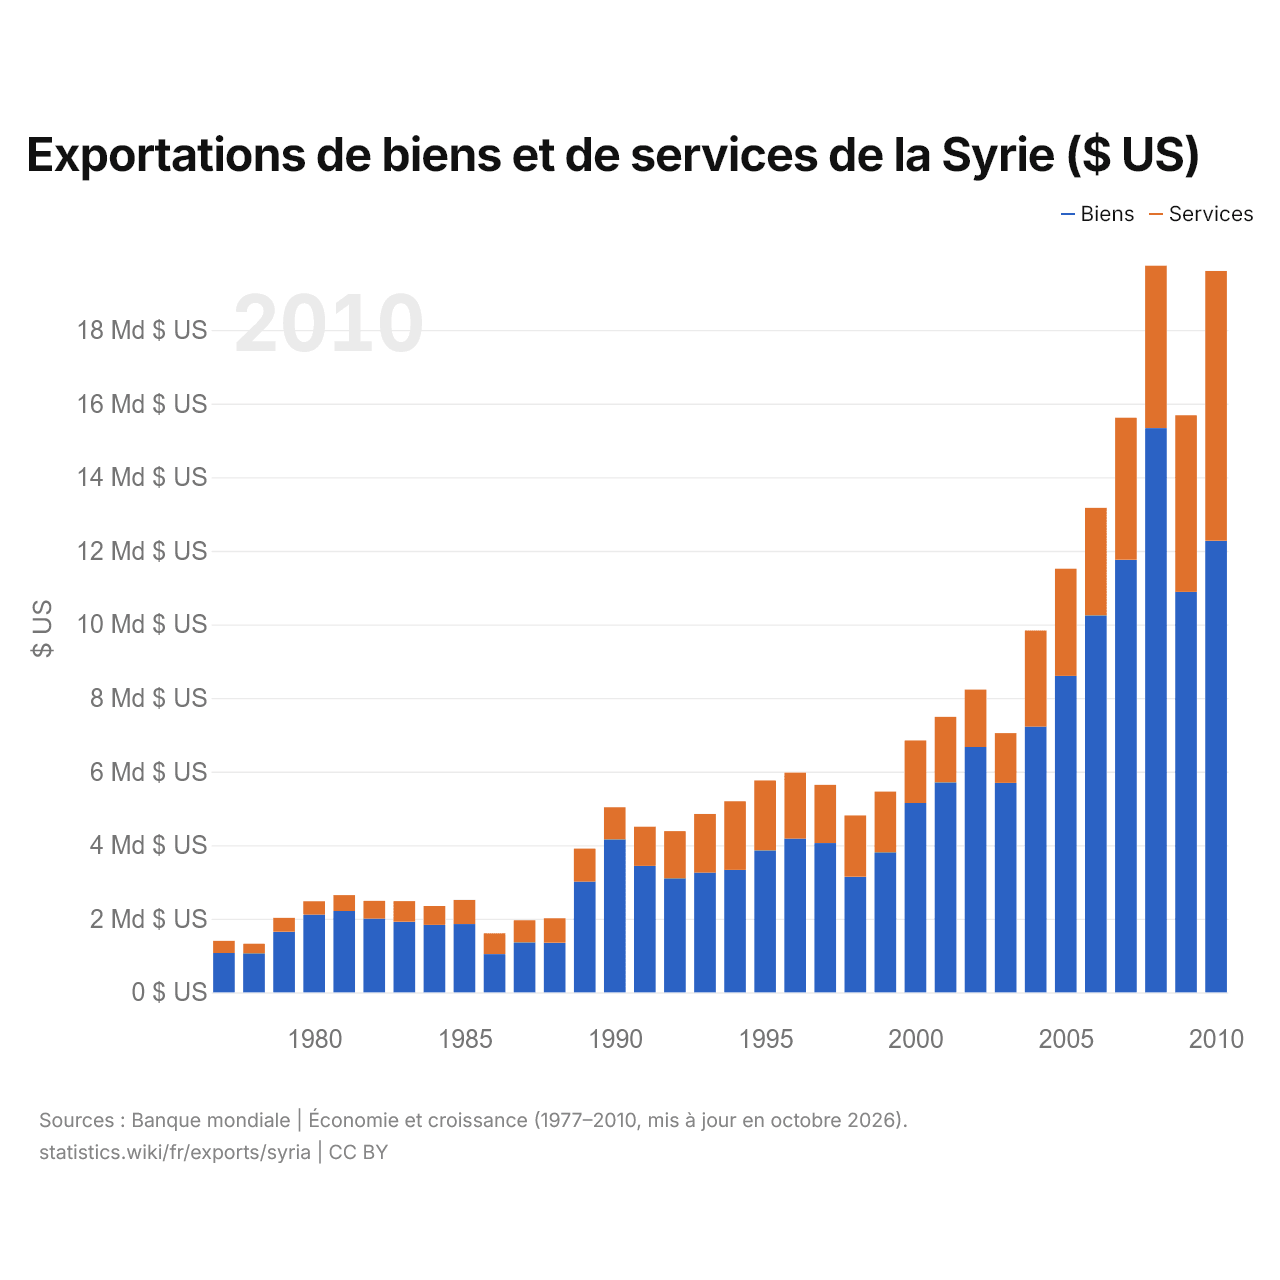
Les exportations de biens de la Syrie s'élèvent à 12,3 milliards de dollars (2010) et celles de services à 7,33 milliards de dollars ; les services représentent 37,4 % du total, contre 23,5 % en 1977.
La Syrie dans le classement mondial des exportations
| Rang | Pays | Exportations | Part mondiale | |
|---|---|---|---|---|
| 150 |
 Curaçao |
2,11 Md $US (2023) | 0,007 % | |
| 151 |
 Seychelles |
1,90 Md $US (2025) | 0,005 % | |
| 152 |
 Belize |
1,77 Md $US (2024) | 0,005 % | |
| 153 |
 Syrie |
1,61 Md $US | 0,005 % | |
| 154 |
 Malawi |
1,59 Md $US (2025) | 0,005 % | |
| 155 |
 Sierra Leone |
1,56 Md $US (2025) | 0,004 % | |
| 156 |
 Cap-Vert |
1,28 Md $US (2025) | 0,004 % |
Exportations de biens et services de la Syrie, % du PIB
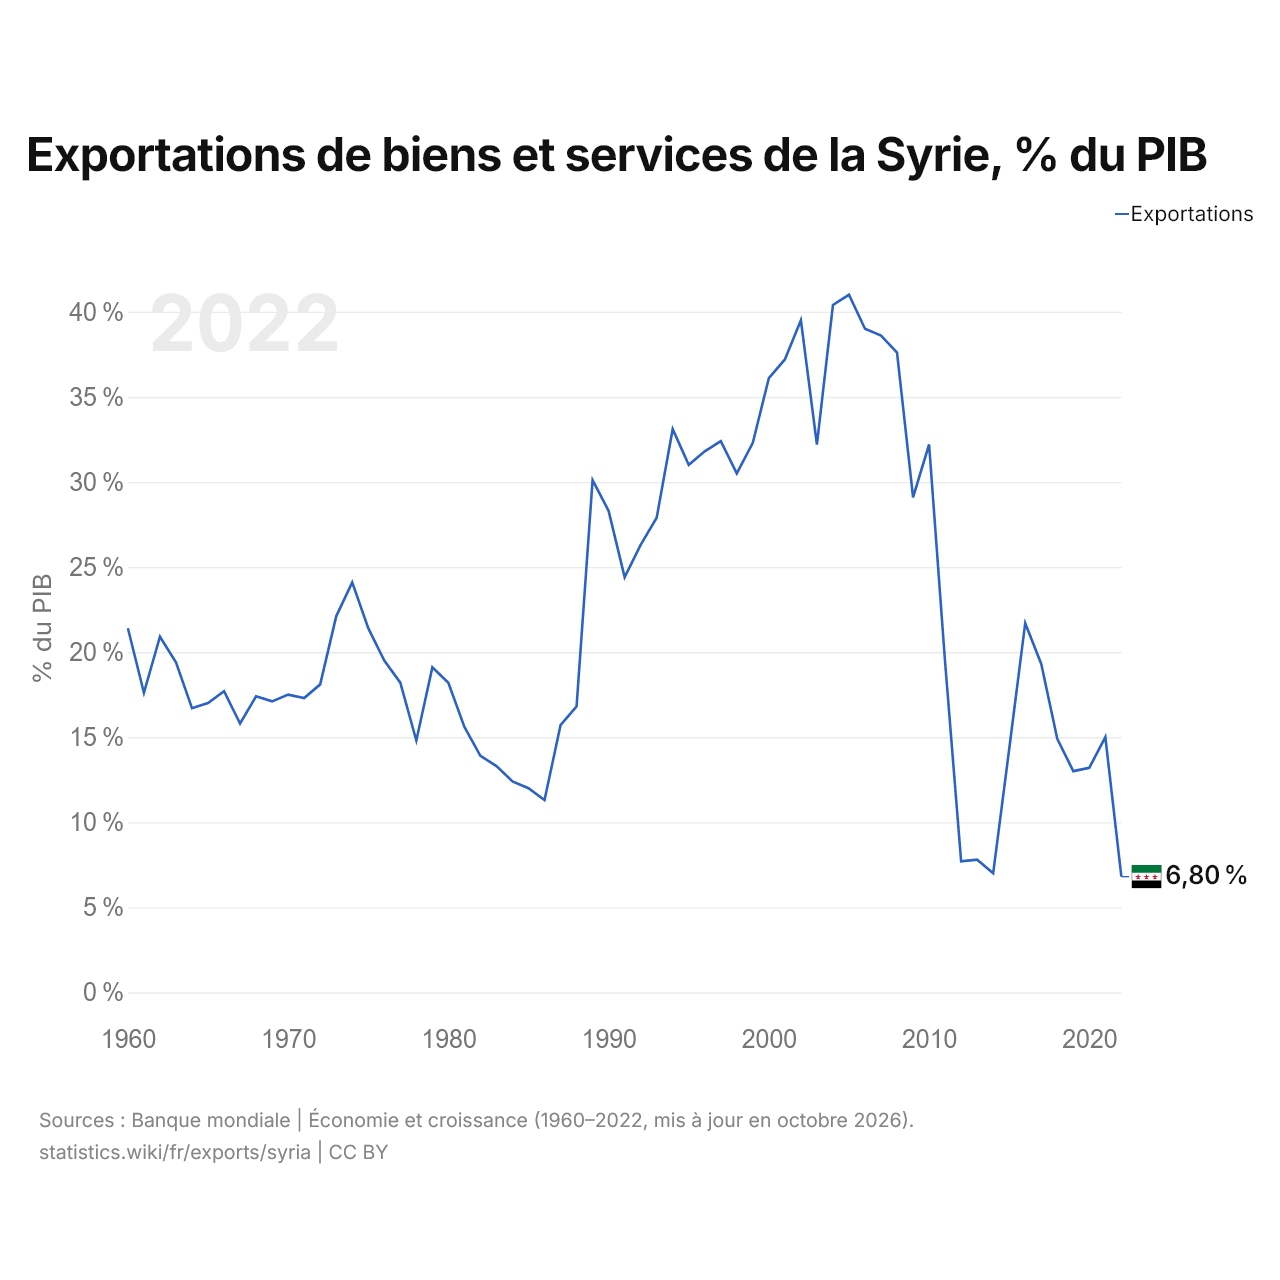
Les exportations de biens et services de la Syrie équivalent à 6,8 % de son PIB (2022), contre 21,4 % en 1960. La part la plus élevée a été de 41,0 %, en 2005.
Comparer les exportations de la Syrie avec celles d'autres pays
Sources :
- Banque mondiale | Économie et croissance (1960–2025, mis à jour en octobre 2026)
- TradeMap (2010, mis à jour en octobre 2026)
Creative Commons Attribution (CC BY) : vous pouvez copier, partager, adapter et réutiliser ce contenu, y compris à des fins commerciales, à condition de citer statistics.wiki et d’indiquer les modifications apportées. Les sources citées ci-dessus peuvent avoir leurs propres conditions de licence.