
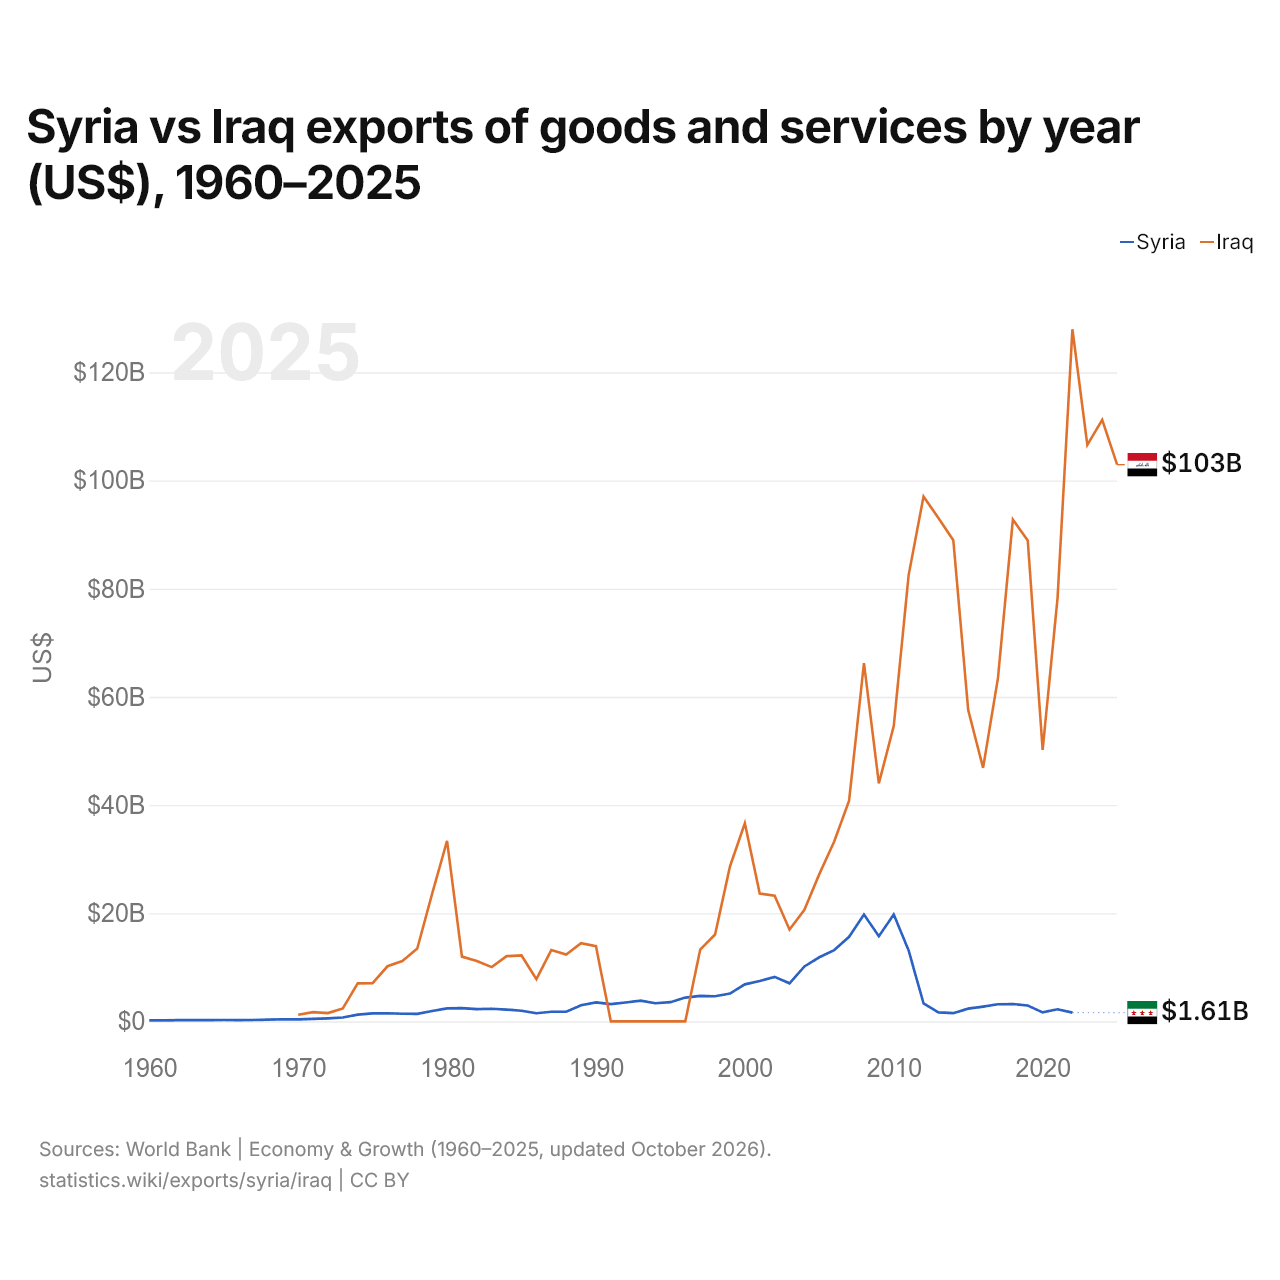
Syrie vs Irak : exportations de biens et services par année ($ US), 1960–2025
| Année | $ US | |
|---|---|---|
 Syrie |
 Irak |
|
| 2025 | - | 102 917 700 000 $ US |
| 2024 | - | 111 195 200 000 $ US |
| 2023 | - | 106 560 874 026 $ US |
| 2022 | 1 608 744 496 $ US | 127 955 205 517 $ US |
| 2021 | 2 226 608 573 $ US | 78 260 500 000 $ US |
| 2020 | 1 648 856 244 $ US | 50 199 918 398 $ US |
| 2019 | 2 938 069 172 $ US | 88 902 900 000 $ US |
| 2018 | 3 206 830 228 $ US | 92 771 934 475 $ US |
| 2017 | 3 165 874 598 $ US | 63 496 860 304 $ US |
| 2016 | 2 731 227 397 $ US | 46 869 152 413 $ US |
| 2015 | 2 353 296 642 $ US | 57 560 658 811 $ US |
| 2014 | 1 508 537 236 $ US | 88 949 000 000 $ US |
| 2013 | 1 661 482 225 $ US | 93 065 600 000 $ US |
| 2012 | 3 331 967 972 $ US | 97 029 491 174 $ US |
| 2011 | 13 081 933 251 $ US | 82 505 400 000 $ US |
| 2010 | 19 747 456 812 $ US | 54 598 900 000 $ US |
| 2009 | 15 724 551 096 $ US | 43 993 209 758 $ US |
| 2008 | 19 741 840 053 $ US | 66 239 316 769 $ US |
| 2007 | 15 617 340 809 $ US | 40 776 066 436 $ US |
| 2006 | 13 167 057 674 $ US | 33 245 806 395 $ US |
| 2005 | 11 844 406 130 $ US | 27 209 318 291 $ US |
| 2004 | 10 147 425 743 $ US | 20 614 098 526 $ US |
| 2003 | 7 030 359 683 $ US | 16 965 698 641 $ US |
| 2002 | 8 216 795 445 $ US | 23 237 627 426 $ US |
| 2001 | 7 464 741 326 $ US | 23 613 582 831 $ US |
| 2000 | 6 839 334 310 $ US | 36 613 563 338 $ US |
| 1999 | 5 129 922 481 $ US | 28 632 988 389 $ US |
| 1998 | 4 640 692 308 $ US | 16 060 750 015 $ US |
| 1997 | 4 702 704 280 $ US | 13 257 740 143 $ US |
| 1996 | 4 388 662 675 $ US | 955 912 $ US |
| 1995 | 3 537 504 990 $ US | 693 281 $ US |
| 1994 | 3 346 540 000 $ US | 1 419 563 $ US |
| 1993 | 3 816 418 531 $ US | 779 621 $ US |
| 1992 | 3 479 921 417 $ US | 3 224 627 $ US |
| 1991 | 3 168 250 000 $ US | 5 262 248 $ US |
| 1990 | 3 488 165 298 $ US | 13 888 387 097 $ US |
| 1989 | 2 962 782 879 $ US | 14 460 000 000 $ US |
| 1988 | 1 774 447 445 $ US | 12 340 967 742 $ US |
| 1987 | 1 778 676 863 $ US | 13 184 193 548 $ US |
| 1986 | 1 497 286 368 $ US | 7 799 354 839 $ US |
| 1985 | 1 960 935 036 $ US | 12 176 451 613 $ US |
| 1984 | 2 174 468 579 $ US | 12 046 129 032 $ US |
| 1983 | 2 331 285 399 $ US | 10 023 870 968 $ US |
| 1982 | 2 268 031 466 $ US | 11 168 333 333 $ US |
| 1981 | 2 427 631 113 $ US | 11 959 333 333 $ US |
| 1980 | 2 380 891 720 $ US | 33 374 666 667 $ US |
| 1979 | 1 900 127 389 $ US | 23 617 676 939 $ US |
| 1978 | 1 376 861 397 $ US | 13 467 998 645 $ US |
| 1977 | 1 398 290 598 $ US | 11 148 662 377 $ US |
| 1976 | 1 490 583 513 $ US | 10 185 912 631 $ US |
| 1975 | 1 461 385 482 $ US | 7 042 668 473 $ US |
| 1974 | 1 242 591 990 $ US | 7 029 800 203 $ US |
| 1973 | 714 520 368 $ US | 2 378 672 829 $ US |
| 1972 | 555 039 788 $ US | 1 519 074 797 $ US |
| 1971 | 449 256 626 $ US | 1 687 411 598 $ US |
| 1970 | 374 567 202 $ US | 1 224 999 510 $ US |
| 1969 | 384 128 067 $ US | - |
| 1968 | 304 528 181 $ US | - |
| 1967 | 248 911 547 $ US | - |
| 1966 | 237 017 340 $ US | - |
| 1965 | 250 836 076 $ US | - |
| 1964 | 223 808 508 $ US | - |
| 1963 | 233 218 639 $ US | - |
| 1962 | 232 483 198 $ US | - |
| 1961 | 166 354 553 $ US | - |
| 1960 | 183 179 972 $ US | - |
Les exportations de biens et services de la Syrie s'élevaient à 1,61 milliard de dollars (2022) et celles de l'Irak à 128 milliards de dollars (2022) : celles de l'Irak étaient 80 fois plus élevées. En 1970, les exportations de l'Irak étaient 3,3 fois plus élevées : 375 millions de dollars pour la Syrie et 1,22 milliard de dollars pour l'Irak.
Les exportations de biens et services de l'Irak sont supérieures à celles de la Syrie chaque année depuis 1997.
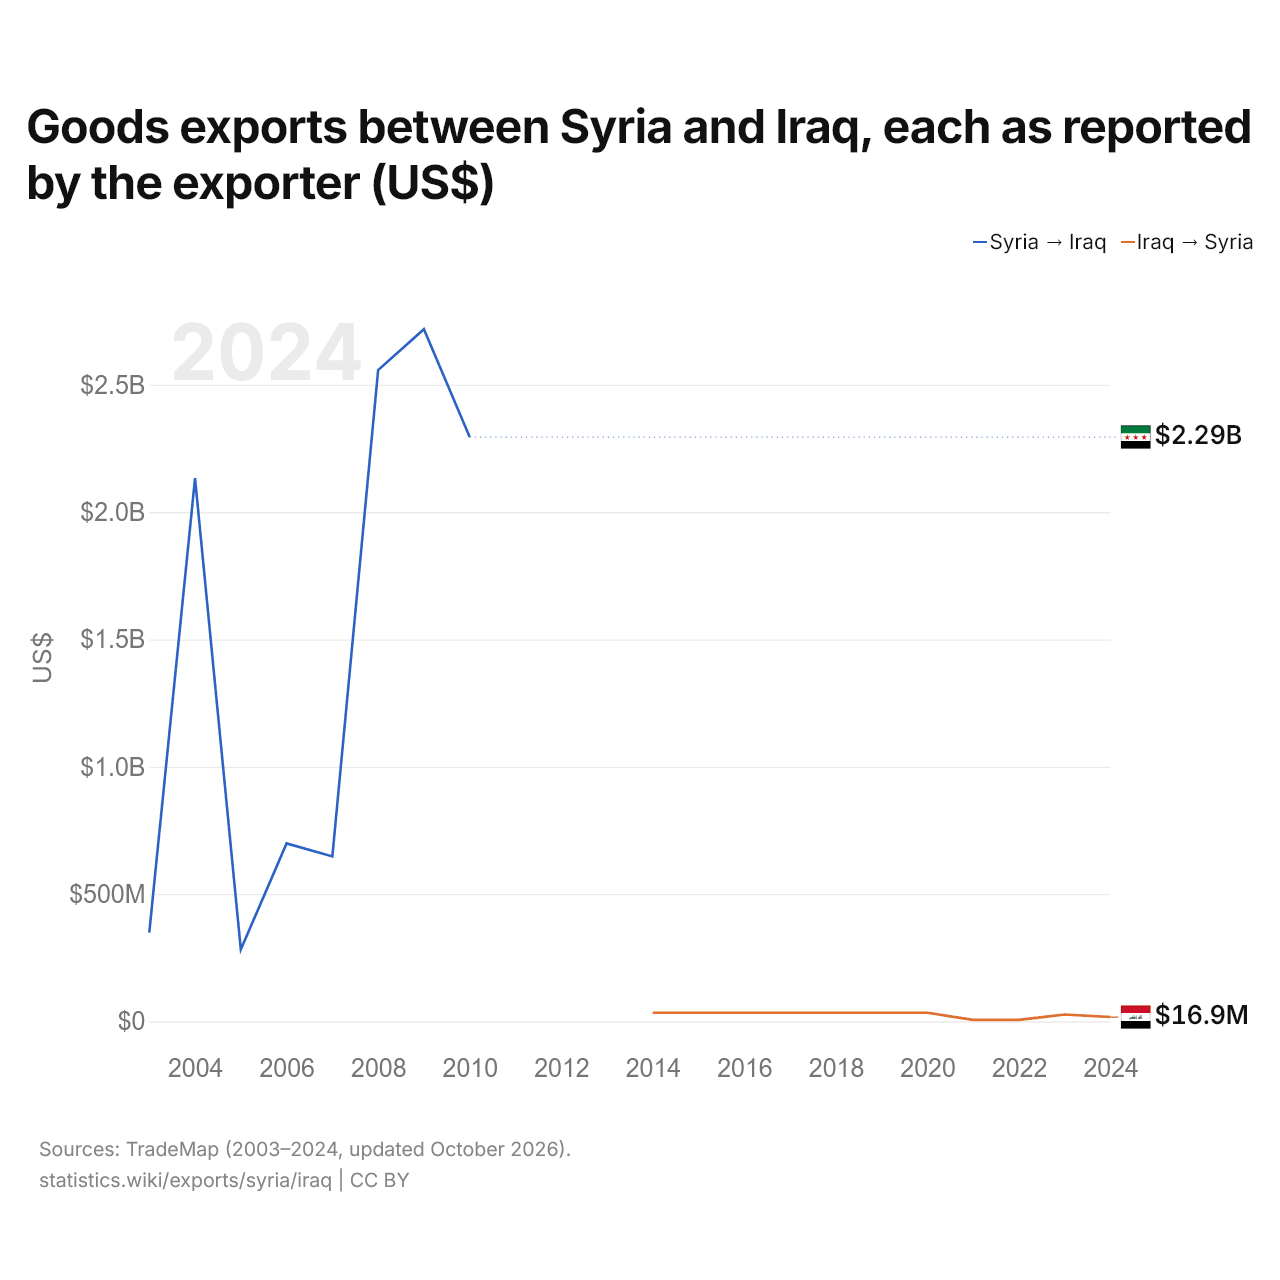
Exportations de biens entre la Syrie et l'Irak, selon chaque exportateur ($ US)
| Année | $ US | |
|---|---|---|
| Syrie → Irak | Irak → Syrie | |
| 2024 | - | 16 943 000 $ US |
| 2023 | - | 26 822 000 $ US |
| 2022 | - | 5 941 000 $ US |
| 2021 | - | 5 755 000 $ US |
| 2020 | - | 33 602 000 $ US |
| 2019 | - | 33 602 000 $ US |
| 2018 | - | 33 602 000 $ US |
| 2017 | - | 33 602 000 $ US |
| 2016 | - | 33 602 000 $ US |
| 2015 | - | 33 602 000 $ US |
| 2014 | - | 33 602 000 $ US |
| 2013 | - | - |
| 2012 | - | - |
| 2011 | - | - |
| 2010 | 2 294 520 000 $ US | - |
| 2009 | 2 718 130 000 $ US | - |
| 2008 | 2 557 560 000 $ US | - |
| 2007 | 647 646 000 $ US | - |
| 2006 | 698 737 000 $ US | - |
| 2005 | 282 085 000 $ US | - |
| 2004 | 2 132 950 000 $ US | - |
| 2003 | 348 318 000 $ US | - |
Selon la Syrie, ses exportations de biens vers l'Irak s'élèvent à 2,29 milliards de dollars (2010), contre 348 millions de dollars en 2003. Selon l'Irak, ses exportations de biens vers la Syrie s'élèvent à 16,9 millions de dollars (2024), contre 33,6 millions de dollars en 2014.
Syrie vs Irak : chiffres des exportations
|
Syrie
|
Irak
|
|
|---|---|---|
| Exportations | 1,61 Md $US (2022) | 103 Md $US (2025) |
| Rang mondial | 153/176 | 48/176 |
| Part mondiale | 0,005 % | 0,29 % |
| % du PIB | 6,8 % | 40,5 % |
| Première catégorie de biens | n.d. | Pétrole, gaz, minerais et autres matières premières (99,1 %, 2024) |
| Première destination des biens | n.d. | Émirats arabes unis (3,61 %, 2024) |
Comparer les exportations de 2 pays au choix
Sources :
- Banque mondiale | Économie et croissance (1960–2025, mis à jour en octobre 2026)
- TradeMap (2003–2024, mis à jour en octobre 2026)
Creative Commons Attribution (CC BY) : vous pouvez copier, partager, adapter et réutiliser ce contenu, y compris à des fins commerciales, à condition de citer statistics.wiki et d’indiquer les modifications apportées. Les sources citées ci-dessus peuvent avoir leurs propres conditions de licence.