
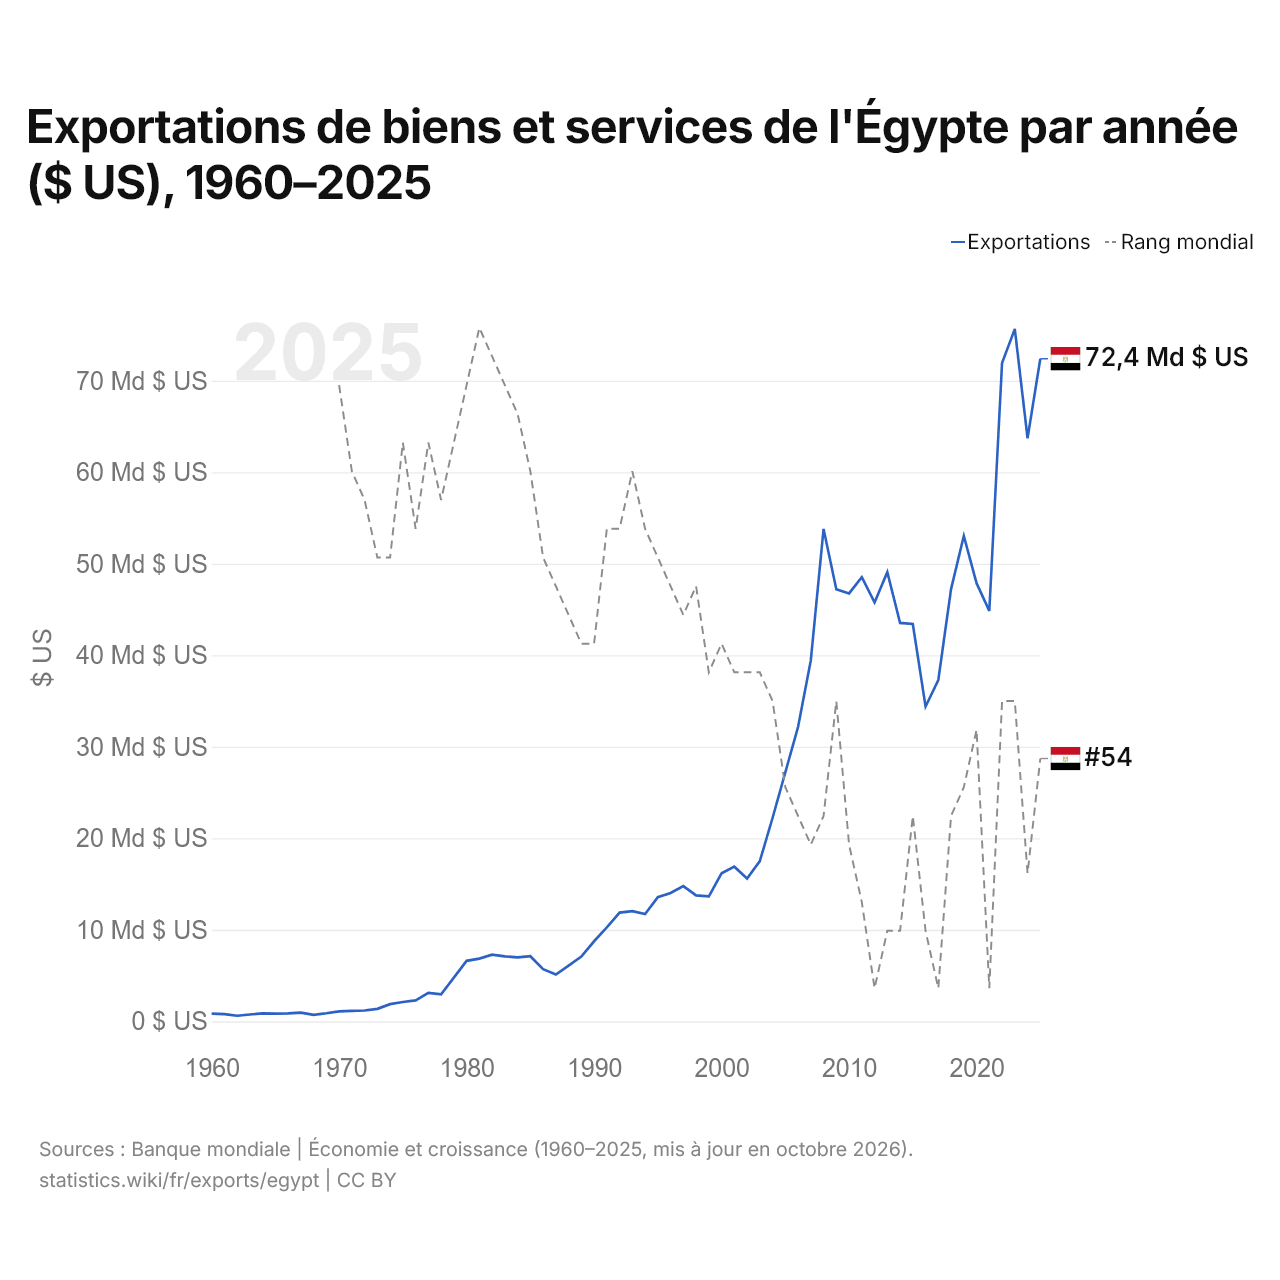
Exportations de biens et services de l'Égypte par année ($ US), 1960–2025
| Année | $ US | Rang mondial |
|---|---|---|
| Exportations | Rang mondial | |
| 2025 | 72 393 571 622 $ US | #54 |
| 2024 | 63 713 393 301 $ US | #58 |
| 2023 | 75 645 996 852 $ US | #52 |
| 2022 | 71 927 051 672 $ US | #52 |
| 2021 | 44 850 223 072 $ US | #62 |
| 2020 | 47 872 738 615 $ US | #53 |
| 2019 | 53 041 002 278 $ US | #55 |
| 2018 | 47 225 661 227 $ US | #56 |
| 2017 | 37 289 402 174 $ US | #62 |
| 2016 | 34 392 638 037 $ US | #60 |
| 2015 | 43 423 180 593 $ US | #56 |
| 2014 | 43 529 411 765 $ US | #60 |
| 2013 | 49 085 271 318 $ US | #60 |
| 2012 | 45 766 666 667 $ US | #62 |
| 2011 | 48 537 005 164 $ US | #59 |
| 2010 | 46 751 361 162 $ US | #57 |
| 2009 | 47 205 081 670 $ US | #52 |
| 2008 | 53 800 000 000 $ US | #56 |
| 2007 | 39 457 092 820 $ US | #57 |
| 2006 | 32 173 913 043 $ US | #56 |
| 2005 | 27 206 127 206 $ US | #55 |
| 2004 | 22 240 259 740 $ US | #52 |
| 2003 | 17 500 000 000 $ US | #51 |
| 2002 | 15 595 505 618 $ US | #51 |
| 2001 | 16 900 269 542 $ US | #51 |
| 2000 | 16 174 959 636 $ US | #50 |
| 1999 | 13 653 789 443 $ US | #51 |
| 1998 | 13 754 427 391 $ US | #48 |
| 1997 | 14 778 761 062 $ US | #49 |
| 1996 | 14 033 018 868 $ US | #48 |
| 1995 | 13 565 319 965 $ US | #47 |
| 1994 | 11 714 116 251 $ US | #46 |
| 1993 | 12 034 813 926 $ US | #44 |
| 1992 | 11 885 776 186 $ US | #46 |
| 1991 | 10 269 192 423 $ US | #46 |
| 1990 | 8 748 317 631 $ US | #50 |
| 1989 | 7 073 523 337 $ US | #50 |
| 1988 | 6 076 093 129 $ US | #49 |
| 1987 | 5 106 048 704 $ US | #48 |
| 1986 | 5 706 267 540 $ US | #47 |
| 1985 | 7 119 673 333 $ US | #44 |
| 1984 | 6 987 744 571 $ US | #42 |
| 1983 | 7 101 280 559 $ US | #41 |
| 1982 | 7 282 512 315 $ US | #40 |
| 1981 | 6 853 648 649 $ US | #39 |
| 1980 | 6 612 494 097 $ US | #41 |
| 1979 | 4 774 142 857 $ US | #43 |
| 1978 | 2 947 998 787 $ US | #45 |
| 1977 | 3 108 577 443 $ US | #43 |
| 1976 | 2 285 998 014 $ US | #46 |
| 1975 | 2 113 327 488 $ US | #43 |
| 1974 | 1 879 700 810 $ US | #47 |
| 1973 | 1 366 851 945 $ US | #47 |
| 1972 | 1 182 006 205 $ US | #45 |
| 1971 | 1 140 015 302 $ US | #44 |
| 1970 | 1 091 183 120 $ US | #41 |
| 1969 | 877 723 971 $ US | - |
| 1968 | 700 000 000 $ US | - |
| 1967 | 943 166 740 $ US | - |
| 1966 | 862 076 408 $ US | - |
| 1965 | 847 750 109 $ US | - |
| 1964 | 866 409 220 $ US | - |
| 1963 | 743 589 331 $ US | - |
| 1962 | 607 433 082 $ US | - |
| 1961 | 793 126 619 $ US | - |
| 1960 | 835 625 800 $ US | - |
En 2025, les exportations de biens et services de l'Égypte s'élevaient à 72,4 milliards de dollars, contre 836 millions de dollars en 1960. Le maximum a été de 75,6 milliards de dollars, en 2023. Elles se classaient au 54e rang mondial, en hausse par rapport au 58e rang en 2024. Leur meilleur rang a été le 39e, occupé pour la dernière fois en 1981.
En 2025, les exportations de biens et services de l'Égypte étaient les 3es plus élevées de 50 pays situés en Afrique, après celles de l'Afrique du Sud et du Maroc. Les importations de biens et services de l'Égypte s'élevaient à 115 milliards de dollars en 2025, au 46e rang mondial. En 2025, les importations de l'Égypte dépassaient ses exportations de 42,7 milliards de dollars, soit un déficit commercial.
Exportations de biens de l'Égypte par catégorie, 2025
Exportations de biens, 2025: 51,4 Md $US
En 2025, la première catégorie des exportations de biens de l'Égypte était « pétrole, gaz, minerais et autres matières premières », avec 19,8 %, suivie de « métaux précieux, pierres précieuses, bijoux, montres, instruments de musique et art », avec 14,8 %.
Destinations des exportations de biens de l'Égypte : les 10 premières, 2025
| Rang | Pays | Exportations de biens | Part | |
|---|---|---|---|---|
| 1 |
 EAU |
7,03 Md $US | 13,7 % | vs EAU |
| 2 |
 Italie |
4,04 Md $US | 7,87 % | vs Italie |
| 3 |
 Turquie |
3,30 Md $US | 6,41 % | vs Turquie |
| 4 |
 Arabie saoudite |
2,98 Md $US | 5,8 % | vs Arabie saoudite |
| 5 |
 États-Unis |
2,71 Md $US | 5,27 % | |
| 6 |
 Suisse |
1,76 Md $US | 3,42 % | vs Suisse |
| 7 |
 Royaume-Uni |
1,60 Md $US | 3,11 % | |
| 8 |
 Libye |
1,49 Md $US | 2,91 % | vs Libye |
| 9 |
 Espagne |
1,42 Md $US | 2,75 % | |
| 10 |
 Allemagne |
1,25 Md $US | 2,43 % | vs Allemagne |
| Autres partenaires et non précisés | 23,8 Md $US | 46,3 % |
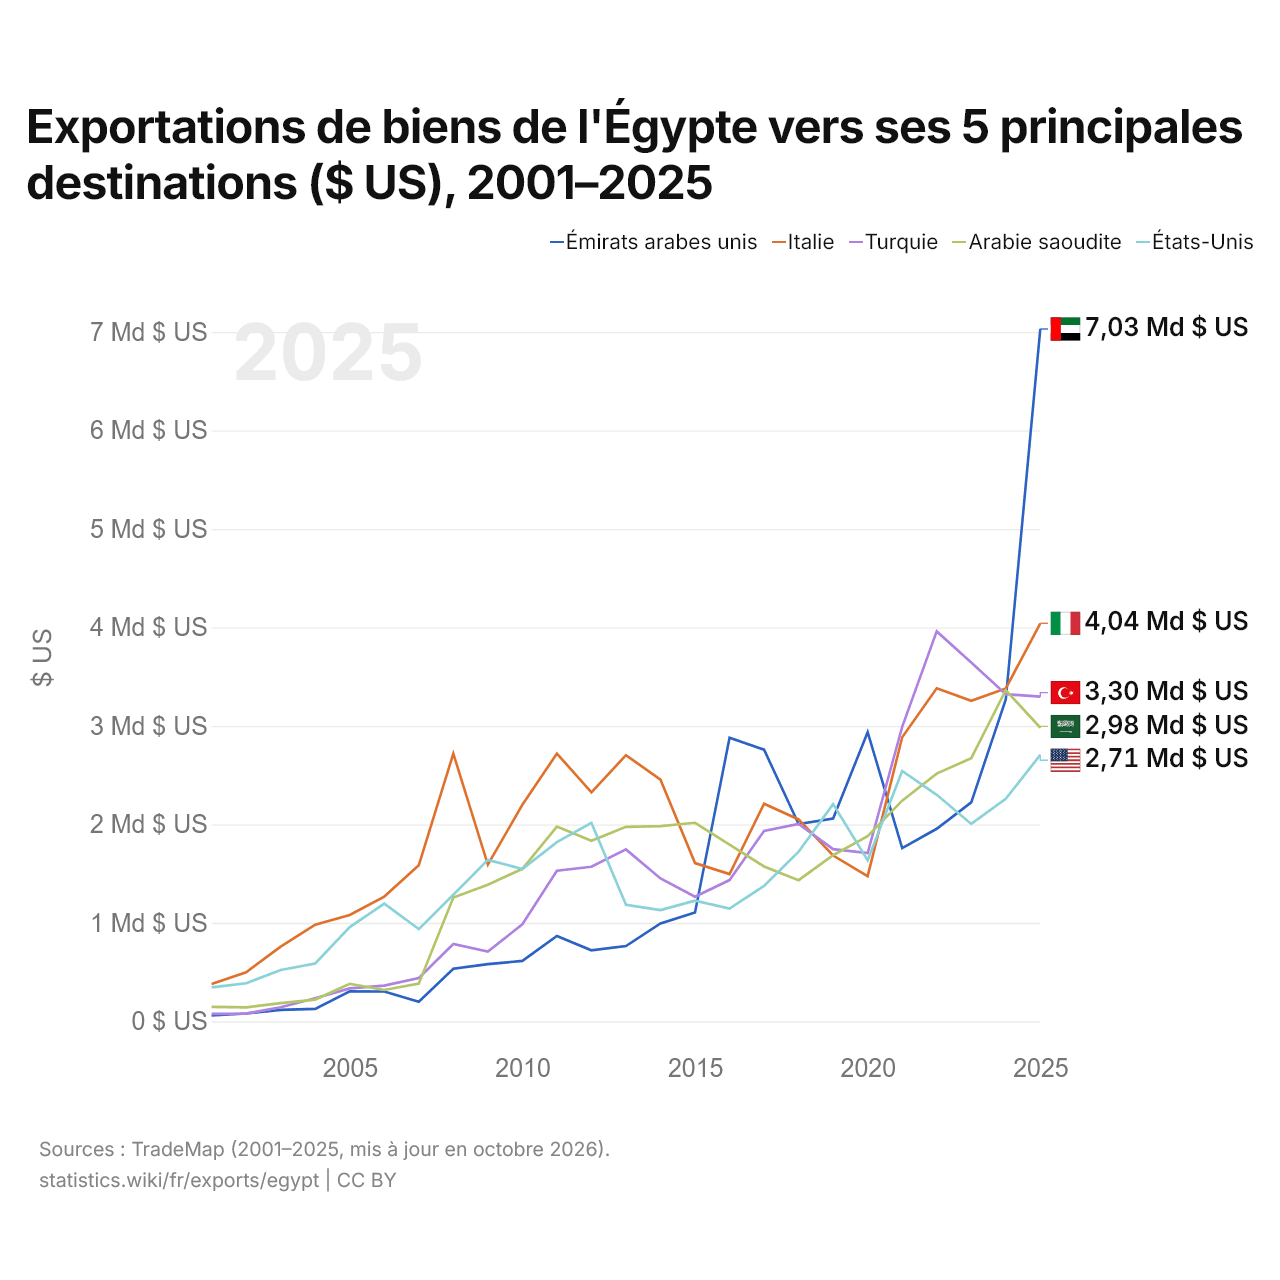
Exportations de biens de l'Égypte vers ses 5 principales destinations ($ US), 2001–2025
| Année | $ US | ||||
|---|---|---|---|---|---|
| Émirats arabes unis | Italie | Turquie | Arabie saoudite | États-Unis | |
| 2025 | 7 030 541 000 $ US | 4 042 095 000 $ US | 3 296 690 000 $ US | 2 981 209 000 $ US | 2 706 227 000 $ US |
| 2024 | 3 267 831 000 $ US | 3 380 330 000 $ US | 3 322 335 000 $ US | 3 363 183 000 $ US | 2 259 580 000 $ US |
| 2023 | 2 223 717 000 $ US | 3 254 920 000 $ US | 3 643 856 000 $ US | 2 671 807 000 $ US | 2 004 738 000 $ US |
| 2022 | 1 955 242 000 $ US | 3 382 272 000 $ US | 3 959 942 000 $ US | 2 515 921 000 $ US | 2 300 715 000 $ US |
| 2021 | 1 759 192 000 $ US | 2 884 392 000 $ US | 2 990 617 000 $ US | 2 241 117 000 $ US | 2 542 221 000 $ US |
| 2020 | 2 936 198 000 $ US | 1 474 435 000 $ US | 1 707 900 000 $ US | 1 879 584 000 $ US | 1 634 601 000 $ US |
| 2019 | 2 059 984 000 $ US | 1 683 577 000 $ US | 1 748 647 000 $ US | 1 686 442 000 $ US | 2 205 957 000 $ US |
| 2018 | 2 003 913 000 $ US | 2 050 260 000 $ US | 2 005 554 000 $ US | 1 433 387 000 $ US | 1 722 549 000 $ US |
| 2017 | 2 758 957 000 $ US | 2 209 526 000 $ US | 1 932 876 000 $ US | 1 572 721 000 $ US | 1 375 707 000 $ US |
| 2016 | 2 878 682 000 $ US | 1 494 627 000 $ US | 1 434 547 000 $ US | 1 794 301 000 $ US | 1 145 506 000 $ US |
| 2015 | 1 106 141 000 $ US | 1 607 135 000 $ US | 1 265 336 000 $ US | 2 016 459 000 $ US | 1 225 714 000 $ US |
| 2014 | 993 764 000 $ US | 2 454 462 000 $ US | 1 450 638 000 $ US | 1 981 655 000 $ US | 1 129 121 000 $ US |
| 2013 | 764 912 000 $ US | 2 702 821 000 $ US | 1 746 077 000 $ US | 1 975 234 000 $ US | 1 182 407 000 $ US |
| 2012 | 721 677 000 $ US | 2 324 482 000 $ US | 1 570 177 000 $ US | 1 832 800 000 $ US | 2 015 468 000 $ US |
| 2011 | 867 002 000 $ US | 2 719 707 000 $ US | 1 528 780 000 $ US | 1 977 694 000 $ US | 1 819 386 000 $ US |
| 2010 | 613 359 000 $ US | 2 199 155 000 $ US | 985 260 000 $ US | 1 548 992 000 $ US | 1 547 139 000 $ US |
| 2009 | 581 512 000 $ US | 1 590 892 000 $ US | 707 853 000 $ US | 1 386 987 000 $ US | 1 639 519 000 $ US |
| 2008 | 534 052 000 $ US | 2 718 715 000 $ US | 785 036 000 $ US | 1 257 323 000 $ US | 1 286 219 000 $ US |
| 2007 | 198 362 000 $ US | 1 584 879 000 $ US | 440 512 000 $ US | 383 708 000 $ US | 936 283 000 $ US |
| 2006 | 302 945 000 $ US | 1 266 342 000 $ US | 362 742 000 $ US | 318 312 000 $ US | 1 195 306 000 $ US |
| 2005 | 305 755 000 $ US | 1 079 869 000 $ US | 334 337 000 $ US | 381 177 000 $ US | 957 292 000 $ US |
| 2004 | 125 694 000 $ US | 982 141 000 $ US | 235 234 000 $ US | 221 003 000 $ US | 587 714 000 $ US |
| 2003 | 116 015 000 $ US | 757 750 000 $ US | 142 333 000 $ US | 185 074 000 $ US | 520 884 000 $ US |
| 2002 | 79 724 000 $ US | 498 707 000 $ US | 77 847 000 $ US | 142 317 000 $ US | 386 797 000 $ US |
| 2001 | 59 048 000 $ US | 378 555 000 $ US | 76 527 000 $ US | 146 882 000 $ US | 344 585 000 $ US |
En 2025, les exportations de biens s'élevaient à 7,03 milliards de dollars vers les Émirats arabes unis, 4,04 milliards de dollars vers l'Italie, 3,3 milliards de dollars vers la Turquie, 2,98 milliards de dollars vers l'Arabie saoudite et 2,71 milliards de dollars vers les États-Unis. Le changement le plus récent dans leur ordre remonte à 2025, quand les exportations de l'Égypte vers les Émirats arabes unis ont dépassé celles vers l'Italie.
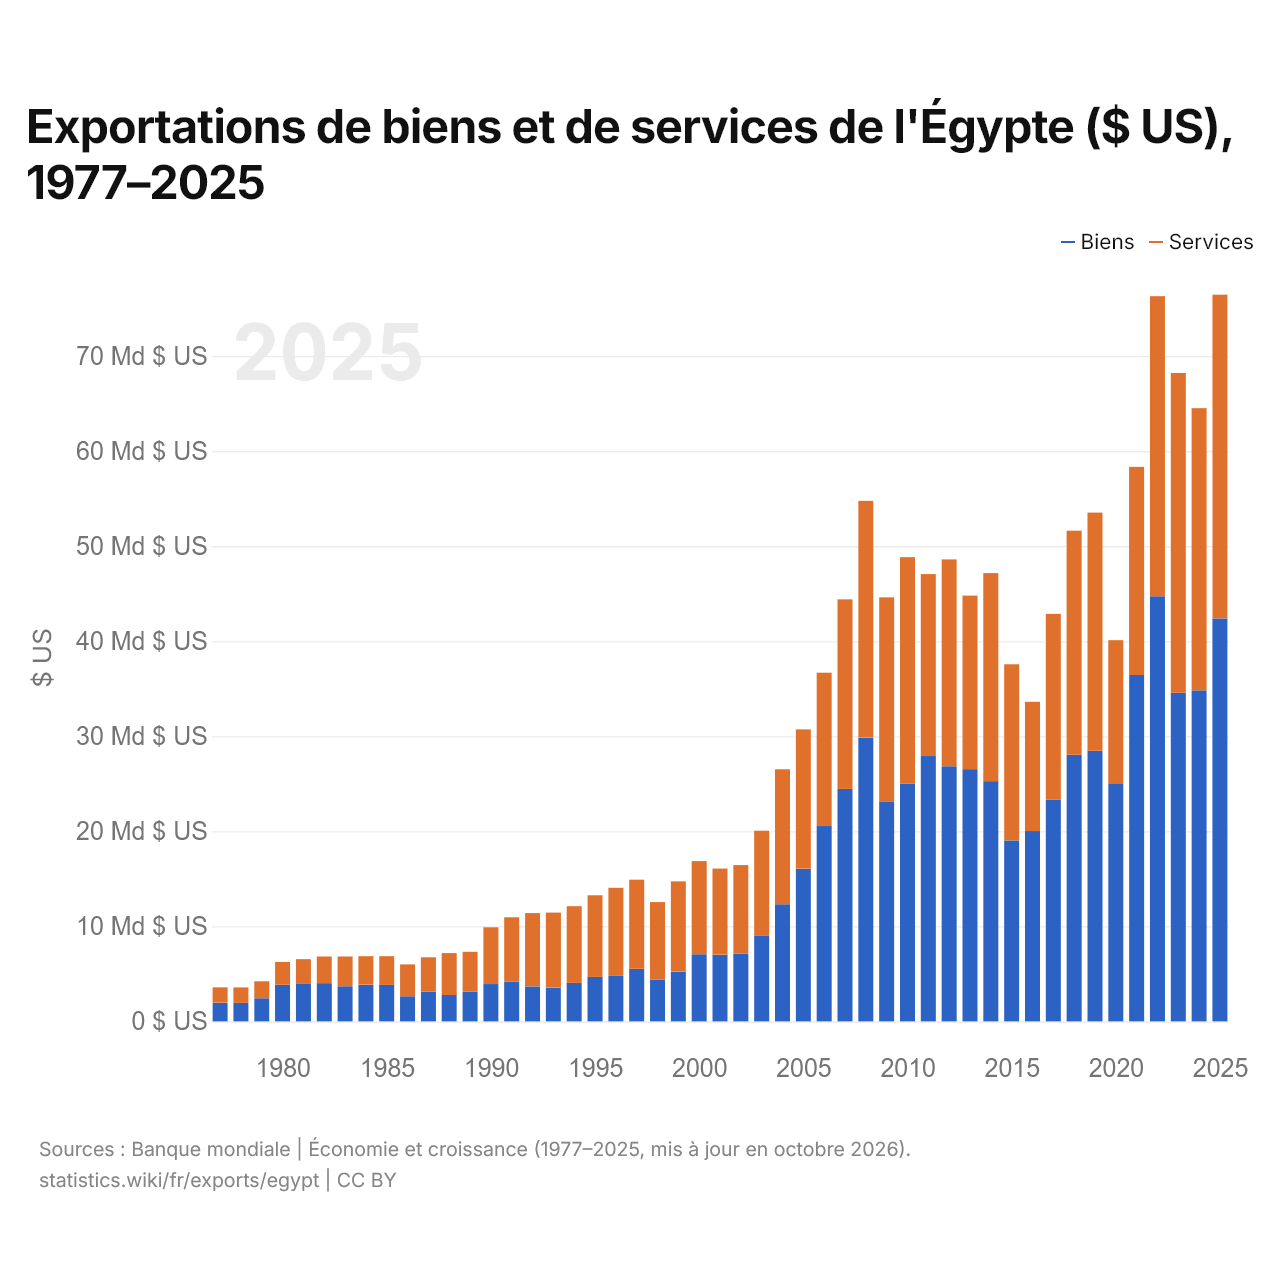
Exportations de biens et de services de l'Égypte ($ US), 1977–2025
| Année | $ US | |
|---|---|---|
| Biens | Services | |
| 2025 | 42 387 700 000 $ US | 34 068 400 000 $ US |
| 2024 | 34 822 700 000 $ US | 29 684 800 000 $ US |
| 2023 | 34 568 500 000 $ US | 33 649 000 000 $ US |
| 2022 | 44 721 800 000 $ US | 31 573 639 000 $ US |
| 2021 | 36 442 176 000 $ US | 21 897 142 000 $ US |
| 2020 | 25 049 007 000 $ US | 15 052 700 000 $ US |
| 2019 | 28 472 107 000 $ US | 25 050 500 000 $ US |
| 2018 | 28 045 807 000 $ US | 23 573 700 000 $ US |
| 2017 | 23 339 400 000 $ US | 19 535 300 000 $ US |
| 2016 | 20 018 300 000 $ US | 13 606 000 000 $ US |
| 2015 | 19 030 900 000 $ US | 18 538 500 000 $ US |
| 2014 | 25 268 700 000 $ US | 21 897 600 000 $ US |
| 2013 | 26 533 700 000 $ US | 18 261 500 000 $ US |
| 2012 | 26 834 500 000 $ US | 21 766 800 000 $ US |
| 2011 | 27 913 400 000 $ US | 19 139 600 000 $ US |
| 2010 | 25 024 200 000 $ US | 23 807 000 000 $ US |
| 2009 | 23 089 300 000 $ US | 21 519 800 000 $ US |
| 2008 | 29 849 000 000 $ US | 24 911 900 000 $ US |
| 2007 | 24 454 600 000 $ US | 19 943 400 000 $ US |
| 2006 | 20 545 600 000 $ US | 16 134 500 000 $ US |
| 2005 | 16 073 200 000 $ US | 14 642 600 000 $ US |
| 2004 | 12 319 600 000 $ US | 14 196 600 000 $ US |
| 2003 | 8 987 300 000 $ US | 11 073 000 000 $ US |
| 2002 | 7 117 700 000 $ US | 9 320 200 000 $ US |
| 2001 | 7 024 900 000 $ US | 9 042 300 000 $ US |
| 2000 | 7 061 000 000 $ US | 9 803 000 000 $ US |
| 1999 | 5 236 500 000 $ US | 9 493 700 000 $ US |
| 1998 | 4 403 000 000 $ US | 8 141 000 000 $ US |
| 1997 | 5 525 300 000 $ US | 9 379 900 000 $ US |
| 1996 | 4 779 000 000 $ US | 9 271 000 000 $ US |
| 1995 | 4 670 000 000 $ US | 8 590 000 000 $ US |
| 1994 | 4 044 000 000 $ US | 8 070 000 000 $ US |
| 1993 | 3 545 000 000 $ US | 7 895 000 000 $ US |
| 1992 | 3 670 000 000 $ US | 7 716 000 000 $ US |
| 1991 | 4 164 000 000 $ US | 6 783 000 000 $ US |
| 1990 | 3 924 000 000 $ US | 5 971 000 000 $ US |
| 1989 | 3 118 818 182 $ US | 4 202 909 091 $ US |
| 1988 | 2 769 714 286 $ US | 4 407 571 429 $ US |
| 1987 | 3 115 142 857 $ US | 3 626 857 143 $ US |
| 1986 | 2 632 285 714 $ US | 3 358 000 000 $ US |
| 1985 | 3 835 571 429 $ US | 3 023 571 429 $ US |
| 1984 | 3 864 142 859 $ US | 2 989 714 287 $ US |
| 1983 | 3 693 000 005 $ US | 3 133 000 004 $ US |
| 1982 | 4 018 000 006 $ US | 2 800 142 861 $ US |
| 1981 | 3 998 714 291 $ US | 2 537 000 004 $ US |
| 1980 | 3 853 571 434 $ US | 2 392 714 289 $ US |
| 1979 | 2 424 000 003 $ US | 1 787 857 145 $ US |
| 1978 | 1 938 896 773 $ US | 1 633 252 838 $ US |
| 1977 | 1 973 907 826 $ US | 1 600 797 336 $ US |
En 2025, les exportations de biens de l'Égypte s'élevaient à 42,4 milliards de dollars et celles de services à 34,1 milliards de dollars ; les services représentaient 44,6 % du total, contre 44,8 % en 1977.
L'Égypte dans le classement mondial des exportations, 2025







Exportations de biens et services de l'Égypte, % du PIB, 1960–2025
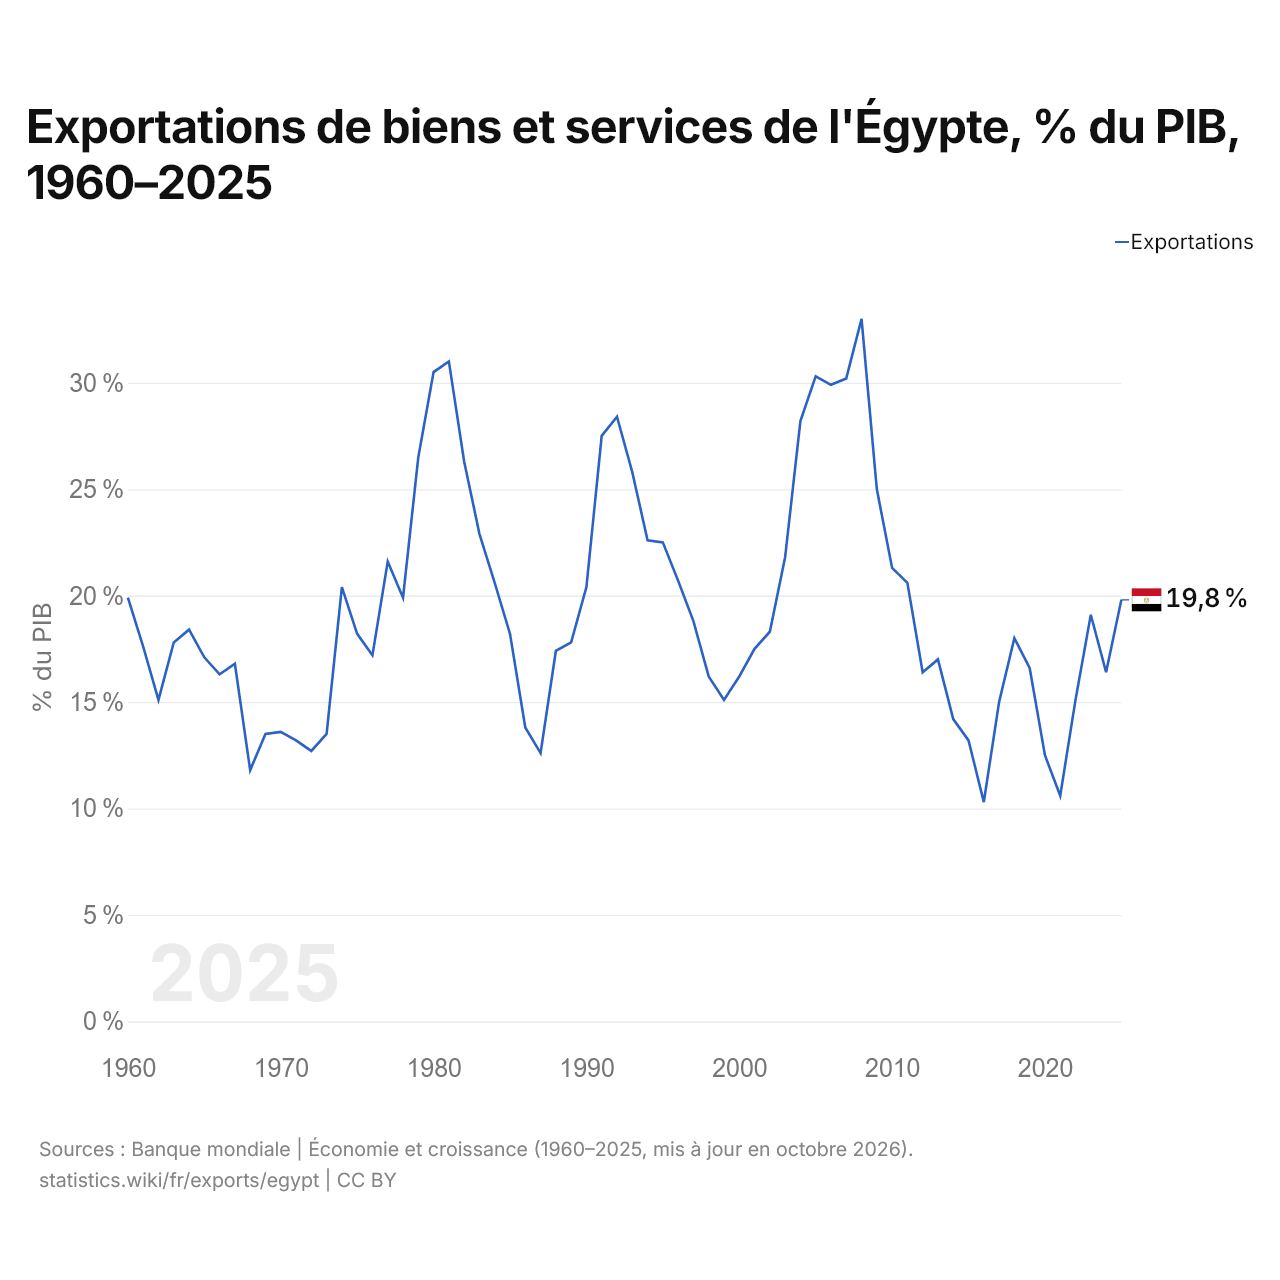
En 2025, les exportations de biens et services de l'Égypte équivalaient à 19,8 % de son PIB, contre 19,9 % en 1960. La part la plus élevée a été de 33,0 %, en 2008.
Comparer les exportations de l'Égypte avec celles d'autres pays
Sources :
- TradeMap (2001–2025, mis à jour en octobre 2026)
- Banque mondiale | Économie et croissance (1960–2025, mis à jour en octobre 2026)
Creative Commons Attribution (CC BY) : vous pouvez copier, partager, adapter et réutiliser ce contenu, y compris à des fins commerciales, à condition de citer statistics.wiki et d’indiquer les modifications apportées. Les sources citées ci-dessus peuvent avoir leurs propres conditions de licence.