
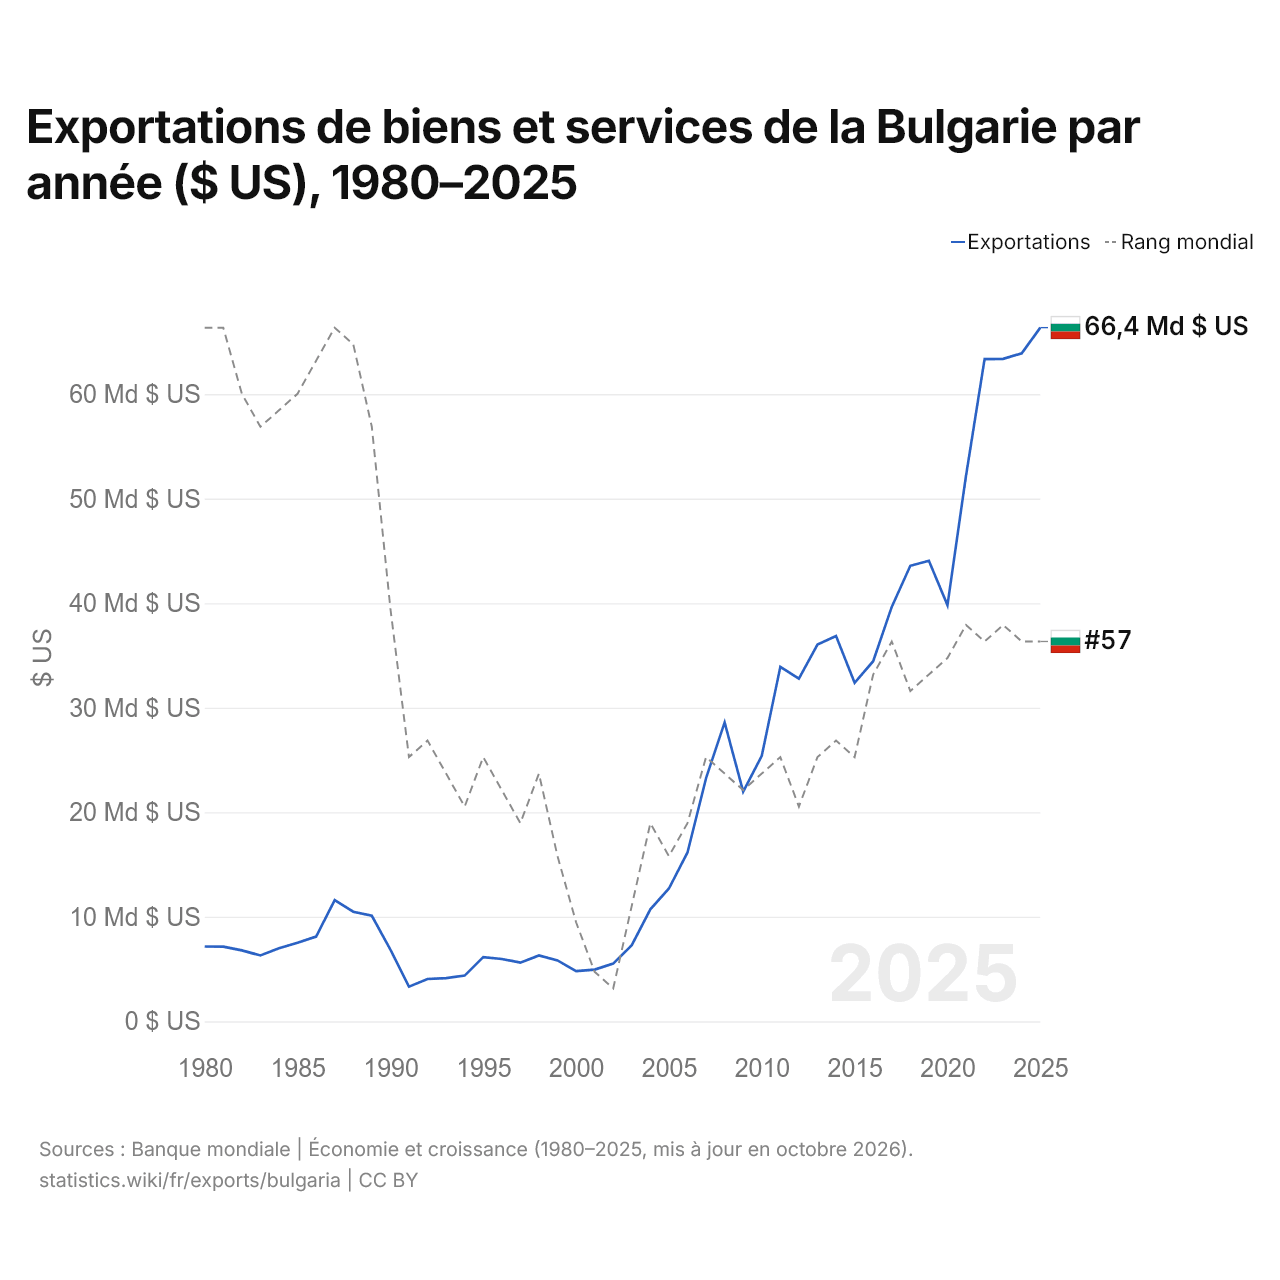
Exportations de biens et services de la Bulgarie par année ($ US), 1980–2025
| Année | $ US | Rang mondial |
|---|---|---|
| Exportations | Rang mondial | |
| 2025 | 66 354 382 381 $ US | #57 |
| 2024 | 63 894 874 228 $ US | #57 |
| 2023 | 63 371 847 847 $ US | #56 |
| 2022 | 63 338 969 112 $ US | #57 |
| 2021 | 52 188 034 904 $ US | #56 |
| 2020 | 39 809 586 250 $ US | #58 |
| 2019 | 44 053 127 057 $ US | #59 |
| 2018 | 43 572 669 715 $ US | #60 |
| 2017 | 39 638 742 331 $ US | #57 |
| 2016 | 34 441 575 794 $ US | #59 |
| 2015 | 32 383 417 568 $ US | #64 |
| 2014 | 36 848 064 410 $ US | #63 |
| 2013 | 36 041 537 034 $ US | #64 |
| 2012 | 32 767 921 910 $ US | #67 |
| 2011 | 33 911 530 785 $ US | #64 |
| 2010 | 25 395 522 756 $ US | #65 |
| 2009 | 21 964 974 098 $ US | #66 |
| 2008 | 28 591 649 714 $ US | #65 |
| 2007 | 23 263 189 914 $ US | #64 |
| 2006 | 16 152 072 593 $ US | #68 |
| 2005 | 12 703 659 939 $ US | #70 |
| 2004 | 10 713 880 327 $ US | #68 |
| 2003 | 7 277 821 210 $ US | #73 |
| 2002 | 5 519 464 526 $ US | #78 |
| 2001 | 4 947 626 204 $ US | #77 |
| 2000 | 4 797 791 666 $ US | #74 |
| 1999 | 5 830 130 224 $ US | #70 |
| 1998 | 6 304 548 123 $ US | #65 |
| 1997 | 5 610 391 097 $ US | #68 |
| 1996 | 5 962 986 680 $ US | #66 |
| 1995 | 6 142 087 839 $ US | #64 |
| 1994 | 4 373 762 116 $ US | #67 |
| 1993 | 4 138 612 933 $ US | #65 |
| 1992 | 4 052 975 879 $ US | #63 |
| 1991 | 3 316 878 143 $ US | #64 |
| 1990 | 6 864 510 321 $ US | #55 |
| 1989 | 10 094 532 671 $ US | #44 |
| 1988 | 10 481 297 226 $ US | #39 |
| 1987 | 11 595 544 133 $ US | #38 |
| 1986 | 8 111 526 000 $ US | #40 |
| 1985 | 7 515 998 369 $ US | #42 |
| 1984 | 6 987 153 874 $ US | #43 |
| 1983 | 6 300 586 601 $ US | #44 |
| 1982 | 6 789 013 094 $ US | #42 |
| 1981 | 7 148 240 030 $ US | #38 |
| 1980 | 7 155 026 071 $ US | #38 |
En 2025, les exportations de biens et services de la Bulgarie s'élevaient à 66,4 milliards de dollars, contre 7,16 milliards de dollars en 1980. Le minimum a été de 3,32 milliards de dollars, en 1991. Elles se classaient au 57e rang mondial, un rang qu'elles occupent depuis 2024. Leur meilleur rang a été le 38e, occupé pour la dernière fois en 1987.
En 2025, les exportations de biens et services de la Bulgarie étaient les 25es plus élevées de 41 pays situés en Europe. Les importations de biens et services de la Bulgarie s'élevaient à 67,7 milliards de dollars en 2025, au 58e rang mondial. En 2025, les importations de la Bulgarie dépassaient ses exportations de 1,36 milliard de dollars, soit un déficit commercial.
Exportations de biens de la Bulgarie par catégorie, 2025
Exportations de biens, 2025: 47,1 Md $US
En 2025, la première catégorie des exportations de biens de la Bulgarie était « machines, électronique et véhicules », avec 26,1 %, suivie de « métaux communs (fer, acier, cuivre, aluminium) », avec 15,6 %.
Destinations des exportations de biens de la Bulgarie : les 10 premières, 2025
| Rang | Pays | Exportations de biens | Part | |
|---|---|---|---|---|
| 1 |
 Allemagne |
6,74 Md $US | 14,3 % | |
| 2 |
 Roumanie |
4,95 Md $US | 10,5 % | vs Roumanie |
| 3 |
 Turquie |
3,38 Md $US | 7,19 % | vs Turquie |
| 4 |
 Italie |
3,06 Md $US | 6,5 % | |
| 5 |
 Grèce |
2,85 Md $US | 6,06 % | vs Grèce |
| 6 |
 France |
1,49 Md $US | 3,17 % | vs France |
| 7 |
 Pologne |
1,24 Md $US | 2,62 % | vs Pologne |
| 8 |
 Serbie |
1,16 Md $US | 2,46 % | vs Serbie |
| 9 |
 États-Unis |
1,02 Md $US | 2,16 % | |
| 10 |
 Espagne |
1,01 Md $US | 2,14 % | |
| Autres partenaires et non précisés | 20,2 Md $US | 42,8 % |
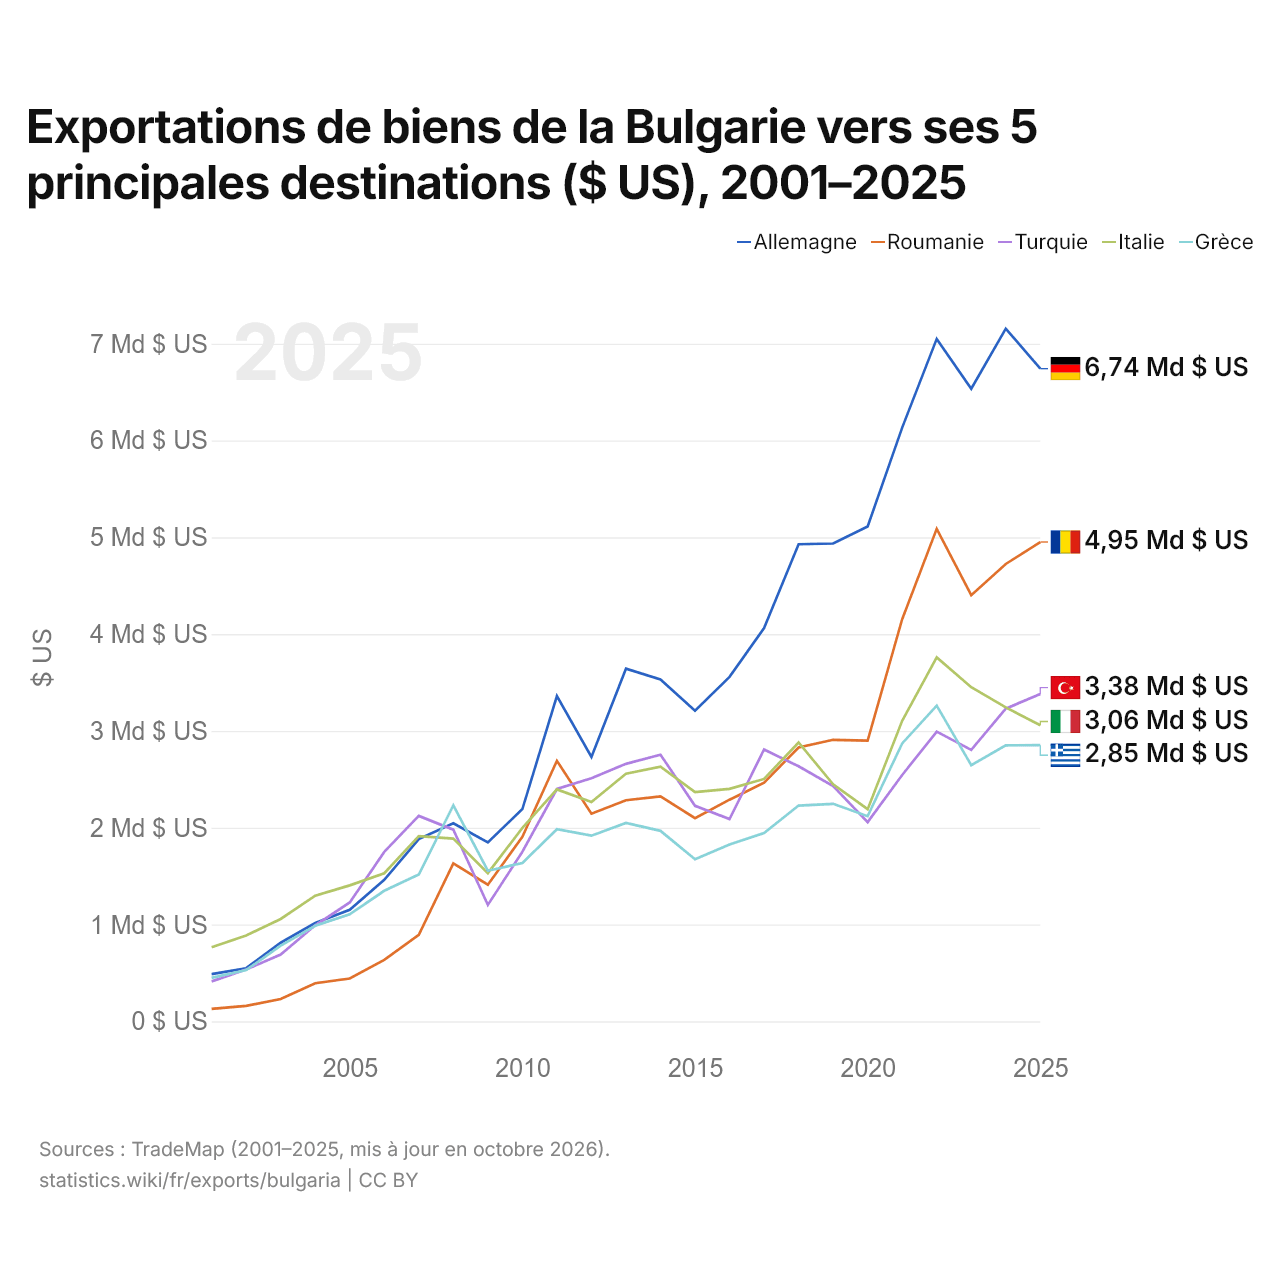
Exportations de biens de la Bulgarie vers ses 5 principales destinations ($ US), 2001–2025
| Année | $ US | ||||
|---|---|---|---|---|---|
| Allemagne | Roumanie | Turquie | Italie | Grèce | |
| 2025 | 6 742 302 000 $ US | 4 951 317 000 $ US | 3 381 586 000 $ US | 3 058 481 000 $ US | 2 852 551 000 $ US |
| 2024 | 7 155 159 000 $ US | 4 724 615 000 $ US | 3 229 882 000 $ US | 3 242 795 000 $ US | 2 851 225 000 $ US |
| 2023 | 6 534 396 000 $ US | 4 402 428 000 $ US | 2 804 727 000 $ US | 3 451 382 000 $ US | 2 646 219 000 $ US |
| 2022 | 7 049 846 000 $ US | 5 087 682 000 $ US | 2 992 283 000 $ US | 3 759 818 000 $ US | 3 261 815 000 $ US |
| 2021 | 6 133 091 000 $ US | 4 154 193 000 $ US | 2 545 051 000 $ US | 3 104 311 000 $ US | 2 870 769 000 $ US |
| 2020 | 5 111 440 000 $ US | 2 899 170 000 $ US | 2 057 648 000 $ US | 2 191 743 000 $ US | 2 119 488 000 $ US |
| 2019 | 4 935 691 000 $ US | 2 908 043 000 $ US | 2 430 948 000 $ US | 2 448 517 000 $ US | 2 246 478 000 $ US |
| 2018 | 4 928 454 000 $ US | 2 828 781 000 $ US | 2 634 408 000 $ US | 2 880 440 000 $ US | 2 229 080 000 $ US |
| 2017 | 4 062 248 000 $ US | 2 465 859 000 $ US | 2 808 037 000 $ US | 2 504 197 000 $ US | 1 945 477 000 $ US |
| 2016 | 3 558 195 000 $ US | 2 289 704 000 $ US | 2 089 809 000 $ US | 2 401 566 000 $ US | 1 825 985 000 $ US |
| 2015 | 3 208 180 000 $ US | 2 099 242 000 $ US | 2 226 661 000 $ US | 2 368 077 000 $ US | 1 674 873 000 $ US |
| 2014 | 3 531 031 000 $ US | 2 324 535 000 $ US | 2 754 704 000 $ US | 2 631 388 000 $ US | 1 967 619 000 $ US |
| 2013 | 3 643 394 000 $ US | 2 283 382 000 $ US | 2 659 720 000 $ US | 2 557 021 000 $ US | 2 050 051 000 $ US |
| 2012 | 2 730 658 000 $ US | 2 145 408 000 $ US | 2 510 923 000 $ US | 2 264 808 000 $ US | 1 918 142 000 $ US |
| 2011 | 3 360 052 000 $ US | 2 691 285 000 $ US | 2 400 252 000 $ US | 2 396 150 000 $ US | 1 984 801 000 $ US |
| 2010 | 2 193 058 000 $ US | 1 905 349 000 $ US | 1 752 207 000 $ US | 1 997 584 000 $ US | 1 634 953 000 $ US |
| 2009 | 1 847 883 000 $ US | 1 410 954 000 $ US | 1 202 780 000 $ US | 1 530 646 000 $ US | 1 556 235 000 $ US |
| 2008 | 2 045 845 000 $ US | 1 631 157 000 $ US | 1 979 821 000 $ US | 1 887 175 000 $ US | 2 230 536 000 $ US |
| 2007 | 1 882 133 000 $ US | 892 645 000 $ US | 2 122 243 000 $ US | 1 913 961 000 $ US | 1 516 762 000 $ US |
| 2006 | 1 461 604 000 $ US | 635 153 000 $ US | 1 750 544 000 $ US | 1 529 689 000 $ US | 1 348 599 000 $ US |
| 2005 | 1 151 986 000 $ US | 442 358 000 $ US | 1 228 563 000 $ US | 1 404 508 000 $ US | 1 105 108 000 $ US |
| 2004 | 1 015 034 000 $ US | 393 979 000 $ US | 992 000 000 $ US | 1 297 847 000 $ US | 986 665 000 $ US |
| 2003 | 812 088 000 $ US | 229 948 000 $ US | 689 947 000 $ US | 1 057 468 000 $ US | 781 806 000 $ US |
| 2002 | 548 768 000 $ US | 160 002 000 $ US | 535 798 000 $ US | 886 150 000 $ US | 528 999 000 $ US |
| 2001 | 487 854 000 $ US | 128 999 000 $ US | 412 690 000 $ US | 765 339 000 $ US | 448 560 000 $ US |
En 2025, les exportations de biens s'élevaient à 6,74 milliards de dollars vers l'Allemagne, 4,95 milliards de dollars vers la Roumanie, 3,38 milliards de dollars vers la Turquie, 3,06 milliards de dollars vers l'Italie et 2,85 milliards de dollars vers la Grèce. Le premier rang des cinq destinations de la Bulgarie est occupé par l'Allemagne depuis 2009. Le changement le plus récent dans leur ordre remonte à 2025, quand les exportations de la Bulgarie vers la Turquie ont dépassé celles vers l'Italie.
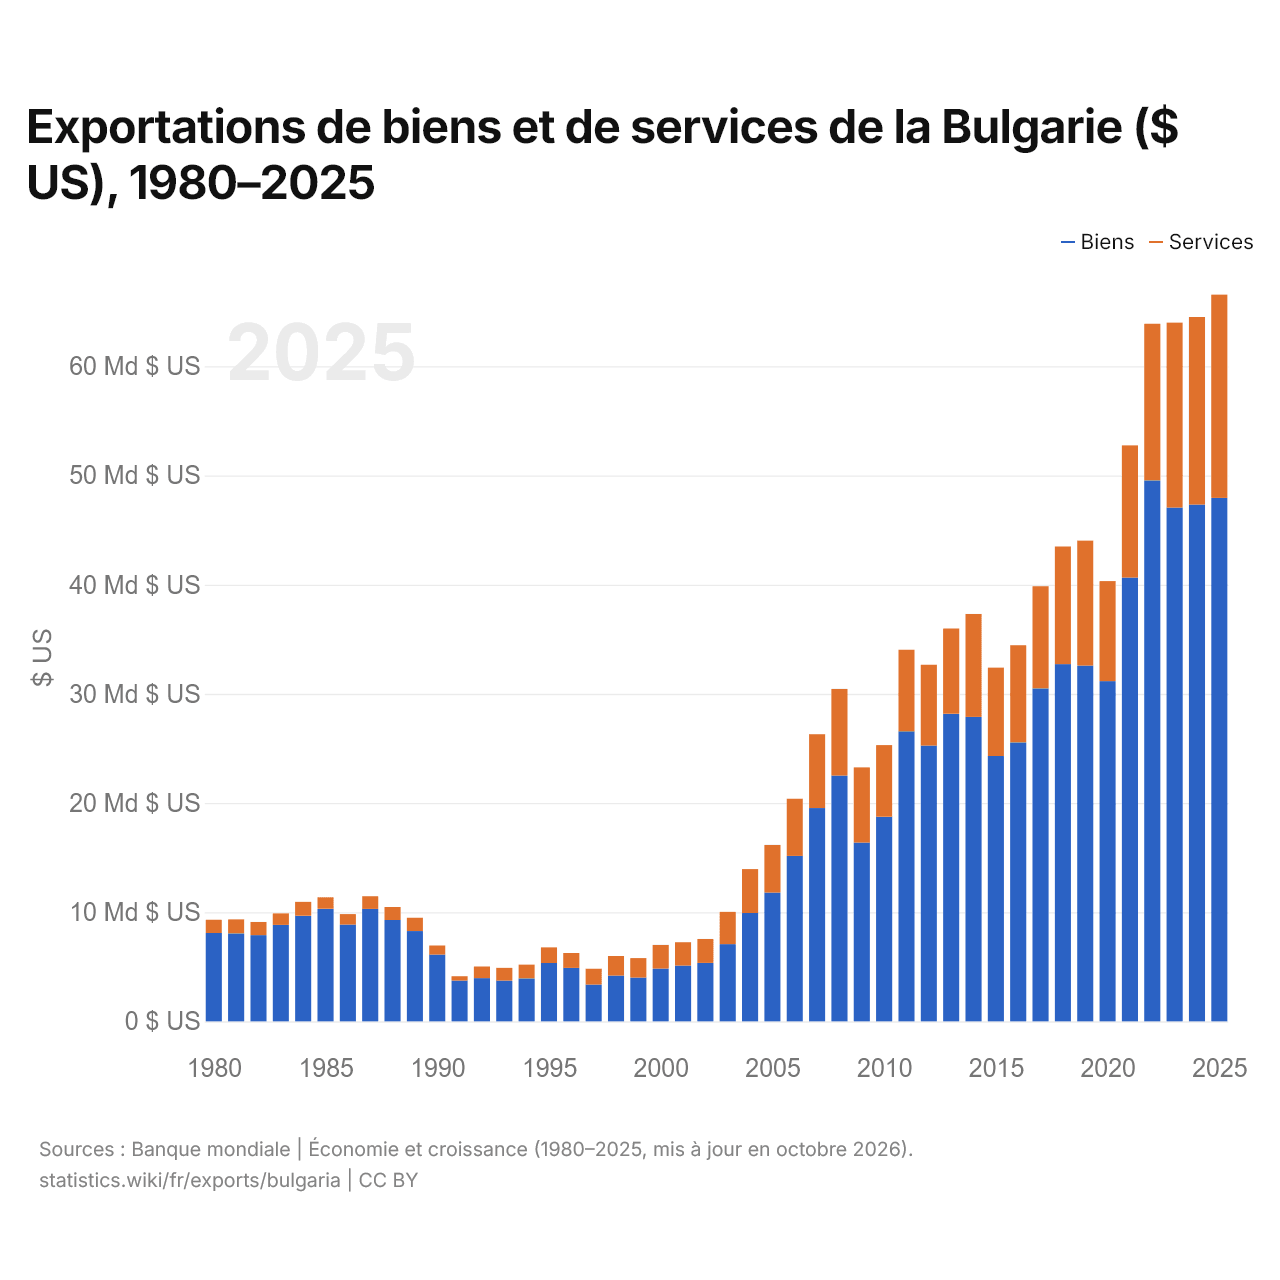
Exportations de biens et de services de la Bulgarie ($ US), 1980–2025
| Année | $ US | |
|---|---|---|
| Biens | Services | |
| 2025 | 47 941 040 000 $ US | 18 618 670 000 $ US |
| 2024 | 47 342 760 000 $ US | 17 169 830 000 $ US |
| 2023 | 47 066 100 000 $ US | 16 927 610 000 $ US |
| 2022 | 49 548 890 000 $ US | 14 347 370 000 $ US |
| 2021 | 40 647 310 000 $ US | 12 111 900 000 $ US |
| 2020 | 31 160 920 000 $ US | 9 165 550 000 $ US |
| 2019 | 32 591 660 000 $ US | 11 440 320 000 $ US |
| 2018 | 32 721 830 000 $ US | 10 772 570 000 $ US |
| 2017 | 30 498 370 000 $ US | 9 356 320 000 $ US |
| 2016 | 25 549 570 000 $ US | 8 897 580 000 $ US |
| 2015 | 24 301 220 000 $ US | 8 095 300 000 $ US |
| 2014 | 27 891 560 000 $ US | 9 422 660 000 $ US |
| 2013 | 28 171 460 000 $ US | 7 808 700 000 $ US |
| 2012 | 25 263 630 000 $ US | 7 400 520 000 $ US |
| 2011 | 26 566 780 000 $ US | 7 464 330 000 $ US |
| 2010 | 18 741 520 000 $ US | 6 562 370 000 $ US |
| 2009 | 16 379 999 294 $ US | 6 884 922 077 $ US |
| 2008 | 22 503 649 095 $ US | 7 942 552 536 $ US |
| 2007 | 19 533 494 152 $ US | 6 764 550 199 $ US |
| 2006 | 15 154 046 460 $ US | 5 236 689 664 $ US |
| 2005 | 11 790 949 973 $ US | 4 367 284 984 $ US |
| 2004 | 9 921 386 893 $ US | 4 019 949 221 $ US |
| 2003 | 7 069 157 199 $ US | 2 955 221 161 $ US |
| 2002 | 5 352 471 319 $ US | 2 189 892 523 $ US |
| 2001 | 5 105 025 672 $ US | 2 142 725 252 $ US |
| 2000 | 4 824 629 175 $ US | 2 175 171 700 $ US |
| 1999 | 4 006 367 182 $ US | 1 788 407 576 $ US |
| 1998 | 4 193 499 000 $ US | 1 787 809 215 $ US |
| 1997 | 3 358 500 000 $ US | 1 460 800 000 $ US |
| 1996 | 4 890 200 000 $ US | 1 366 000 000 $ US |
| 1995 | 5 345 000 000 $ US | 1 431 400 000 $ US |
| 1994 | 3 935 100 000 $ US | 1 256 900 000 $ US |
| 1993 | 3 726 500 000 $ US | 1 171 300 000 $ US |
| 1992 | 3 956 400 000 $ US | 1 070 300 000 $ US |
| 1991 | 3 737 000 000 $ US | 399 900 000 $ US |
| 1990 | 6 113 000 000 $ US | 837 000 000 $ US |
| 1989 | 8 268 000 000 $ US | 1 223 000 000 $ US |
| 1988 | 9 283 000 000 $ US | 1 186 000 000 $ US |
| 1987 | 10 297 000 000 $ US | 1 158 000 000 $ US |
| 1986 | 8 862 000 000 $ US | 958 000 000 $ US |
| 1985 | 10 313 000 000 $ US | 1 047 000 000 $ US |
| 1984 | 9 671 000 000 $ US | 1 273 000 000 $ US |
| 1983 | 8 829 000 000 $ US | 1 059 000 000 $ US |
| 1982 | 7 894 000 000 $ US | 1 207 000 000 $ US |
| 1981 | 8 052 000 000 $ US | 1 284 000 000 $ US |
| 1980 | 8 091 000 000 $ US | 1 211 000 000 $ US |
En 2025, les exportations de biens de la Bulgarie s'élevaient à 47,9 milliards de dollars et celles de services à 18,6 milliards de dollars ; les services représentaient 28,0 % du total, contre 13,0 % en 1980.
La Bulgarie dans le classement mondial des exportations, 2025







Exportations de biens et services de la Bulgarie, % du PIB, 1980–2025
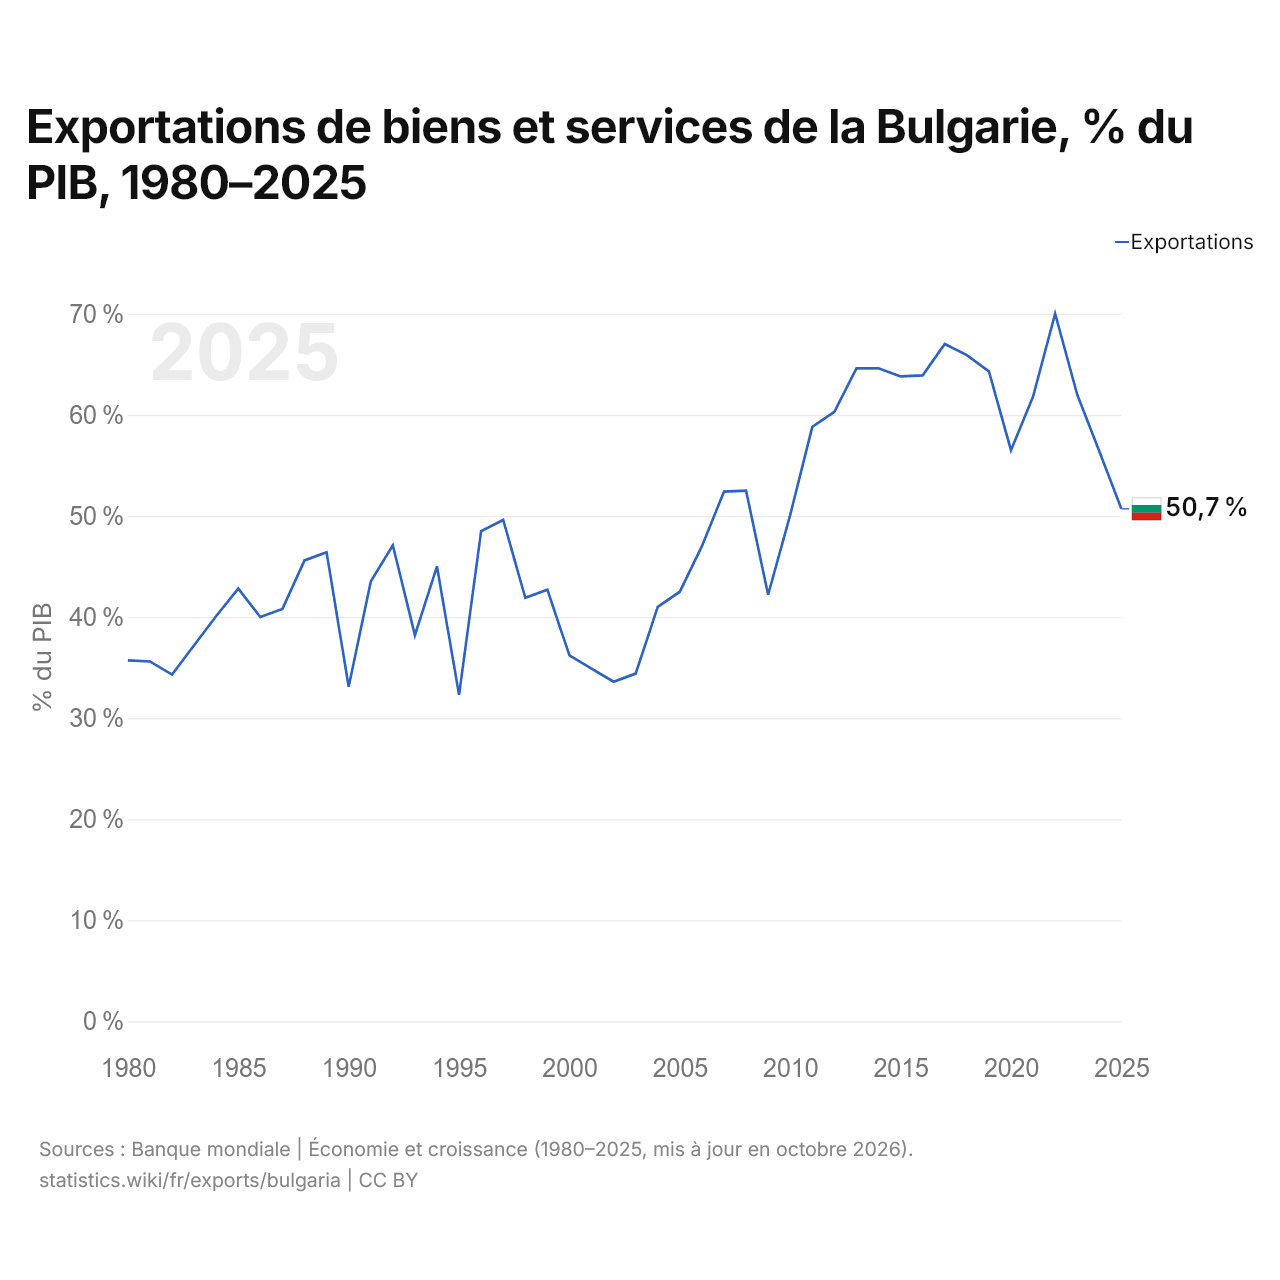
En 2025, les exportations de biens et services de la Bulgarie équivalaient à 50,7 % de son PIB, contre 35,7 % en 1980. La part la plus élevée a été de 70,0 %, en 2022.
Comparer les exportations de la Bulgarie avec celles d'autres pays
Sources :
- TradeMap (2001–2025, mis à jour en octobre 2026)
- Banque mondiale | Économie et croissance (1980–2025, mis à jour en octobre 2026)
Creative Commons Attribution (CC BY) : vous pouvez copier, partager, adapter et réutiliser ce contenu, y compris à des fins commerciales, à condition de citer statistics.wiki et d’indiquer les modifications apportées. Les sources citées ci-dessus peuvent avoir leurs propres conditions de licence.