
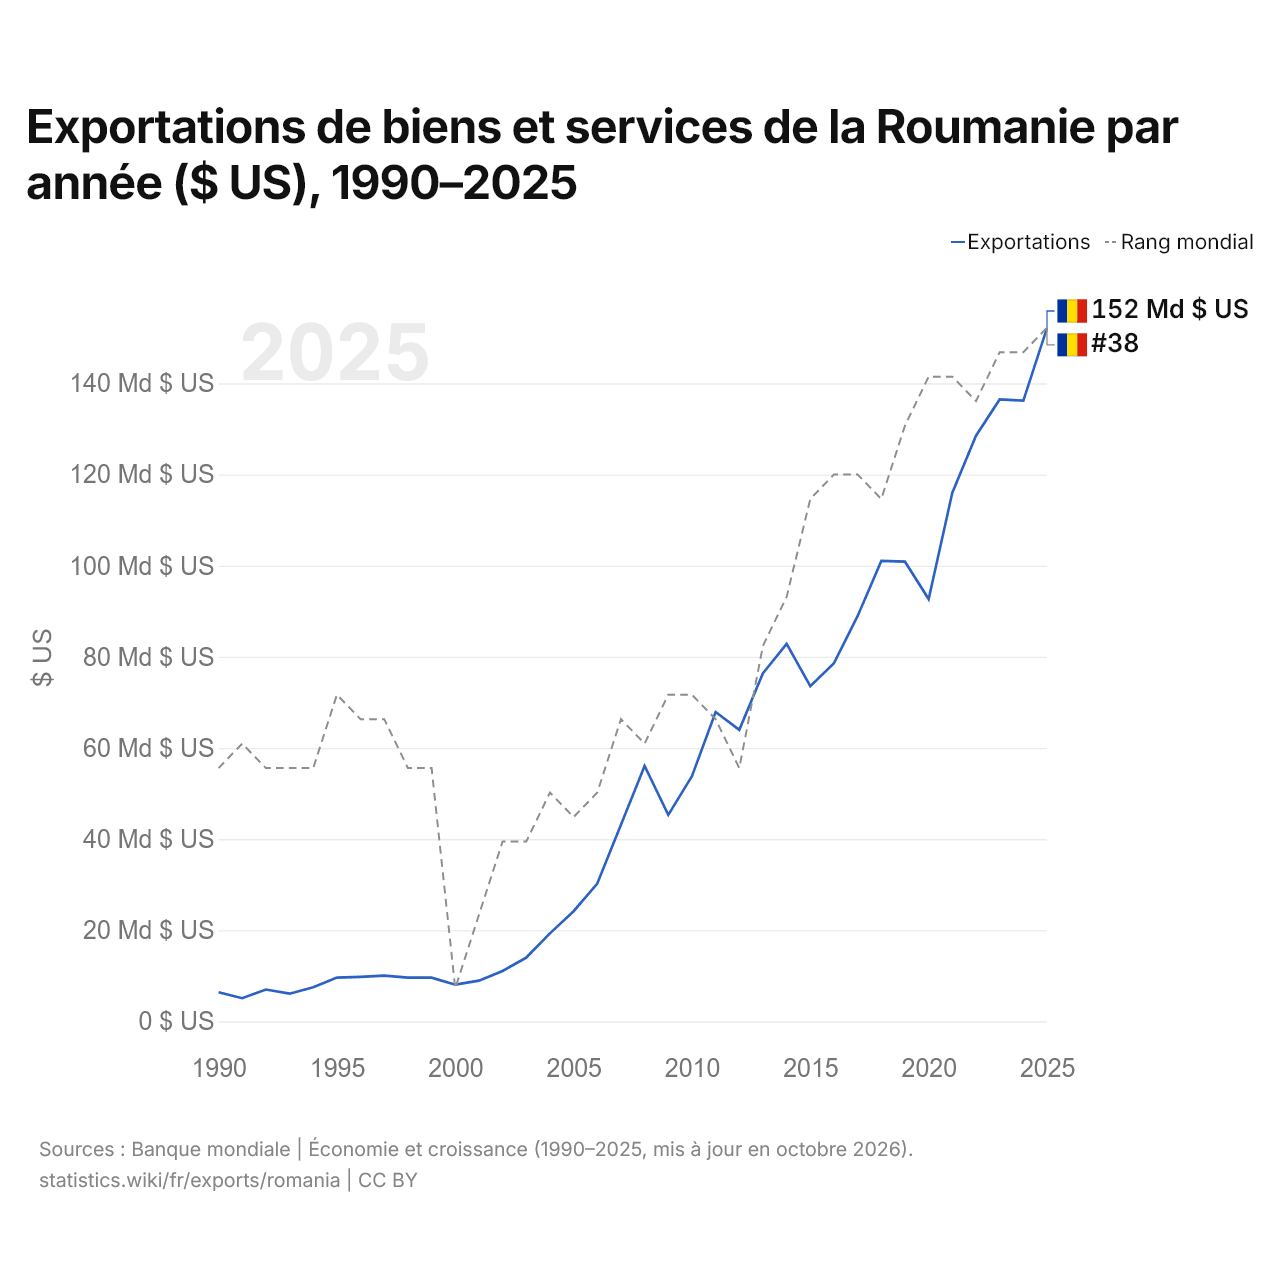
Exportations de biens et services de la Roumanie par année ($ US), 1990–2025
| Année | $ US | Rang mondial |
|---|---|---|
| Exportations | Rang mondial | |
| 2025 | 152 113 432 502 $ US | #38 |
| 2024 | 136 204 440 675 $ US | #39 |
| 2023 | 136 476 225 871 $ US | #39 |
| 2022 | 128 501 972 912 $ US | #41 |
| 2021 | 116 008 484 761 $ US | #40 |
| 2020 | 92 658 765 316 $ US | #40 |
| 2019 | 100 870 449 571 $ US | #42 |
| 2018 | 101 030 592 267 $ US | #45 |
| 2017 | 88 964 370 565 $ US | #44 |
| 2016 | 78 593 549 490 $ US | #44 |
| 2015 | 73 554 067 275 $ US | #45 |
| 2014 | 82 838 251 211 $ US | #49 |
| 2013 | 76 385 138 211 $ US | #51 |
| 2012 | 63 959 863 906 $ US | #56 |
| 2011 | 67 874 157 648 $ US | #54 |
| 2010 | 53 811 070 204 $ US | #53 |
| 2009 | 45 307 699 245 $ US | #53 |
| 2008 | 56 055 402 885 $ US | #55 |
| 2007 | 43 142 335 692 $ US | #54 |
| 2006 | 30 226 776 025 $ US | #57 |
| 2005 | 24 155 999 359 $ US | #58 |
| 2004 | 19 301 170 435 $ US | #57 |
| 2003 | 13 996 506 634 $ US | #59 |
| 2002 | 11 061 722 688 $ US | #59 |
| 2001 | 8 929 729 715 $ US | #62 |
| 2000 | 8 042 666 726 $ US | #65 |
| 1999 | 9 585 764 933 $ US | #56 |
| 1998 | 9 596 555 943 $ US | #56 |
| 1997 | 10 031 194 458 $ US | #54 |
| 1996 | 9 772 624 067 $ US | #54 |
| 1995 | 9 593 366 383 $ US | #53 |
| 1994 | 7 488 535 367 $ US | #56 |
| 1993 | 6 067 363 989 $ US | #56 |
| 1992 | 6 981 666 667 $ US | #56 |
| 1991 | 5 077 889 776 $ US | #55 |
| 1990 | 6 397 681 676 $ US | #56 |
En 2025, les exportations de biens et services de la Roumanie s'élevaient à 152 milliards de dollars, contre 6,4 milliards de dollars en 1990. Le minimum a été de 5,08 milliards de dollars, en 1991. Elles se classaient au 38e rang mondial, en hausse par rapport au 39e rang en 2024.
En 2025, les exportations de biens et services de la Roumanie étaient les 19es plus élevées de 41 pays situés en Europe. Les importations de biens et services de la Roumanie s'élevaient à 175 milliards de dollars en 2025, au 36e rang mondial. En 2025, les importations de la Roumanie dépassaient ses exportations de 22,5 milliards de dollars, soit un déficit commercial.
Exportations de biens de la Roumanie par catégorie, 2025
Exportations de biens, 2025: 109 Md $US
En 2025, la première catégorie des exportations de biens de la Roumanie était « machines, électronique et véhicules », avec 49,7 %, suivie de « pétrole, gaz, minerais et autres matières premières », avec 10,0 %.
Destinations des exportations de biens de la Roumanie : les 10 premières, 2025
| Rang | Pays | Exportations de biens | Part | |
|---|---|---|---|---|
| 1 |
 Allemagne |
21,8 Md $US | 20 % | vs Allemagne |
| 2 |
 Italie |
9,70 Md $US | 8,9 % | vs Italie |
| 3 |
 France |
6,84 Md $US | 6,27 % | vs France |
| 4 |
 Hongrie |
6,03 Md $US | 5,53 % | vs Hongrie |
| 5 |
 Bulgarie |
4,71 Md $US | 4,32 % | vs Bulgarie |
| 6 |
 Pays-Bas |
4,46 Md $US | 4,09 % | |
| 7 |
 Turquie |
4,38 Md $US | 4,02 % | vs Turquie |
| 8 |
 Pologne |
4,36 Md $US | 4 % | vs Pologne |
| 9 |
 Tchéquie |
3,53 Md $US | 3,24 % | vs Tchéquie |
| 10 |
 Moldavie |
3,27 Md $US | 3 % | vs Moldavie |
| Autres partenaires et non précisés | 40,0 Md $US | 36,7 % |
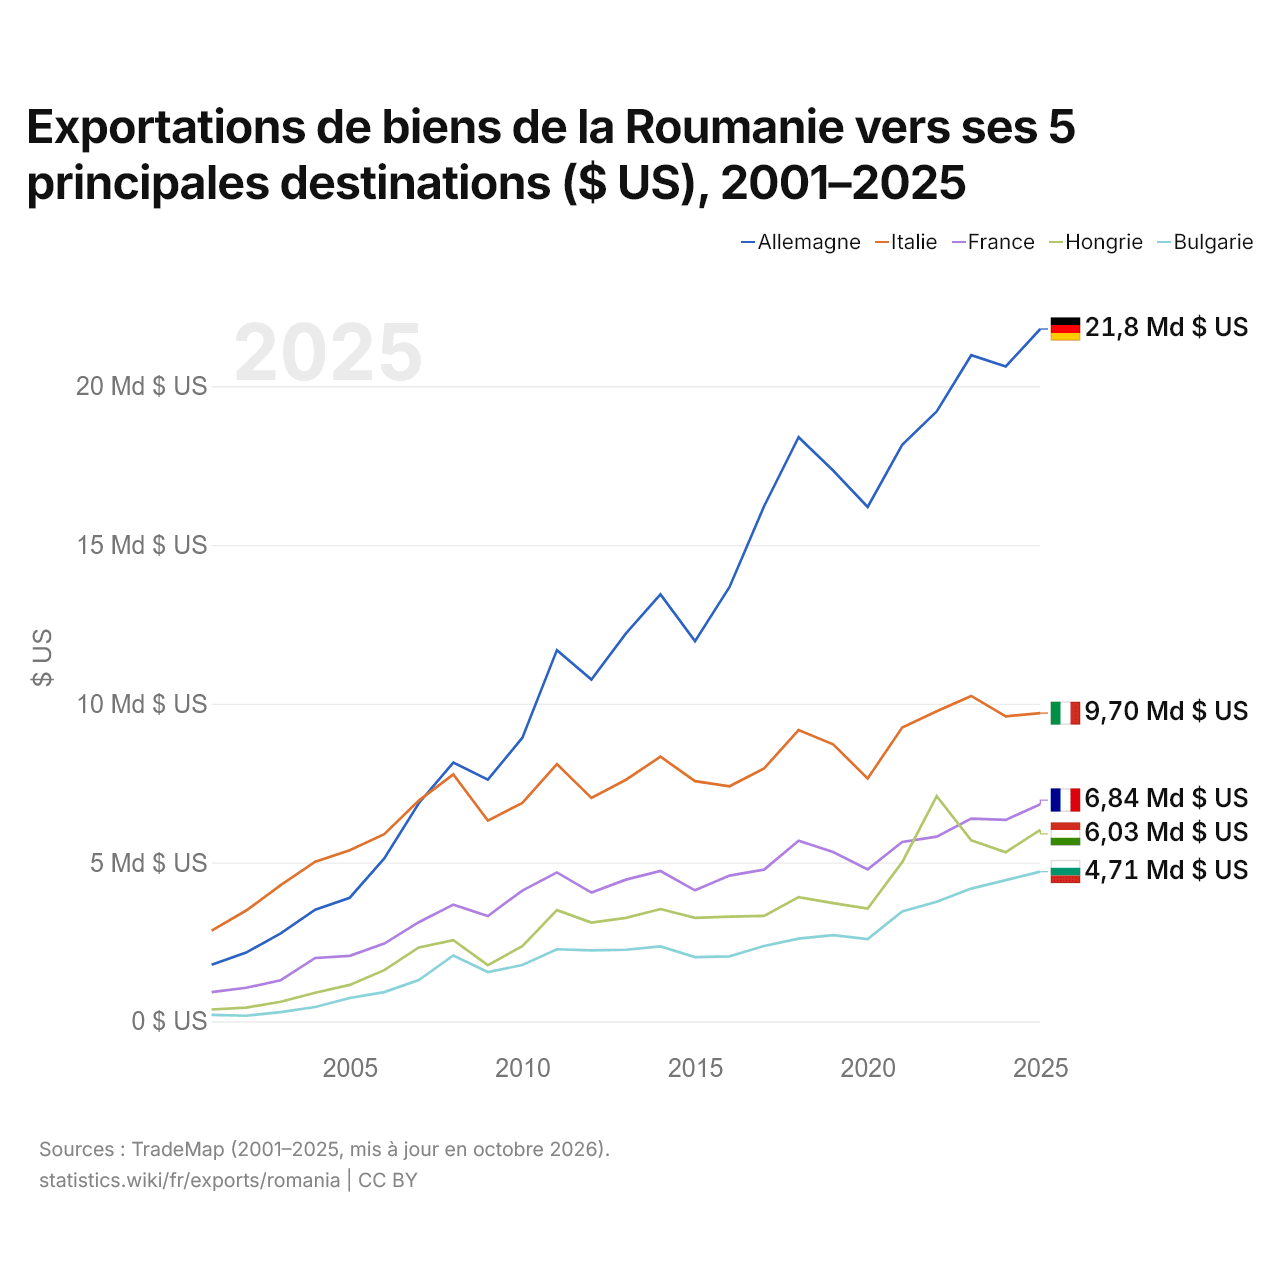
Exportations de biens de la Roumanie vers ses 5 principales destinations ($ US), 2001–2025
| Année | $ US | ||||
|---|---|---|---|---|---|
| Allemagne | Italie | France | Hongrie | Bulgarie | |
| 2025 | 21 797 351 000 $ US | 9 704 591 000 $ US | 6 837 188 000 $ US | 6 031 357 000 $ US | 4 714 052 000 $ US |
| 2024 | 20 618 520 000 $ US | 9 602 414 000 $ US | 6 342 364 000 $ US | 5 325 393 000 $ US | 4 447 093 000 $ US |
| 2023 | 20 973 002 000 $ US | 10 244 686 000 $ US | 6 383 473 000 $ US | 5 698 841 000 $ US | 4 178 331 000 $ US |
| 2022 | 19 202 057 000 $ US | 9 761 670 000 $ US | 5 815 442 000 $ US | 7 088 133 000 $ US | 3 763 155 000 $ US |
| 2021 | 18 153 087 000 $ US | 9 251 499 000 $ US | 5 647 386 000 $ US | 5 011 873 000 $ US | 3 459 541 000 $ US |
| 2020 | 16 193 180 000 $ US | 7 645 913 000 $ US | 4 782 411 000 $ US | 3 547 298 000 $ US | 2 588 939 000 $ US |
| 2019 | 17 343 320 000 $ US | 8 722 038 000 $ US | 5 330 921 000 $ US | 3 723 309 000 $ US | 2 716 467 000 $ US |
| 2018 | 18 391 579 000 $ US | 9 169 956 000 $ US | 5 686 512 000 $ US | 3 909 901 000 $ US | 2 603 494 000 $ US |
| 2017 | 16 217 812 000 $ US | 7 961 226 000 $ US | 4 776 154 000 $ US | 3 320 944 000 $ US | 2 372 988 000 $ US |
| 2016 | 13 675 875 000 $ US | 7 400 000 000 $ US | 4 589 081 000 $ US | 3 295 009 000 $ US | 2 047 435 000 $ US |
| 2015 | 11 969 665 000 $ US | 7 561 315 000 $ US | 4 124 736 000 $ US | 3 259 095 000 $ US | 2 021 623 000 $ US |
| 2014 | 13 440 966 000 $ US | 8 332 586 000 $ US | 4 733 135 000 $ US | 3 536 216 000 $ US | 2 359 220 000 $ US |
| 2013 | 12 215 477 000 $ US | 7 606 651 000 $ US | 4 461 131 000 $ US | 3 257 143 000 $ US | 2 254 353 000 $ US |
| 2012 | 10 762 246 000 $ US | 7 033 430 000 $ US | 4 052 581 000 $ US | 3 110 201 000 $ US | 2 231 553 000 $ US |
| 2011 | 11 687 889 000 $ US | 8 099 369 000 $ US | 4 688 019 000 $ US | 3 501 243 000 $ US | 2 270 265 000 $ US |
| 2010 | 8 928 650 000 $ US | 6 878 057 000 $ US | 4 115 436 000 $ US | 2 364 258 000 $ US | 1 771 007 000 $ US |
| 2009 | 7 607 412 000 $ US | 6 318 173 000 $ US | 3 316 366 000 $ US | 1 769 623 000 $ US | 1 550 931 000 $ US |
| 2008 | 8 148 007 000 $ US | 7 774 655 000 $ US | 3 673 697 000 $ US | 2 556 428 000 $ US | 2 072 042 000 $ US |
| 2007 | 6 867 377 000 $ US | 6 949 538 000 $ US | 3 120 872 000 $ US | 2 324 768 000 $ US | 1 301 868 000 $ US |
| 2006 | 5 130 532 000 $ US | 5 894 503 000 $ US | 2 446 195 000 $ US | 1 610 586 000 $ US | 919 989 000 $ US |
| 2005 | 3 890 606 000 $ US | 5 383 704 000 $ US | 2 063 080 000 $ US | 1 147 259 000 $ US | 735 150 000 $ US |
| 2004 | 3 513 899 000 $ US | 5 025 275 000 $ US | 1 994 744 000 $ US | 898 109 000 $ US | 451 280 000 $ US |
| 2003 | 2 771 025 000 $ US | 4 288 322 000 $ US | 1 295 174 000 $ US | 617 172 000 $ US | 289 216 000 $ US |
| 2002 | 2 165 526 000 $ US | 3 488 530 000 $ US | 1 056 154 000 $ US | 431 038 000 $ US | 176 615 000 $ US |
| 2001 | 1 781 128 000 $ US | 2 853 966 000 $ US | 918 979 000 $ US | 371 466 000 $ US | 202 170 000 $ US |
En 2025, les exportations de biens s'élevaient à 21,8 milliards de dollars vers l'Allemagne, 9,7 milliards de dollars vers l'Italie, 6,84 milliards de dollars vers la France, 6,03 milliards de dollars vers la Hongrie et 4,71 milliards de dollars vers la Bulgarie. Le premier rang des cinq destinations de la Roumanie est occupé par l'Allemagne depuis 2008. Le changement le plus récent dans leur ordre remonte à 2023, quand les exportations de la Roumanie vers la France ont dépassé celles vers la Hongrie.
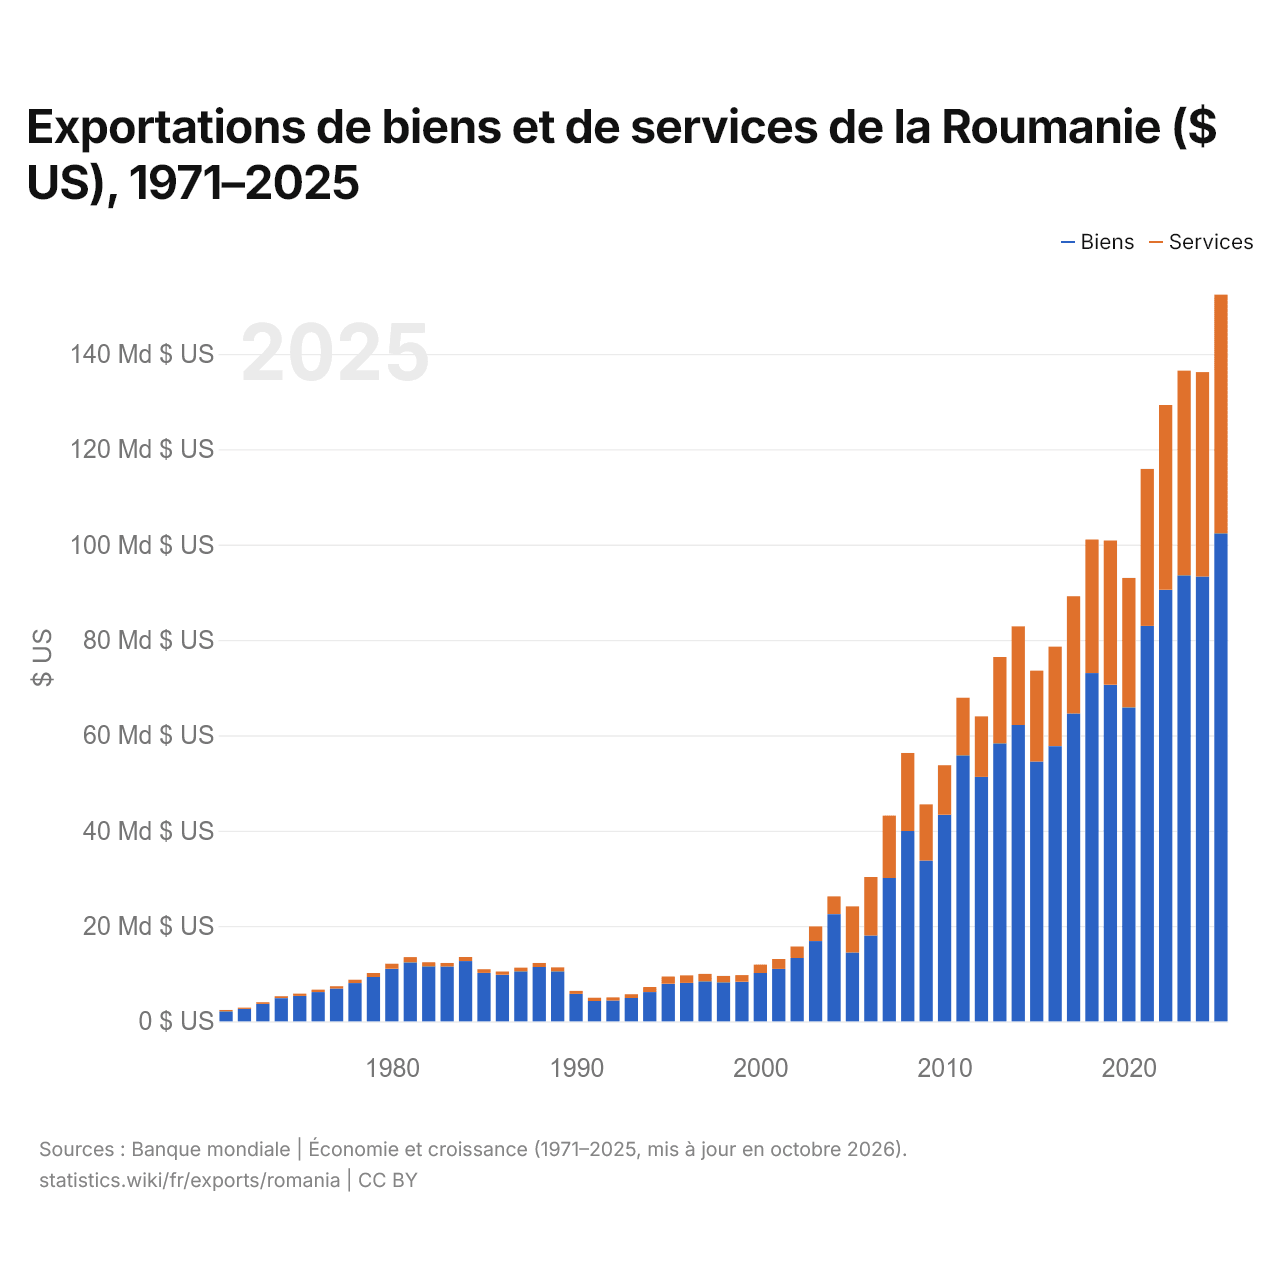
Exportations de biens et de services de la Roumanie ($ US), 1971–2025
| Année | $ US | |
|---|---|---|
| Biens | Services | |
| 2025 | 102 366 257 574 $ US | 50 061 495 301 $ US |
| 2024 | 93 290 447 809 $ US | 42 886 218 650 $ US |
| 2023 | 93 566 726 931 $ US | 42 920 721 848 $ US |
| 2022 | 90 527 724 907 $ US | 38 757 962 221 $ US |
| 2021 | 82 964 854 563 $ US | 32 909 210 226 $ US |
| 2020 | 65 859 398 891 $ US | 27 145 025 355 $ US |
| 2019 | 70 622 099 296 $ US | 30 240 338 401 $ US |
| 2018 | 73 050 449 613 $ US | 28 007 732 328 $ US |
| 2017 | 64 585 299 890 $ US | 24 594 588 932 $ US |
| 2016 | 57 715 591 931 $ US | 20 884 911 476 $ US |
| 2015 | 54 502 076 901 $ US | 19 050 853 405 $ US |
| 2014 | 62 164 702 975 $ US | 20 692 073 726 $ US |
| 2013 | 58 312 628 708 $ US | 18 102 045 640 $ US |
| 2012 | 51 267 857 469 $ US | 12 692 032 820 $ US |
| 2011 | 55 793 768 176 $ US | 12 085 197 402 $ US |
| 2010 | 43 347 321 846 $ US | 10 380 510 348 $ US |
| 2009 | 33 710 931 123 $ US | 11 798 530 483 $ US |
| 2008 | 39 933 517 650 $ US | 16 356 330 994 $ US |
| 2007 | 30 070 071 881 $ US | 13 092 354 292 $ US |
| 2006 | 18 002 765 601 $ US | 12 268 192 991 $ US |
| 2005 | 14 451 881 702 $ US | 9 668 082 197 $ US |
| 2004 | 22 478 000 000 $ US | 3 742 000 000 $ US |
| 2003 | 16 843 000 000 $ US | 3 080 000 000 $ US |
| 2002 | 13 293 000 000 $ US | 2 410 000 000 $ US |
| 2001 | 11 016 000 000 $ US | 2 058 000 000 $ US |
| 2000 | 10 143 000 000 $ US | 1 762 000 000 $ US |
| 1999 | 8 307 000 000 $ US | 1 380 000 000 $ US |
| 1998 | 8 189 000 000 $ US | 1 332 000 000 $ US |
| 1997 | 8 403 000 000 $ US | 1 543 000 000 $ US |
| 1996 | 8 068 000 000 $ US | 1 572 000 000 $ US |
| 1995 | 7 900 000 000 $ US | 1 503 000 000 $ US |
| 1994 | 6 146 000 000 $ US | 1 049 000 000 $ US |
| 1993 | 4 892 000 000 $ US | 799 000 000 $ US |
| 1992 | 4 364 000 000 $ US | 659 000 000 $ US |
| 1991 | 4 266 000 000 $ US | 680 000 000 $ US |
| 1990 | 5 770 000 000 $ US | 610 000 000 $ US |
| 1989 | 10 487 000 000 $ US | 834 000 000 $ US |
| 1988 | 11 392 000 000 $ US | 850 000 000 $ US |
| 1987 | 10 491 000 000 $ US | 770 000 000 $ US |
| 1986 | 9 763 000 000 $ US | 681 000 000 $ US |
| 1985 | 10 174 000 000 $ US | 746 000 000 $ US |
| 1984 | 12 646 000 000 $ US | 840 000 000 $ US |
| 1983 | 11 512 000 000 $ US | 727 000 000 $ US |
| 1982 | 11 559 000 000 $ US | 825 000 000 $ US |
| 1981 | 12 367 000 000 $ US | 1 095 000 000 $ US |
| 1980 | 11 024 000 000 $ US | 1 063 000 000 $ US |
| 1979 | 9 303 000 000 $ US | 830 000 000 $ US |
| 1978 | 8 022 000 000 $ US | 706 000 000 $ US |
| 1977 | 6 859 000 000 $ US | 498 000 000 $ US |
| 1976 | 6 134 000 000 $ US | 508 000 000 $ US |
| 1975 | 5 341 000 000 $ US | 471 000 000 $ US |
| 1974 | 4 858 000 000 $ US | 419 000 000 $ US |
| 1973 | 3 667 000 000 $ US | 338 000 000 $ US |
| 1972 | 2 599 000 000 $ US | 265 000 000 $ US |
| 1971 | 2 102 000 000 $ US | 280 000 000 $ US |
En 2025, les exportations de biens de la Roumanie s'élevaient à 102 milliards de dollars et celles de services à 50,1 milliards de dollars ; les services représentaient 32,8 % du total, contre 11,8 % en 1971.
La Roumanie dans le classement mondial des exportations, 2025
| Rang | Pays | Exportations | Part mondiale | |
|---|---|---|---|---|
| 35 |
 Luxembourg |
193 Md $US | 0,55 % | vs Luxembourg |
| 36 |
Hongrie
|
179 Md $US | 0,51 % | vs Hongrie |
| 37 |
 Israël |
168 Md $US | 0,48 % | |
| 38 |
 Roumanie |
152 Md $US | 0,44 % | |
| 39 |
 Portugal |
151 Md $US | 0,43 % | vs Portugal |
| 40 |
 Finlande |
134 Md $US | 0,38 % | |
| 41 |
 Afrique du Sud |
134 Md $US | 0,38 % |
Exportations de biens et services de la Roumanie, % du PIB, 1990–2025
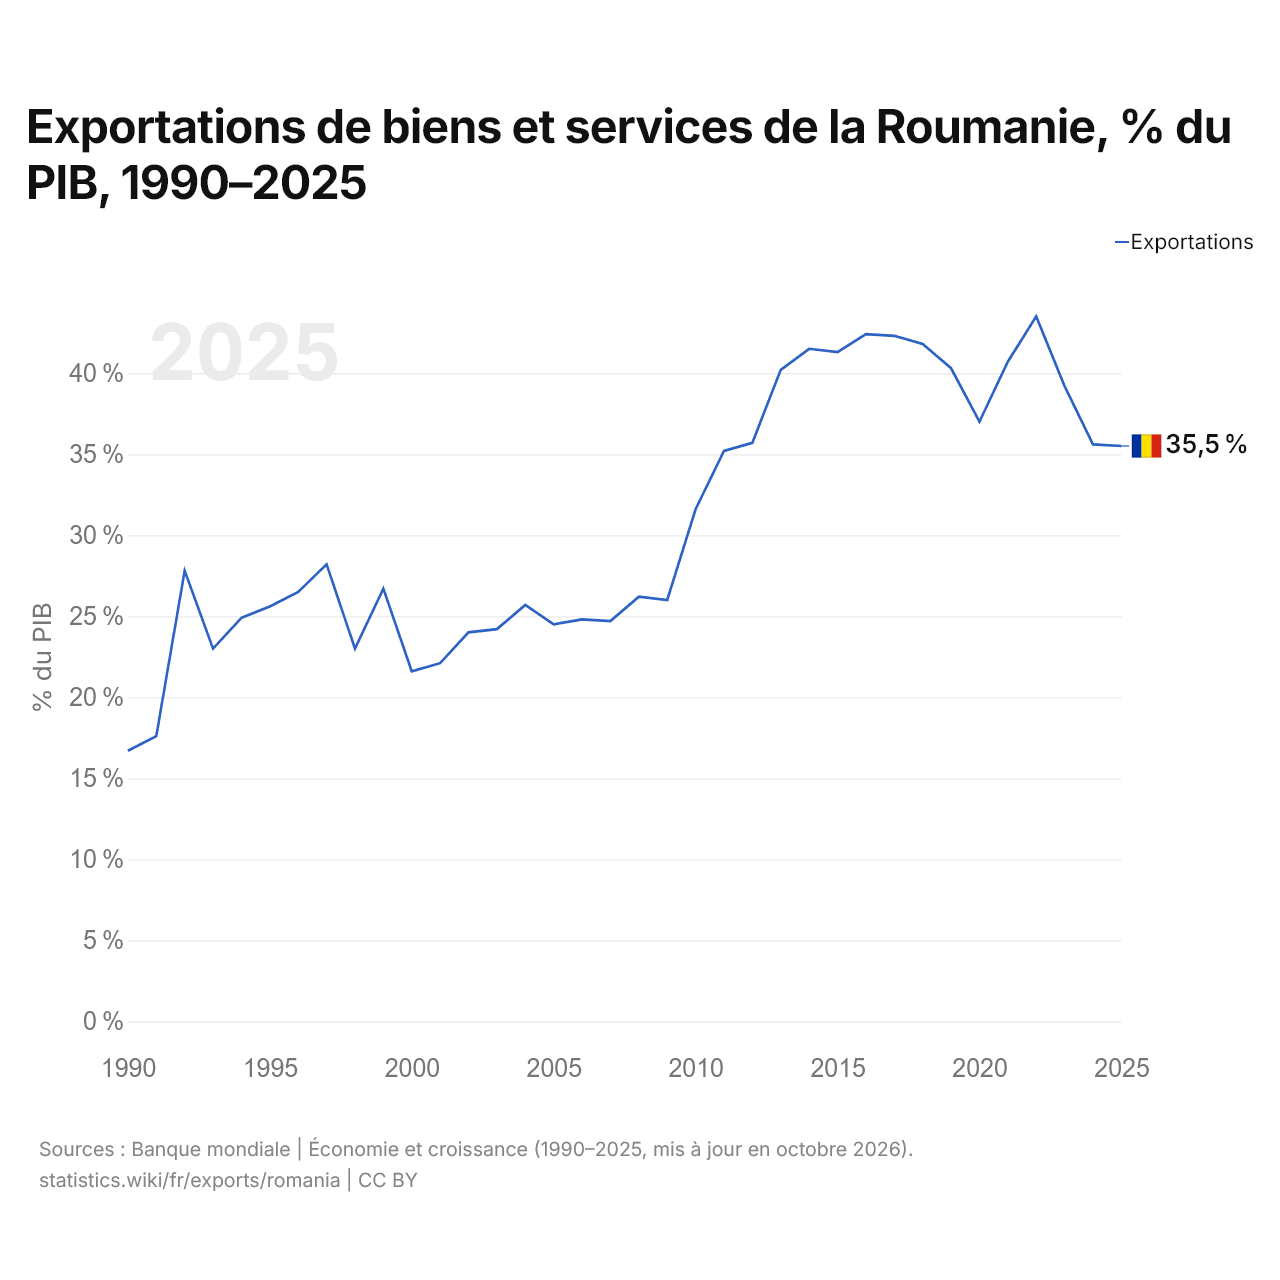
En 2025, les exportations de biens et services de la Roumanie équivalaient à 35,5 % de son PIB, contre 16,7 % en 1990. La part la plus élevée a été de 43,5 %, en 2022.
Comparer les exportations de la Roumanie avec celles d'autres pays
Sources :
- TradeMap (2001–2025, mis à jour en octobre 2026)
- Banque mondiale | Économie et croissance (1971–2025, mis à jour en octobre 2026)
Creative Commons Attribution (CC BY) : vous pouvez copier, partager, adapter et réutiliser ce contenu, y compris à des fins commerciales, à condition de citer statistics.wiki et d’indiquer les modifications apportées. Les sources citées ci-dessus peuvent avoir leurs propres conditions de licence.