
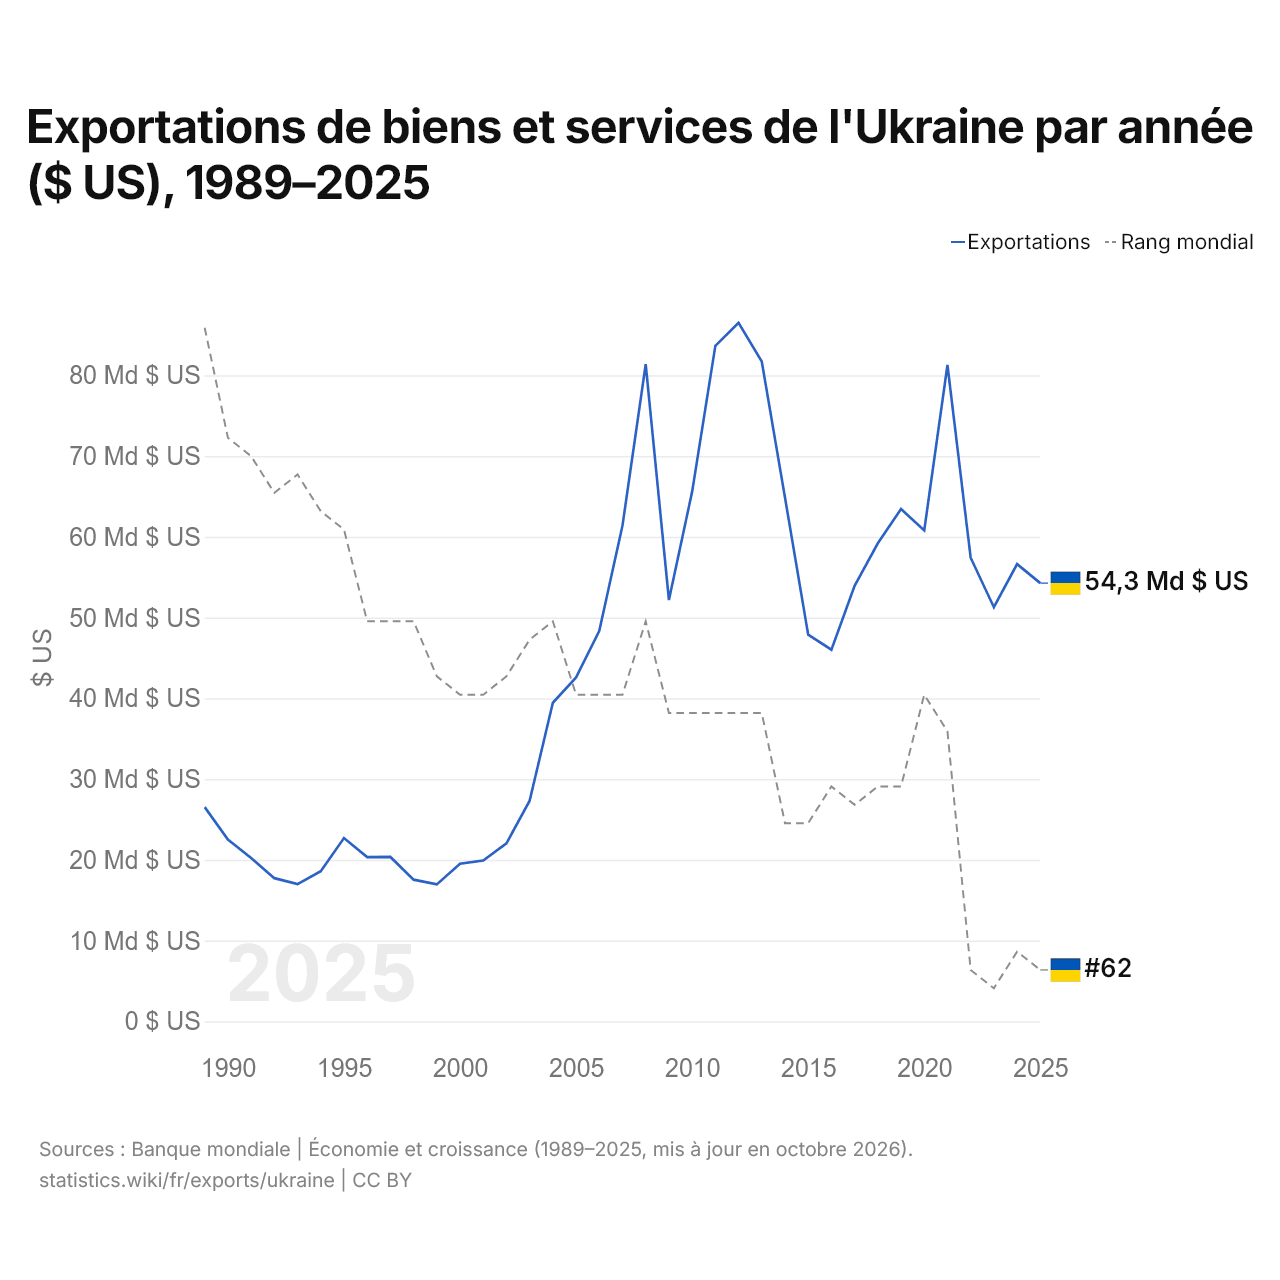
Exportations de biens et services de l'Ukraine par année ($ US), 1989–2025
| Année | $ US | Rang mondial |
|---|---|---|
| Exportations | Rang mondial | |
| 2025 | 54 272 867 488 $ US | #62 |
| 2024 | 56 624 210 505 $ US | #61 |
| 2023 | 51 286 538 170 $ US | #63 |
| 2022 | 57 417 372 455 $ US | #62 |
| 2021 | 81 281 413 099 $ US | #49 |
| 2020 | 60 801 578 068 $ US | #47 |
| 2019 | 63 448 583 044 $ US | #52 |
| 2018 | 59 208 892 251 $ US | #52 |
| 2017 | 53 943 461 809 $ US | #53 |
| 2016 | 46 023 154 799 $ US | #52 |
| 2015 | 47 880 176 691 $ US | #54 |
| 2014 | 64 873 485 476 $ US | #54 |
| 2013 | 81 719 004 129 $ US | #48 |
| 2012 | 86 517 143 161 $ US | #48 |
| 2011 | 83 661 340 362 $ US | #48 |
| 2010 | 65 600 892 379 $ US | #48 |
| 2009 | 52 180 910 869 $ US | #48 |
| 2008 | 81 376 308 304 $ US | #43 |
| 2007 | 61 412 079 208 $ US | #47 |
| 2006 | 48 355 049 505 $ US | #47 |
| 2005 | 42 593 471 772 $ US | #47 |
| 2004 | 39 456 100 771 $ US | #43 |
| 2003 | 27 327 869 172 $ US | #44 |
| 2002 | 22 030 272 452 $ US | #46 |
| 2001 | 19 909 904 879 $ US | #47 |
| 2000 | 19 521 222 712 $ US | #47 |
| 1999 | 16 960 000 576 $ US | #46 |
| 1998 | 17 543 687 391 $ US | #43 |
| 1997 | 20 357 121 609 $ US | #43 |
| 1996 | 20 341 967 259 $ US | #43 |
| 1995 | 22 695 828 945 $ US | #38 |
| 1994 | 18 596 691 884 $ US | #37 |
| 1993 | 16 988 495 839 $ US | #35 |
| 1992 | 17 732 031 955 $ US | #36 |
| 1991 | 20 230 191 965 $ US | #34 |
| 1990 | 22 517 259 875 $ US | #33 |
| 1989 | 26 529 048 348 $ US | #27 |
En 2025, les exportations de biens et services de l'Ukraine s'élevaient à 54,3 milliards de dollars, contre 26,5 milliards de dollars en 1989. Le maximum a été de 86,5 milliards de dollars, en 2012. Elles se classaient au 62e rang mondial, en baisse par rapport au 61e rang en 2024. Leur meilleur rang a été le 27e, occupé pour la dernière fois en 1989.
En 2025, les exportations de biens et services de l'Ukraine étaient les 27es plus élevées de 41 pays situés en Europe (à égalité avec la Serbie). Les importations de biens et services de l'Ukraine s'élevaient à 111 milliards de dollars en 2025, au 47e rang mondial. En 2025, les importations de l'Ukraine dépassaient ses exportations de 56,8 milliards de dollars, soit un déficit commercial.
Exportations de biens de l'Ukraine par catégorie
Exportations de biens, 2024: 40,4 Md $US
La première catégorie des exportations de biens de l'Ukraine est « cultures, plantes et fleurs (céréales, fruits, légumes, café, oléagineux) », avec 33,4 %, suivie de « aliments transformés, huiles, aliments pour animaux, boissons et tabac », avec 23,5 %.
Destinations des exportations de biens de l'Ukraine : les 10 premières
| Rang | Pays | Exportations de biens | Part | |
|---|---|---|---|---|
| 1 |
 Pologne |
4,40 Md $US | 10,9 % | vs Pologne |
| 2 |
 Espagne |
2,87 Md $US | 7,1 % | |
| 3 |
 Allemagne |
2,54 Md $US | 6,28 % | vs Allemagne |
| 4 |
 Chine |
2,40 Md $US | 5,93 % | |
| 5 |
 Turquie |
2,20 Md $US | 5,45 % | vs Turquie |
| 6 |
 Pays-Bas |
1,97 Md $US | 4,88 % | |
| 7 |
 Italie |
1,92 Md $US | 4,75 % | |
| 8 |
 Roumanie |
1,69 Md $US | 4,19 % | vs Roumanie |
| 9 |
 Égypte |
1,64 Md $US | 4,05 % | |
| 10 |
 Bulgarie |
1,13 Md $US | 2,8 % | |
| Autres partenaires et non précisés | 17,7 Md $US | 43,7 % |
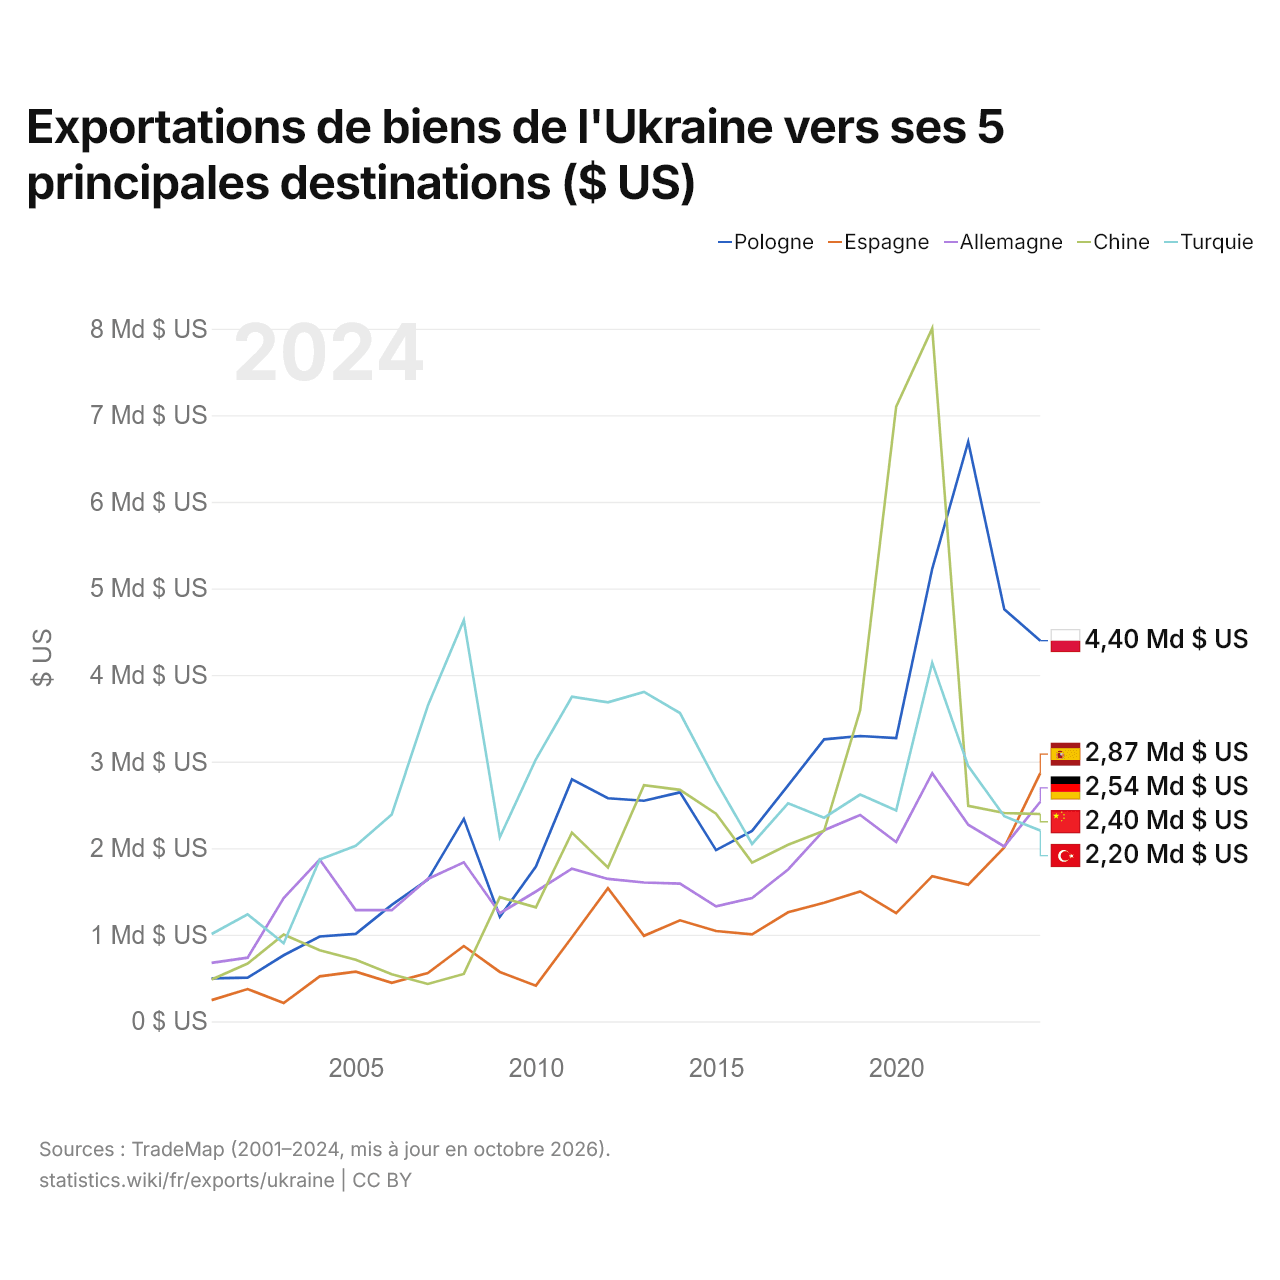
Exportations de biens de l'Ukraine vers ses 5 principales destinations ($ US)
| Année | $ US | ||||
|---|---|---|---|---|---|
| Pologne | Espagne | Allemagne | Chine | Turquie | |
| 2024 | 4 396 968 000 $ US | 2 867 258 000 $ US | 2 536 158 000 $ US | 2 395 040 000 $ US | 2 202 888 000 $ US |
| 2023 | 4 758 619 000 $ US | 2 008 232 000 $ US | 2 019 698 000 $ US | 2 406 413 000 $ US | 2 368 623 000 $ US |
| 2022 | 6 694 964 000 $ US | 1 577 491 000 $ US | 2 270 441 000 $ US | 2 489 547 000 $ US | 2 947 347 000 $ US |
| 2021 | 5 227 396 000 $ US | 1 677 242 000 $ US | 2 866 372 000 $ US | 8 003 558 000 $ US | 4 142 634 000 $ US |
| 2020 | 3 272 676 000 $ US | 1 250 214 000 $ US | 2 071 738 000 $ US | 7 099 948 000 $ US | 2 436 267 000 $ US |
| 2019 | 3 295 844 000 $ US | 1 500 801 000 $ US | 2 383 000 000 $ US | 3 593 093 000 $ US | 2 619 019 000 $ US |
| 2018 | 3 257 237 000 $ US | 1 369 890 000 $ US | 2 208 347 000 $ US | 2 200 142 000 $ US | 2 352 353 000 $ US |
| 2017 | 2 724 465 000 $ US | 1 260 055 000 $ US | 1 754 182 000 $ US | 2 039 315 000 $ US | 2 519 132 000 $ US |
| 2016 | 2 200 009 000 $ US | 1 004 547 000 $ US | 1 423 733 000 $ US | 1 832 519 000 $ US | 2 049 065 000 $ US |
| 2015 | 1 977 329 000 $ US | 1 043 601 000 $ US | 1 328 665 000 $ US | 2 399 079 000 $ US | 2 771 757 000 $ US |
| 2014 | 2 645 031 000 $ US | 1 166 565 000 $ US | 1 590 570 000 $ US | 2 674 118 000 $ US | 3 561 436 000 $ US |
| 2013 | 2 547 824 000 $ US | 987 678 000 $ US | 1 603 740 000 $ US | 2 726 653 000 $ US | 3 805 541 000 $ US |
| 2012 | 2 576 195 000 $ US | 1 539 019 000 $ US | 1 644 879 000 $ US | 1 777 169 000 $ US | 3 685 113 000 $ US |
| 2011 | 2 794 085 000 $ US | 970 612 000 $ US | 1 763 907 000 $ US | 2 180 034 000 $ US | 3 748 622 000 $ US |
| 2010 | 1 787 222 000 $ US | 411 728 000 $ US | 1 499 469 000 $ US | 1 316 550 000 $ US | 3 026 601 000 $ US |
| 2009 | 1 208 028 000 $ US | 570 433 000 $ US | 1 248 133 000 $ US | 1 434 405 000 $ US | 2 126 525 000 $ US |
| 2008 | 2 338 212 000 $ US | 869 999 000 $ US | 1 837 007 000 $ US | 547 520 000 $ US | 4 633 224 000 $ US |
| 2007 | 1 636 916 000 $ US | 557 401 000 $ US | 1 644 491 000 $ US | 431 655 000 $ US | 3 645 289 000 $ US |
| 2006 | 1 344 516 000 $ US | 445 136 000 $ US | 1 283 839 000 $ US | 544 664 000 $ US | 2 390 039 000 $ US |
| 2005 | 1 010 443 000 $ US | 573 538 000 $ US | 1 285 183 000 $ US | 711 088 000 $ US | 2 026 723 000 $ US |
| 2004 | 979 418 000 $ US | 520 052 000 $ US | 1 869 811 000 $ US | 821 150 000 $ US | 1 868 746 000 $ US |
| 2003 | 763 028 000 $ US | 211 484 000 $ US | 1 423 331 000 $ US | 1 002 677 000 $ US | 902 107 000 $ US |
| 2002 | 504 970 000 $ US | 373 019 000 $ US | 735 655 000 $ US | 667 080 000 $ US | 1 235 106 000 $ US |
| 2001 | 497 064 000 $ US | 245 055 000 $ US | 675 400 000 $ US | 484 361 000 $ US | 1 009 380 000 $ US |
Les exportations de biens s'élèvent à 4,4 milliards de dollars vers la Pologne (2024), 2,87 milliards de dollars vers l'Espagne (2024), 2,54 milliards de dollars vers l'Allemagne (2024), 2,4 milliards de dollars vers la Chine (2024) et 2,2 milliards de dollars vers la Turquie (2024). Le premier rang des cinq destinations de l'Ukraine est occupé par la Pologne depuis 2022. Le changement le plus récent dans leur ordre remonte à 2024, quand les exportations de l'Ukraine vers l'Espagne ont dépassé celles vers l'Allemagne.
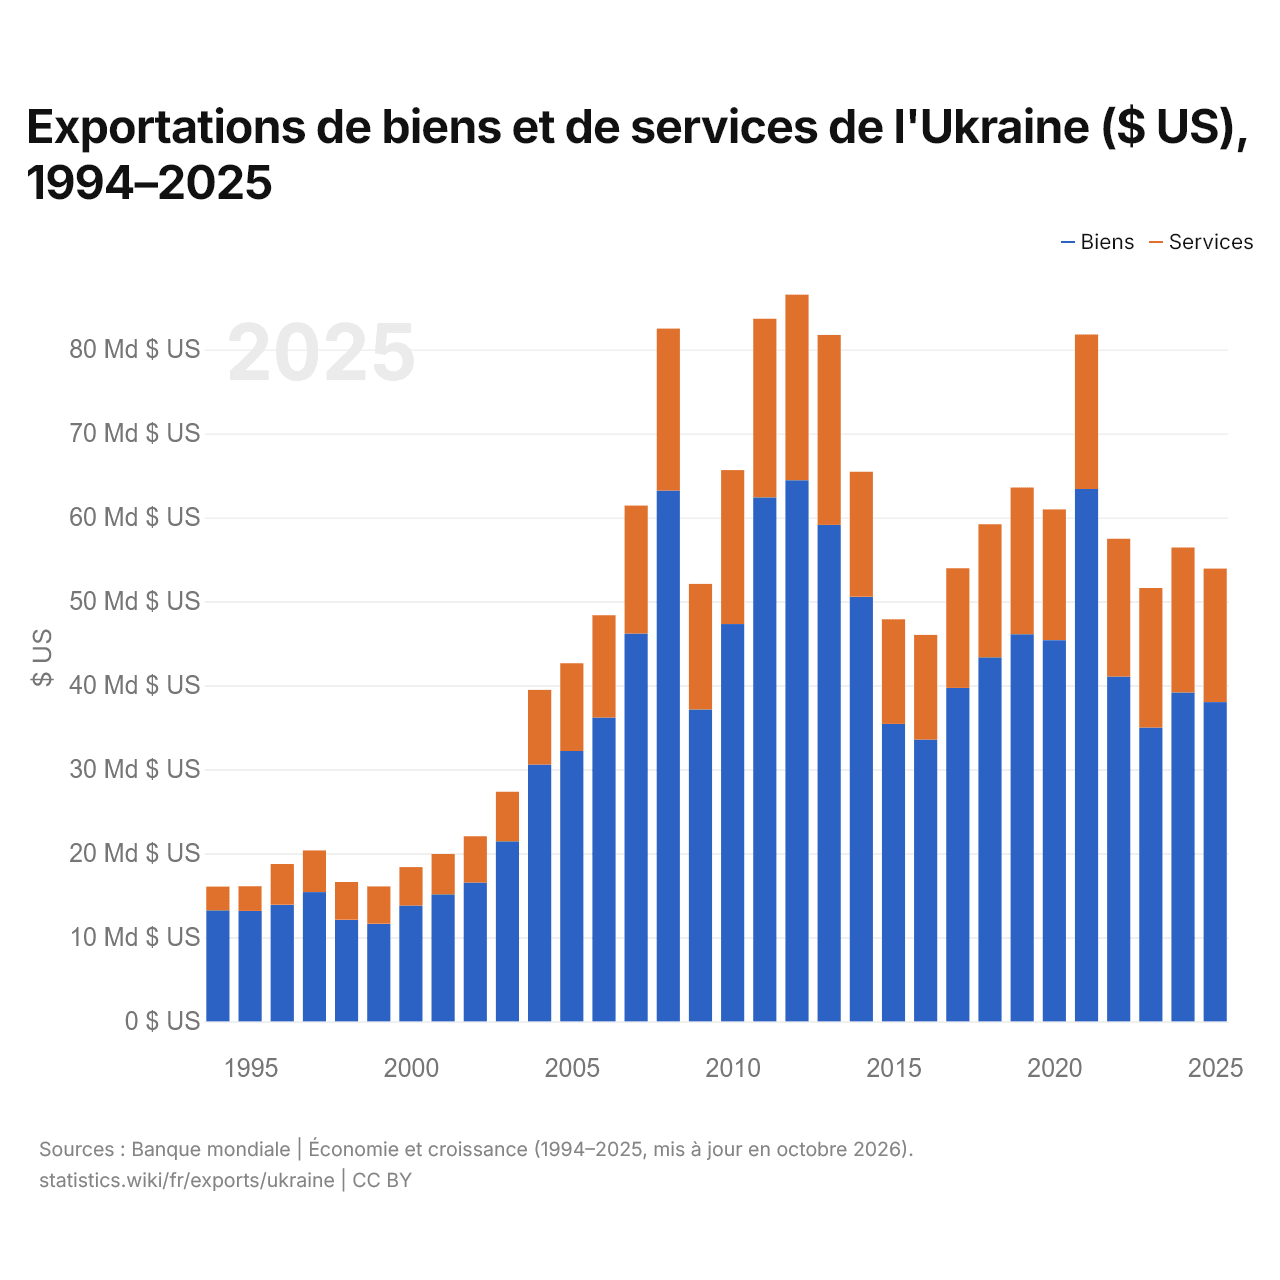
Exportations de biens et de services de l'Ukraine ($ US), 1994–2025
| Année | $ US | |
|---|---|---|
| Biens | Services | |
| 2025 | 38 007 000 000 $ US | 15 904 000 000 $ US |
| 2024 | 39 161 000 000 $ US | 17 252 000 000 $ US |
| 2023 | 34 970 000 000 $ US | 16 617 000 000 $ US |
| 2022 | 41 057 000 000 $ US | 16 401 000 000 $ US |
| 2021 | 63 382 000 000 $ US | 18 391 000 000 $ US |
| 2020 | 45 379 000 000 $ US | 15 564 000 000 $ US |
| 2019 | 46 091 000 000 $ US | 17 465 000 000 $ US |
| 2018 | 43 341 000 000 $ US | 15 836 000 000 $ US |
| 2017 | 39 701 000 000 $ US | 14 243 000 000 $ US |
| 2016 | 33 560 000 000 $ US | 12 448 000 000 $ US |
| 2015 | 35 420 000 000 $ US | 12 442 000 000 $ US |
| 2014 | 50 552 000 000 $ US | 14 884 000 000 $ US |
| 2013 | 59 106 000 000 $ US | 22 613 000 000 $ US |
| 2012 | 64 427 000 000 $ US | 22 089 000 000 $ US |
| 2011 | 62 383 000 000 $ US | 21 269 000 000 $ US |
| 2010 | 47 299 000 000 $ US | 18 327 000 000 $ US |
| 2009 | 37 134 000 000 $ US | 14 946 000 000 $ US |
| 2008 | 63 188 000 000 $ US | 19 292 000 000 $ US |
| 2007 | 46 168 000 000 $ US | 15 244 000 000 $ US |
| 2006 | 36 174 000 000 $ US | 12 181 000 000 $ US |
| 2005 | 32 184 000 000 $ US | 10 442 000 000 $ US |
| 2004 | 30 581 000 000 $ US | 8 880 000 000 $ US |
| 2003 | 21 437 000 000 $ US | 5 891 000 000 $ US |
| 2002 | 16 514 000 000 $ US | 5 513 000 000 $ US |
| 2001 | 15 122 000 000 $ US | 4 795 000 000 $ US |
| 2000 | 13 781 000 000 $ US | 4 577 000 000 $ US |
| 1999 | 11 624 000 000 $ US | 4 444 000 000 $ US |
| 1998 | 12 100 000 000 $ US | 4 491 000 000 $ US |
| 1997 | 15 386 000 000 $ US | 4 969 000 000 $ US |
| 1996 | 13 882 000 000 $ US | 4 846 000 000 $ US |
| 1995 | 13 149 000 000 $ US | 2 939 000 000 $ US |
| 1994 | 13 221 000 000 $ US | 2 822 000 000 $ US |
En 2025, les exportations de biens de l'Ukraine s'élevaient à 38 milliards de dollars et celles de services à 15,9 milliards de dollars ; les services représentaient 29,5 % du total, contre 17,6 % en 1994.
L'Ukraine dans le classement mondial des exportations, 2025
| Rang | Pays | Exportations | Part mondiale | |
|---|---|---|---|---|
| 59 |
 Nouvelle-Zélande |
64,6 Md $US (2024) | 0,2 % | |
| 60 |
 Slovénie |
62,6 Md $US | 0,18 % | |
| 61 |
 Serbie |
54,3 Md $US | 0,16 % | |
| 62 |
 Ukraine |
54,3 Md $US | 0,16 % | |
| 63 |
 Biélorussie |
51,4 Md $US | 0,15 % | vs Biélorussie |
| 64 |
 Bangladesh |
50,7 Md $US | 0,15 % | |
| 65 |
 Croatie |
50,4 Md $US | 0,14 % |
Exportations de biens et services de l'Ukraine, % du PIB, 1989–2025
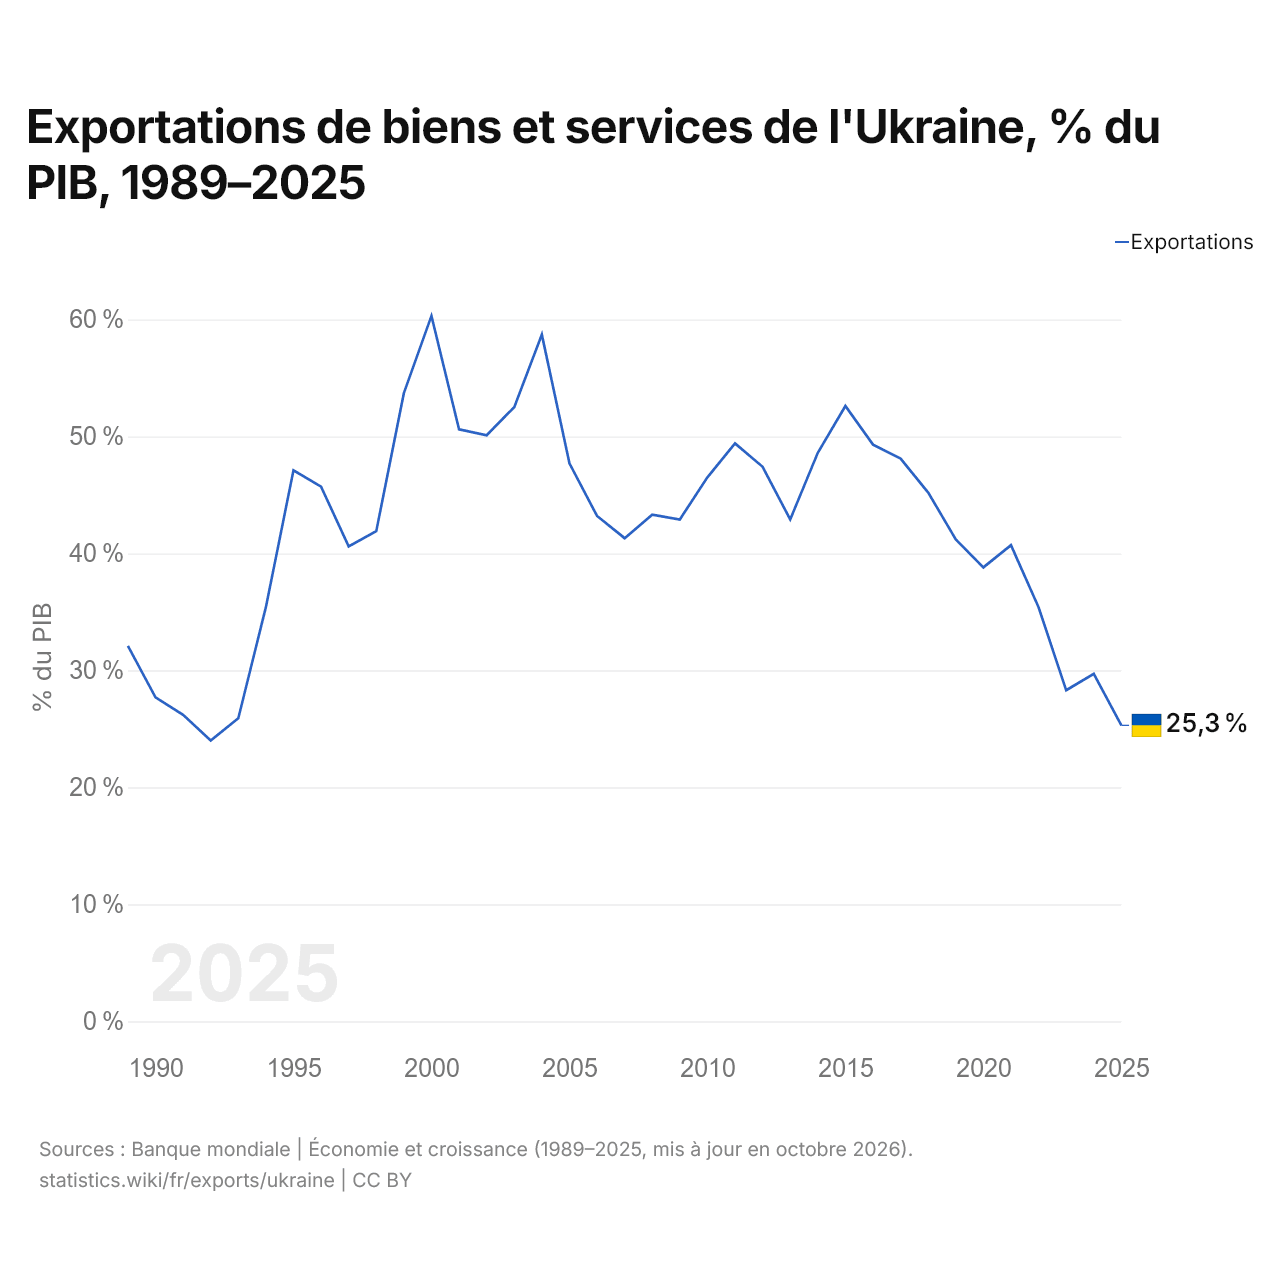
En 2025, les exportations de biens et services de l'Ukraine équivalaient à 25,3 % de son PIB, contre 32,1 % en 1989. La part la plus élevée a été de 60,3 %, en 2000.
Comparer les exportations de l'Ukraine avec celles d'autres pays
Sources :
- TradeMap (2001–2024, mis à jour en octobre 2026)
- Banque mondiale | Économie et croissance (1989–2025, mis à jour en octobre 2026)
Creative Commons Attribution (CC BY) : vous pouvez copier, partager, adapter et réutiliser ce contenu, y compris à des fins commerciales, à condition de citer statistics.wiki et d’indiquer les modifications apportées. Les sources citées ci-dessus peuvent avoir leurs propres conditions de licence.