
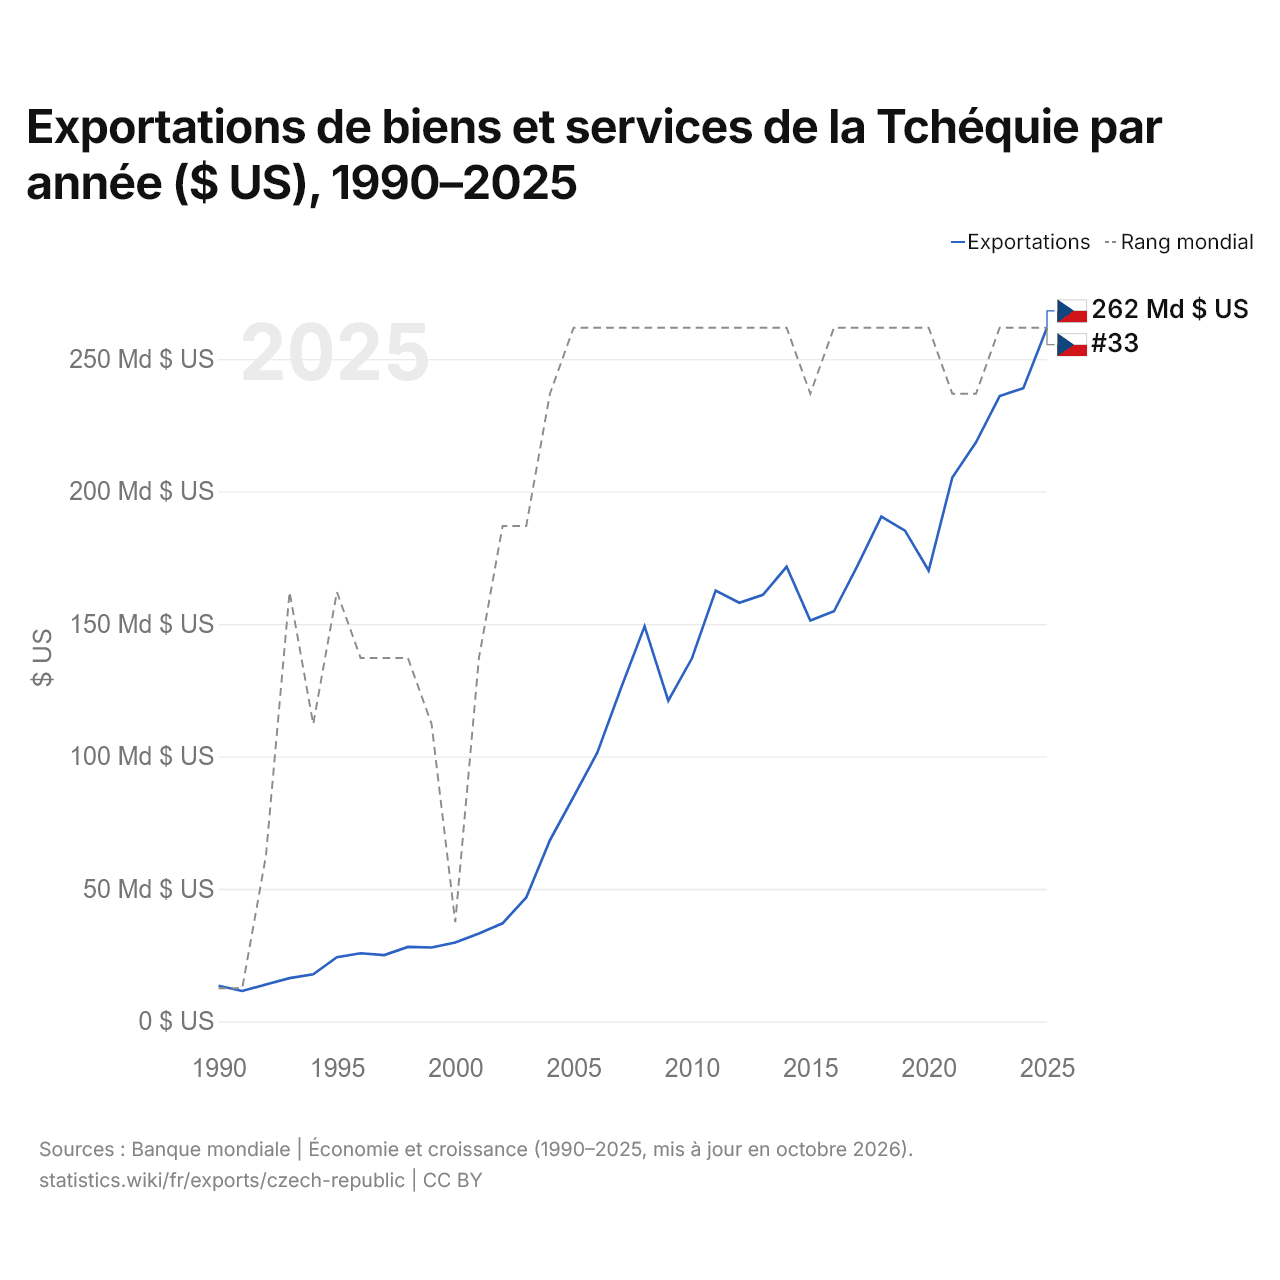
Exportations de biens et services de la Tchéquie par année ($ US), 1990–2025
| Année | $ US | Rang mondial |
|---|---|---|
| Exportations | Rang mondial | |
| 2025 | 261 773 375 377 $ US | #33 |
| 2024 | 238 995 944 035 $ US | #33 |
| 2023 | 236 031 278 977 $ US | #33 |
| 2022 | 218 554 266 387 $ US | #34 |
| 2021 | 205 281 381 421 $ US | #34 |
| 2020 | 170 154 349 910 $ US | #33 |
| 2019 | 185 212 440 995 $ US | #33 |
| 2018 | 190 530 873 335 $ US | #33 |
| 2017 | 172 120 406 679 $ US | #33 |
| 2016 | 154 779 987 657 $ US | #33 |
| 2015 | 151 309 924 285 $ US | #34 |
| 2014 | 171 578 513 790 $ US | #33 |
| 2013 | 161 004 654 094 $ US | #33 |
| 2012 | 157 992 900 013 $ US | #33 |
| 2011 | 162 580 614 172 $ US | #33 |
| 2010 | 137 030 722 710 $ US | #33 |
| 2009 | 121 028 432 041 $ US | #33 |
| 2008 | 149 079 880 738 $ US | #33 |
| 2007 | 125 712 955 252 $ US | #33 |
| 2006 | 101 376 993 751 $ US | #33 |
| 2005 | 84 772 805 062 $ US | #33 |
| 2004 | 68 363 528 121 $ US | #34 |
| 2003 | 46 770 321 529 $ US | #36 |
| 2002 | 36 991 594 021 $ US | #36 |
| 2001 | 33 128 639 673 $ US | #38 |
| 2000 | 29 733 777 254 $ US | #42 |
| 1999 | 27 868 246 879 $ US | #39 |
| 1998 | 28 093 534 317 $ US | #38 |
| 1997 | 25 027 225 177 $ US | #38 |
| 1996 | 25 697 102 987 $ US | #38 |
| 1995 | 24 185 606 631 $ US | #37 |
| 1994 | 17 751 255 168 $ US | #39 |
| 1993 | 16 321 369 053 $ US | #37 |
| 1992 | 13 872 829 183 $ US | #41 |
| 1991 | 11 474 470 977 $ US | #43 |
| 1990 | 13 409 039 102 $ US | #43 |
En 2025, les exportations de biens et services de la Tchéquie s'élevaient à 262 milliards de dollars, contre 13,4 milliards de dollars en 1990. Le minimum a été de 11,5 milliards de dollars, en 1991. Elles se classaient au 33e rang mondial, un rang qu'elles occupent depuis 2023.
En 2025, les exportations de biens et services de la Tchéquie étaient les 15es plus élevées de 41 pays situés en Europe. Les importations de biens et services de la Tchéquie s'élevaient à 239 milliards de dollars en 2025, au 33e rang mondial. En 2025, les exportations de la Tchéquie dépassaient ses importations de 22,9 milliards de dollars, soit un excédent commercial.
Exportations de biens de la Tchéquie par catégorie, 2025
Exportations de biens, 2025: 282 Md $US
En 2025, la première catégorie des exportations de biens de la Tchéquie était « machines, électronique et véhicules », avec 62,2 %, suivie de « textiles, vêtements, chaussures, meubles et jouets », avec 8,8 %.
Destinations des exportations de biens de la Tchéquie : les 10 premières, 2025
| Rang | Pays | Exportations de biens | Part | |
|---|---|---|---|---|
| 1 |
 Allemagne |
88,9 Md $US | 31,5 % | vs Allemagne |
| 2 |
 Slovaquie |
21,1 Md $US | 7,48 % | vs Slovaquie |
| 3 |
 Pologne |
20,7 Md $US | 7,35 % | vs Pologne |
| 4 |
 France |
13,7 Md $US | 4,87 % | vs France |
| 5 |
 Royaume-Uni |
12,0 Md $US | 4,24 % | |
| 6 |
 Autriche |
11,4 Md $US | 4,02 % | vs Autriche |
| 7 |
 Italie |
10,8 Md $US | 3,82 % | vs Italie |
| 8 |
 Pays-Bas |
8,84 Md $US | 3,13 % | |
| 9 |
 Hongrie |
8,79 Md $US | 3,12 % | vs Hongrie |
| 10 |
 États-Unis |
7,64 Md $US | 2,71 % | |
| Autres partenaires et non précisés | 78,2 Md $US | 27,7 % |
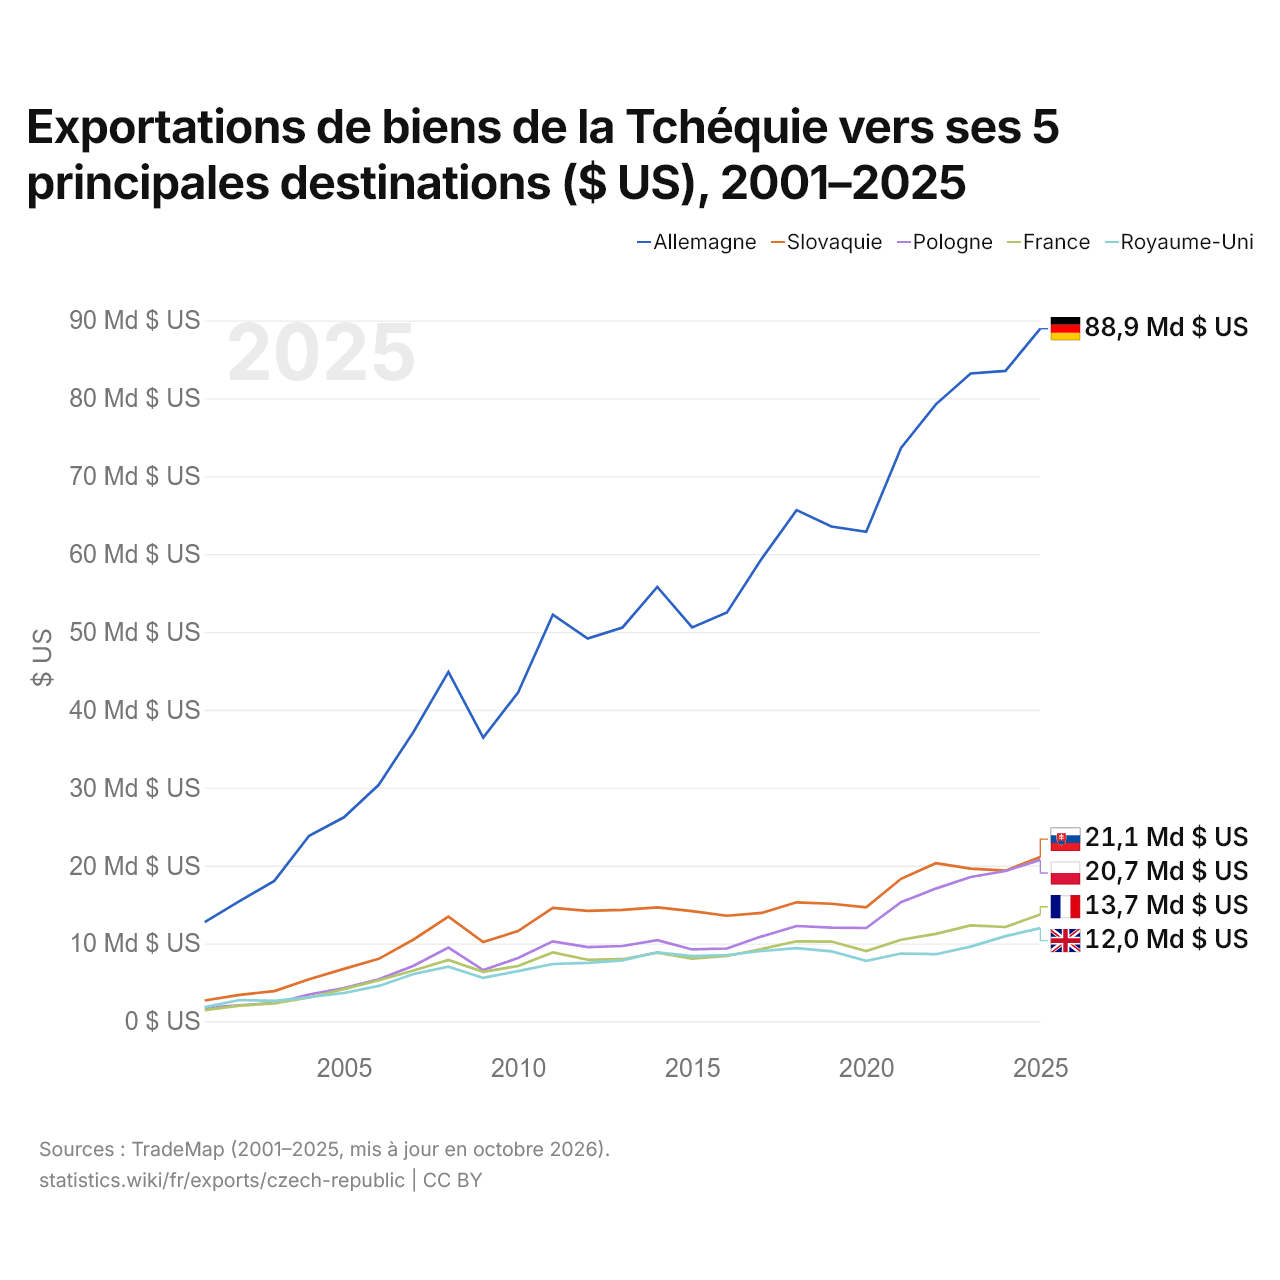
Exportations de biens de la Tchéquie vers ses 5 principales destinations ($ US), 2001–2025
| Année | $ US | ||||
|---|---|---|---|---|---|
| Allemagne | Slovaquie | Pologne | France | Royaume-Uni | |
| 2025 | 88 928 287 000 $ US | 21 097 062 000 $ US | 20 729 737 000 $ US | 13 721 760 000 $ US | 11 962 070 000 $ US |
| 2024 | 83 519 431 000 $ US | 19 347 595 000 $ US | 19 308 154 000 $ US | 12 113 964 000 $ US | 10 937 475 000 $ US |
| 2023 | 83 188 060 000 $ US | 19 610 030 000 $ US | 18 526 540 000 $ US | 12 313 965 000 $ US | 9 594 023 000 $ US |
| 2022 | 79 220 953 000 $ US | 20 298 524 000 $ US | 17 039 837 000 $ US | 11 232 564 000 $ US | 8 621 292 000 $ US |
| 2021 | 73 620 759 000 $ US | 18 298 004 000 $ US | 15 288 845 000 $ US | 10 469 127 000 $ US | 8 713 227 000 $ US |
| 2020 | 62 861 382 000 $ US | 14 639 239 000 $ US | 11 988 404 000 $ US | 9 024 393 000 $ US | 7 776 496 000 $ US |
| 2019 | 63 526 531 000 $ US | 15 099 748 000 $ US | 12 027 950 000 $ US | 10 243 179 000 $ US | 8 990 745 000 $ US |
| 2018 | 65 641 693 000 $ US | 15 284 559 000 $ US | 12 235 365 000 $ US | 10 274 895 000 $ US | 9 398 883 000 $ US |
| 2017 | 59 413 682 000 $ US | 13 920 841 000 $ US | 10 912 335 000 $ US | 9 284 502 000 $ US | 9 026 391 000 $ US |
| 2016 | 52 492 419 000 $ US | 13 554 032 000 $ US | 9 349 784 000 $ US | 8 393 055 000 $ US | 8 519 963 000 $ US |
| 2015 | 50 567 277 000 $ US | 14 145 819 000 $ US | 9 228 941 000 $ US | 8 044 975 000 $ US | 8 371 820 000 $ US |
| 2014 | 55 775 424 000 $ US | 14 640 789 000 $ US | 10 415 027 000 $ US | 8 829 540 000 $ US | 8 871 428 000 $ US |
| 2013 | 50 566 481 000 $ US | 14 304 064 000 $ US | 9 667 846 000 $ US | 7 978 846 000 $ US | 7 834 644 000 $ US |
| 2012 | 49 142 434 000 $ US | 14 177 411 000 $ US | 9 520 874 000 $ US | 7 911 709 000 $ US | 7 503 843 000 $ US |
| 2011 | 52 221 249 000 $ US | 14 565 373 000 $ US | 10 267 814 000 $ US | 8 845 137 000 $ US | 7 357 286 000 $ US |
| 2010 | 42 212 766 000 $ US | 11 595 996 000 $ US | 8 129 414 000 $ US | 7 100 947 000 $ US | 6 443 275 000 $ US |
| 2009 | 36 438 817 000 $ US | 10 185 712 000 $ US | 6 577 658 000 $ US | 6 351 707 000 $ US | 5 574 189 000 $ US |
| 2008 | 44 867 595 000 $ US | 13 437 522 000 $ US | 9 468 073 000 $ US | 7 887 134 000 $ US | 7 020 774 000 $ US |
| 2007 | 37 191 790 000 $ US | 10 508 420 000 $ US | 7 146 769 000 $ US | 6 515 460 000 $ US | 6 081 748 000 $ US |
| 2006 | 30 366 436 000 $ US | 8 023 954 000 $ US | 5 390 575 000 $ US | 5 268 095 000 $ US | 4 548 918 000 $ US |
| 2005 | 26 200 643 000 $ US | 6 733 382 000 $ US | 4 266 184 000 $ US | 4 139 348 000 $ US | 3 633 631 000 $ US |
| 2004 | 23 835 740 000 $ US | 5 407 616 000 $ US | 3 443 822 000 $ US | 3 068 659 000 $ US | 3 097 419 000 $ US |
| 2003 | 18 025 635 000 $ US | 3 884 015 000 $ US | 2 336 383 000 $ US | 2 303 960 000 $ US | 2 621 506 000 $ US |
| 2002 | 15 442 116 000 $ US | 3 404 070 000 $ US | 2 053 246 000 $ US | 2 015 193 000 $ US | 2 741 042 000 $ US |
| 2001 | 12 736 693 000 $ US | 2 681 288 000 $ US | 1 729 870 000 $ US | 1 430 237 000 $ US | 1 823 589 000 $ US |
En 2025, les exportations de biens s'élevaient à 88,9 milliards de dollars vers l'Allemagne, 21,1 milliards de dollars vers la Slovaquie, 20,7 milliards de dollars vers la Pologne, 13,7 milliards de dollars vers la France et 12 milliards de dollars vers le Royaume-Uni. Le premier rang des cinq destinations de la Tchéquie est occupé par l'Allemagne chaque année depuis 2001. Le changement le plus récent dans leur ordre remonte à 2017, quand les exportations de la Tchéquie vers la France ont dépassé celles vers le Royaume-Uni.
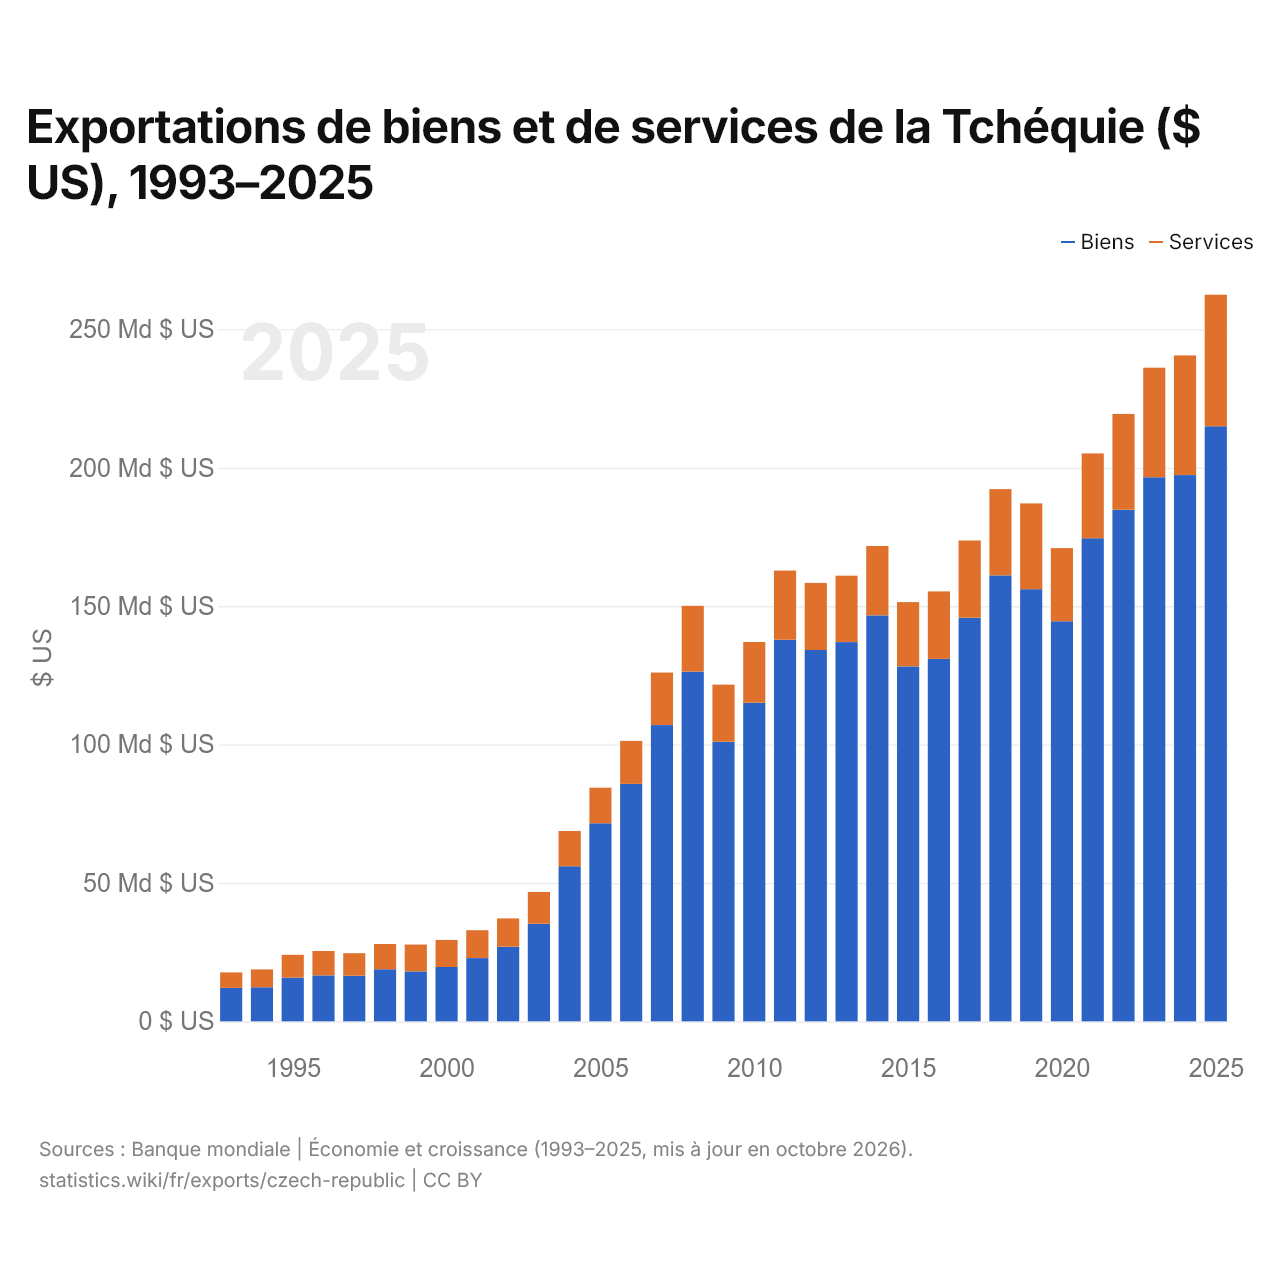
Exportations de biens et de services de la Tchéquie ($ US), 1993–2025
| Année | $ US | |
|---|---|---|
| Biens | Services | |
| 2025 | 214 954 725 294 $ US | 47 538 348 447 $ US |
| 2024 | 197 317 635 982 $ US | 43 229 958 546 $ US |
| 2023 | 196 542 393 365 $ US | 39 560 301 623 $ US |
| 2022 | 184 796 647 571 $ US | 34 621 956 742 $ US |
| 2021 | 174 506 688 258 $ US | 30 655 903 192 $ US |
| 2020 | 144 500 533 136 $ US | 26 437 218 038 $ US |
| 2019 | 156 104 420 901 $ US | 30 983 132 604 $ US |
| 2018 | 161 089 096 032 $ US | 31 151 426 157 $ US |
| 2017 | 145 845 995 179 $ US | 27 855 591 724 $ US |
| 2016 | 130 930 641 059 $ US | 24 359 437 709 $ US |
| 2015 | 128 168 650 728 $ US | 23 277 379 645 $ US |
| 2014 | 146 628 931 541 $ US | 25 071 891 761 $ US |
| 2013 | 136 995 387 018 $ US | 23 982 989 400 $ US |
| 2012 | 134 125 048 606 $ US | 24 235 793 375 $ US |
| 2011 | 137 892 683 126 $ US | 24 928 711 133 $ US |
| 2010 | 115 073 264 309 $ US | 21 956 477 923 $ US |
| 2009 | 101 025 895 121 $ US | 20 607 052 386 $ US |
| 2008 | 126 345 445 810 $ US | 23 745 968 519 $ US |
| 2007 | 107 016 716 975 $ US | 18 953 945 847 $ US |
| 2006 | 85 771 675 081 $ US | 15 527 769 014 $ US |
| 2005 | 71 554 951 811 $ US | 12 847 146 804 $ US |
| 2004 | 56 003 940 481 $ US | 12 753 210 736 $ US |
| 2003 | 35 275 253 693 $ US | 11 472 808 798 $ US |
| 2002 | 26 954 555 173 $ US | 10 228 868 846 $ US |
| 2001 | 22 846 619 264 $ US | 10 044 123 651 $ US |
| 2000 | 19 644 621 430 $ US | 9 767 261 923 $ US |
| 1999 | 18 036 216 541 $ US | 9 701 999 841 $ US |
| 1998 | 18 811 902 360 $ US | 9 111 193 425 $ US |
| 1997 | 16 479 009 082 $ US | 8 132 533 654 $ US |
| 1996 | 16 557 225 814 $ US | 8 848 114 101 $ US |
| 1995 | 15 816 447 990 $ US | 8 222 863 357 $ US |
| 1994 | 12 297 435 857 $ US | 6 461 409 238 $ US |
| 1993 | 12 099 472 139 $ US | 5 558 928 243 $ US |
En 2025, les exportations de biens de la Tchéquie s'élevaient à 215 milliards de dollars et celles de services à 47,5 milliards de dollars ; les services représentaient 18,1 % du total, contre 31,5 % en 1993.
La Tchéquie dans le classement mondial des exportations, 2025
| Rang | Pays | Exportations | Part mondiale | |
|---|---|---|---|---|
| 30 |
 Indonésie |
330 Md $US | 0,95 % | |
| 31 |
 Danemark |
324 Md $US | 0,93 % | |
| 32 |
Autriche
|
317 Md $US | 0,91 % | vs Autriche |
| 33 |
 Tchéquie |
262 Md $US | 0,75 % | |
| 34 |
 Norvège |
241 Md $US | 0,69 % | |
| 35 |
 Luxembourg |
193 Md $US | 0,55 % | |
| 36 |
Hongrie
|
179 Md $US | 0,51 % | vs Hongrie |
Exportations de biens et services de la Tchéquie, % du PIB, 1990–2025
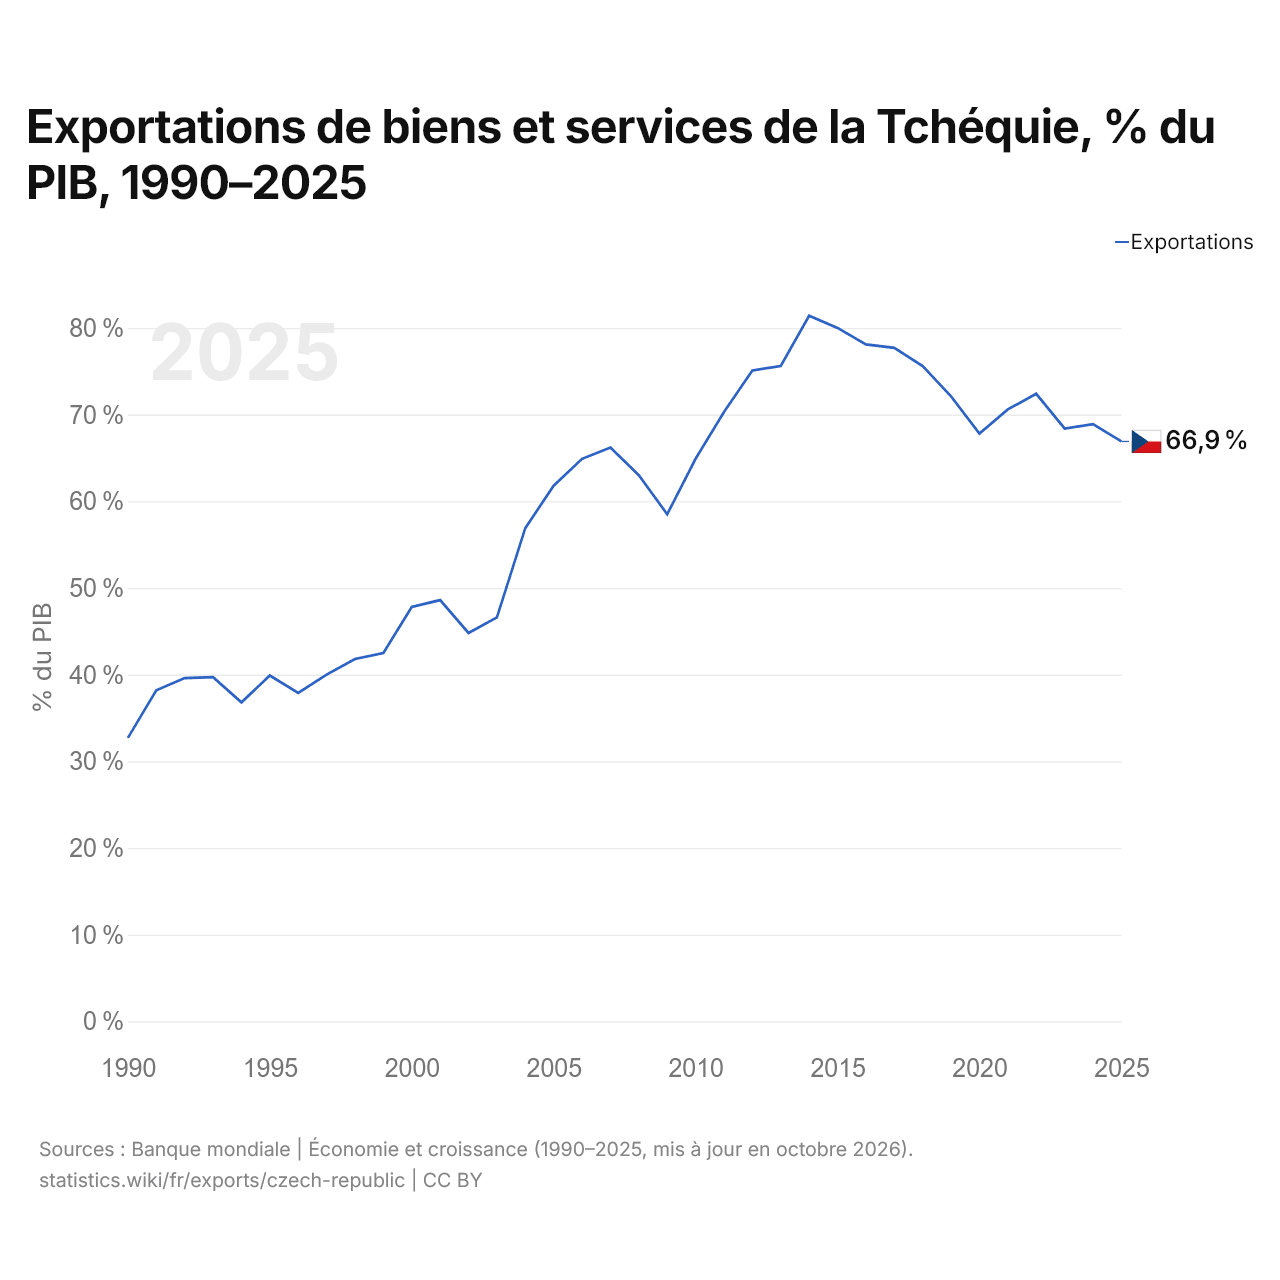
En 2025, les exportations de biens et services de la Tchéquie équivalaient à 66,9 % de son PIB, contre 32,7 % en 1990. La part la plus élevée a été de 81,4 %, en 2014.
Comparer les exportations de la Tchéquie avec celles d'autres pays
Sources :
- TradeMap (2001–2025, mis à jour en octobre 2026)
- Banque mondiale | Économie et croissance (1990–2025, mis à jour en octobre 2026)
Creative Commons Attribution (CC BY) : vous pouvez copier, partager, adapter et réutiliser ce contenu, y compris à des fins commerciales, à condition de citer statistics.wiki et d’indiquer les modifications apportées. Les sources citées ci-dessus peuvent avoir leurs propres conditions de licence.