
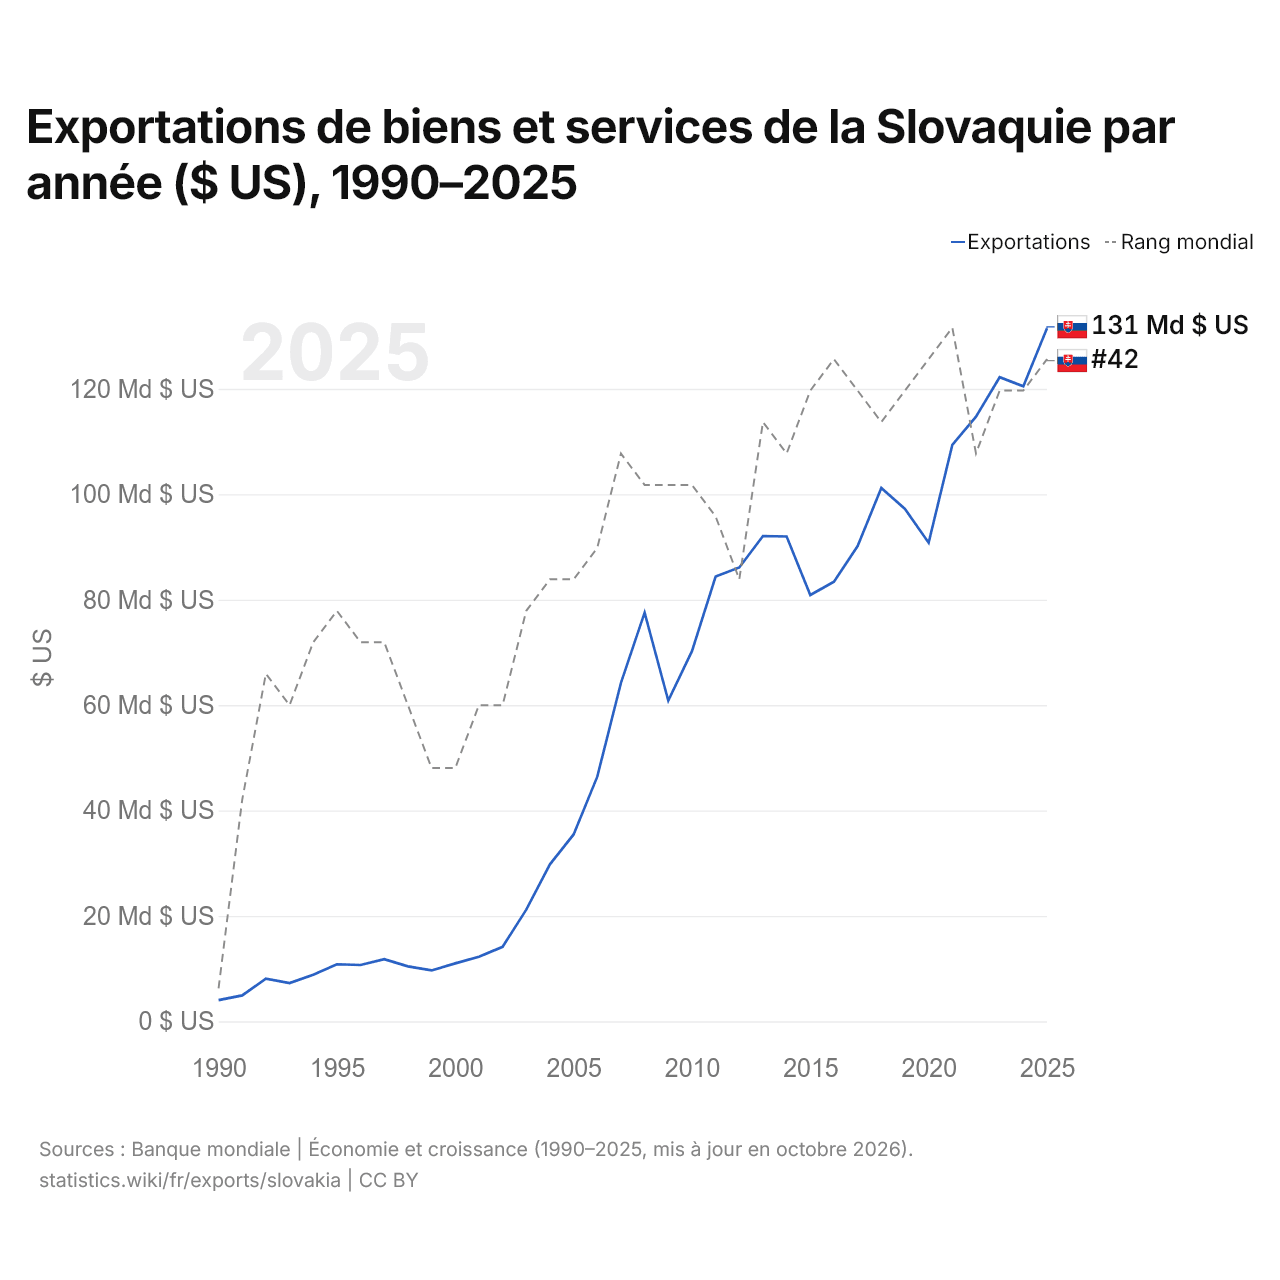
Exportations de biens et services de la Slovaquie par année ($ US), 1990–2025
| Année | $ US | Rang mondial |
|---|---|---|
| Exportations | Rang mondial | |
| 2025 | 131 496 787 423 $ US | #42 |
| 2024 | 120 475 379 841 $ US | #43 |
| 2023 | 122 215 736 735 $ US | #43 |
| 2022 | 114 713 195 240 $ US | #45 |
| 2021 | 109 378 268 572 $ US | #41 |
| 2020 | 90 816 799 596 $ US | #42 |
| 2019 | 97 210 994 150 $ US | #43 |
| 2018 | 101 203 084 758 $ US | #44 |
| 2017 | 90 173 773 496 $ US | #43 |
| 2016 | 83 400 999 773 $ US | #42 |
| 2015 | 80 879 458 866 $ US | #43 |
| 2014 | 91 989 314 712 $ US | #45 |
| 2013 | 92 074 947 974 $ US | #44 |
| 2012 | 86 112 869 512 $ US | #49 |
| 2011 | 84 383 473 251 $ US | #47 |
| 2010 | 70 230 239 457 $ US | #46 |
| 2009 | 60 839 049 329 $ US | #46 |
| 2008 | 77 546 084 620 $ US | #46 |
| 2007 | 64 216 687 900 $ US | #45 |
| 2006 | 46 420 141 295 $ US | #48 |
| 2005 | 35 460 788 060 $ US | #49 |
| 2004 | 29 790 902 305 $ US | #49 |
| 2003 | 21 194 191 121 $ US | #50 |
| 2002 | 14 142 209 625 $ US | #53 |
| 2001 | 12 240 920 919 $ US | #53 |
| 2000 | 10 995 031 445 $ US | #55 |
| 1999 | 9 657 947 387 $ US | #55 |
| 1998 | 10 422 314 279 $ US | #53 |
| 1997 | 11 788 853 338 $ US | #51 |
| 1996 | 10 691 304 045 $ US | #51 |
| 1995 | 10 826 972 930 $ US | #50 |
| 1994 | 8 854 869 079 $ US | #51 |
| 1993 | 7 256 680 163 $ US | #53 |
| 1992 | 8 086 578 118 $ US | #52 |
| 1991 | 4 914 132 327 $ US | #56 |
| 1990 | 4 018 917 336 $ US | #62 |
En 2025, les exportations de biens et services de la Slovaquie s'élevaient à 131 milliards de dollars, contre 4,02 milliards de dollars en 1990. Elles se classaient au 42e rang mondial, en hausse par rapport au 43e rang en 2024. Leur meilleur rang a été le 41e, occupé pour la dernière fois en 2021.
En 2025, les exportations de biens et services de la Slovaquie étaient les 22es plus élevées de 41 pays situés en Europe. Les importations de biens et services de la Slovaquie s'élevaient à 132 milliards de dollars en 2025, au 41e rang mondial. En 2025, les importations de la Slovaquie dépassaient ses exportations de 237 millions de dollars, soit un déficit commercial.
Exportations de biens de la Slovaquie par catégorie, 2025
Exportations de biens, 2025: 125 Md $US
En 2025, la première catégorie des exportations de biens de la Slovaquie était « machines, électronique et véhicules », avec 63,4 %, suivie de « métaux communs (fer, acier, cuivre, aluminium) », avec 7,9 %.
Destinations des exportations de biens de la Slovaquie : les 10 premières, 2025
| Rang | Pays | Exportations de biens | Part | |
|---|---|---|---|---|
| 1 |
 Allemagne |
26,7 Md $US | 21,3 % | |
| 2 |
 Tchéquie |
15,7 Md $US | 12,5 % | vs Tchéquie |
| 3 |
 Hongrie |
9,71 Md $US | 7,75 % | vs Hongrie |
| 4 |
 Pologne |
9,53 Md $US | 7,61 % | vs Pologne |
| 5 |
 Autriche |
6,77 Md $US | 5,41 % | vs Autriche |
| 6 |
 France |
5,92 Md $US | 4,72 % | vs France |
| 7 |
 Royaume-Uni |
5,88 Md $US | 4,69 % | |
| 8 |
 Italie |
5,46 Md $US | 4,36 % | |
| 9 |
 États-Unis |
4,12 Md $US | 3,29 % | |
| 10 |
 Roumanie |
3,16 Md $US | 2,53 % | |
| Autres partenaires et non précisés | 32,3 Md $US | 25,8 % |
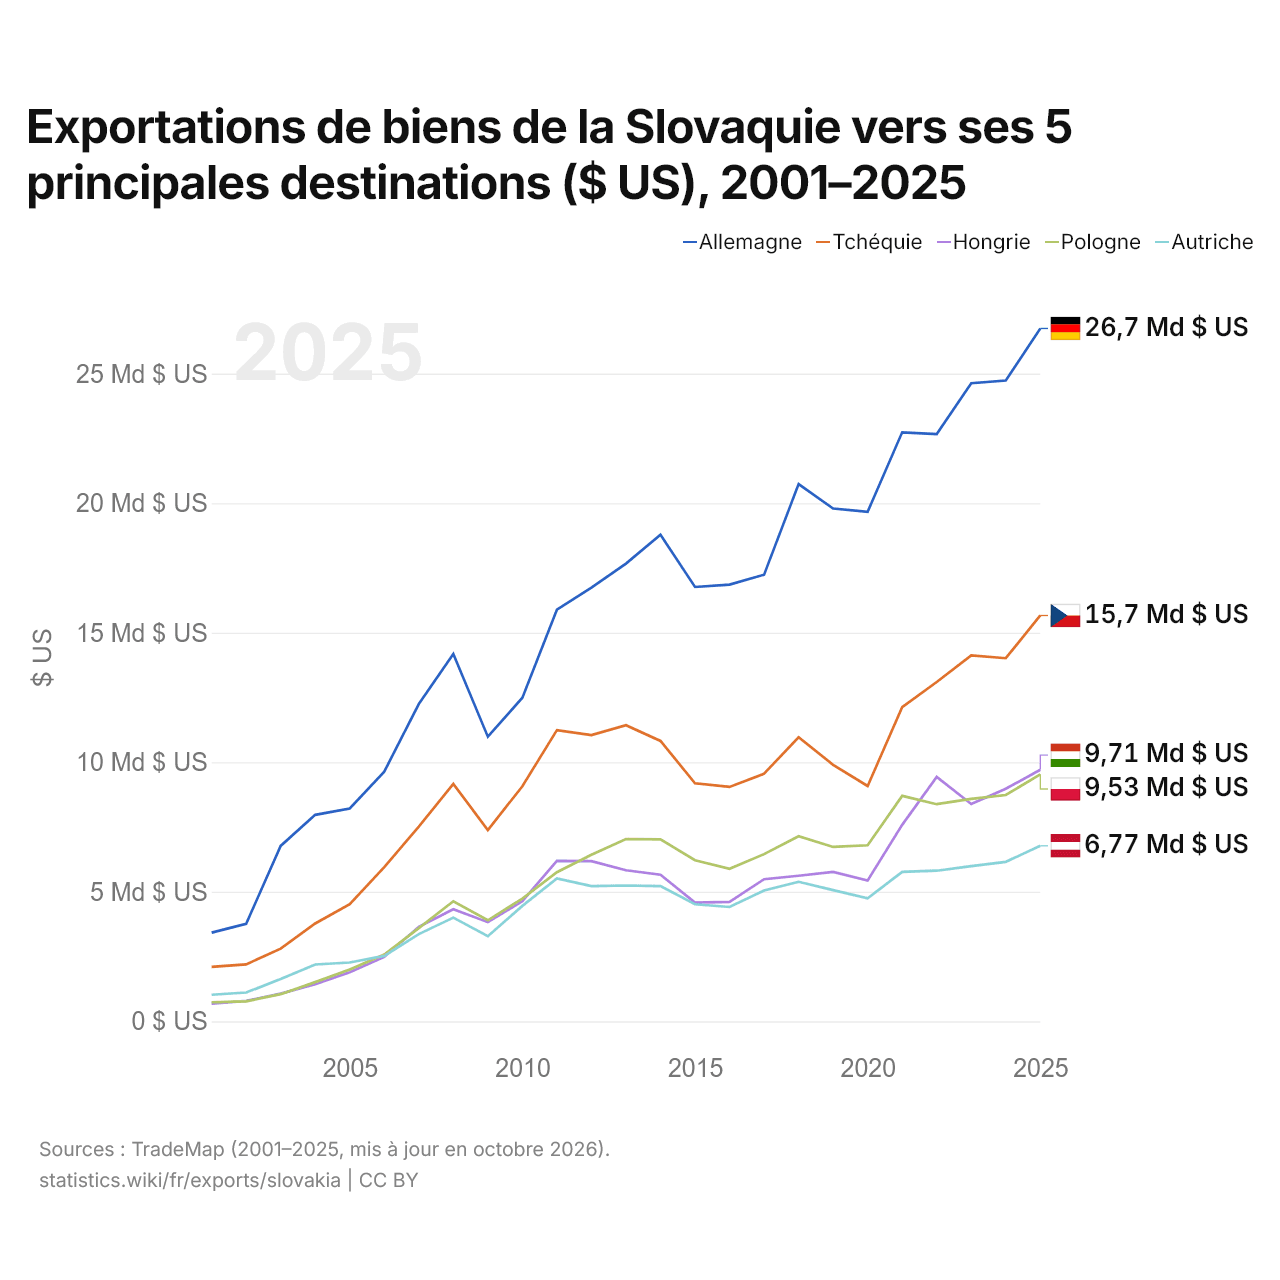
Exportations de biens de la Slovaquie vers ses 5 principales destinations ($ US), 2001–2025
| Année | $ US | ||||
|---|---|---|---|---|---|
| Allemagne | Tchéquie | Hongrie | Pologne | Autriche | |
| 2025 | 26 742 694 000 $ US | 15 663 873 000 $ US | 9 708 150 000 $ US | 9 532 002 000 $ US | 6 774 868 000 $ US |
| 2024 | 24 730 967 000 $ US | 14 014 011 000 $ US | 8 976 387 000 $ US | 8 736 129 000 $ US | 6 155 747 000 $ US |
| 2023 | 24 629 322 000 $ US | 14 124 228 000 $ US | 8 388 356 000 $ US | 8 587 713 000 $ US | 5 988 687 000 $ US |
| 2022 | 22 665 109 000 $ US | 13 095 591 000 $ US | 9 434 371 000 $ US | 8 381 185 000 $ US | 5 813 719 000 $ US |
| 2021 | 22 734 002 000 $ US | 12 128 232 000 $ US | 7 582 897 000 $ US | 8 702 181 000 $ US | 5 770 985 000 $ US |
| 2020 | 19 667 226 000 $ US | 9 082 784 000 $ US | 5 434 850 000 $ US | 6 795 387 000 $ US | 4 750 143 000 $ US |
| 2019 | 19 792 088 000 $ US | 9 899 295 000 $ US | 5 766 803 000 $ US | 6 730 506 000 $ US | 5 063 402 000 $ US |
| 2018 | 20 733 654 000 $ US | 10 965 969 000 $ US | 5 619 520 000 $ US | 7 142 887 000 $ US | 5 384 691 000 $ US |
| 2017 | 17 237 304 000 $ US | 9 557 233 000 $ US | 5 484 176 000 $ US | 6 453 690 000 $ US | 5 049 560 000 $ US |
| 2016 | 16 855 066 000 $ US | 9 048 437 000 $ US | 4 608 827 000 $ US | 5 889 366 000 $ US | 4 412 791 000 $ US |
| 2015 | 16 764 320 000 $ US | 9 187 288 000 $ US | 4 583 564 000 $ US | 6 218 006 000 $ US | 4 517 138 000 $ US |
| 2014 | 18 784 165 000 $ US | 10 822 808 000 $ US | 5 656 298 000 $ US | 7 023 412 000 $ US | 5 218 808 000 $ US |
| 2013 | 17 666 975 000 $ US | 11 429 509 000 $ US | 5 831 109 000 $ US | 7 037 114 000 $ US | 5 244 018 000 $ US |
| 2012 | 16 735 134 000 $ US | 11 046 343 000 $ US | 6 182 510 000 $ US | 6 427 883 000 $ US | 5 221 521 000 $ US |
| 2011 | 15 889 049 000 $ US | 11 240 229 000 $ US | 6 192 013 000 $ US | 5 756 443 000 $ US | 5 511 609 000 $ US |
| 2010 | 12 490 050 000 $ US | 9 073 137 000 $ US | 4 635 616 000 $ US | 4 734 589 000 $ US | 4 455 829 000 $ US |
| 2009 | 10 986 974 000 $ US | 7 380 980 000 $ US | 3 828 648 000 $ US | 3 899 725 000 $ US | 3 286 655 000 $ US |
| 2008 | 14 178 505 000 $ US | 9 161 182 000 $ US | 4 327 430 000 $ US | 4 635 515 000 $ US | 4 003 101 000 $ US |
| 2007 | 12 245 406 000 $ US | 7 517 864 000 $ US | 3 648 001 000 $ US | 3 596 241 000 $ US | 3 366 365 000 $ US |
| 2006 | 9 638 475 000 $ US | 5 952 601 000 $ US | 2 486 491 000 $ US | 2 580 541 000 $ US | 2 524 741 000 $ US |
| 2005 | 8 215 003 000 $ US | 4 520 938 000 $ US | 1 891 778 000 $ US | 2 000 979 000 $ US | 2 271 548 000 $ US |
| 2004 | 7 969 109 000 $ US | 3 776 747 000 $ US | 1 431 353 000 $ US | 1 513 428 000 $ US | 2 192 113 000 $ US |
| 2003 | 6 770 164 000 $ US | 2 805 070 000 $ US | 1 067 965 000 $ US | 1 048 379 000 $ US | 1 632 896 000 $ US |
| 2002 | 3 764 264 000 $ US | 2 199 376 000 $ US | 789 130 000 $ US | 771 999 000 $ US | 1 112 074 000 $ US |
| 2001 | 3 423 690 000 $ US | 2 100 986 000 $ US | 679 574 000 $ US | 736 295 000 $ US | 1 026 971 000 $ US |
En 2025, les exportations de biens s'élevaient à 26,7 milliards de dollars vers l'Allemagne, 15,7 milliards de dollars vers la Tchéquie, 9,71 milliards de dollars vers la Hongrie, 9,53 milliards de dollars vers la Pologne et 6,77 milliards de dollars vers l'Autriche. Le premier rang des cinq destinations de la Slovaquie est occupé par l'Allemagne chaque année depuis 2001. Le changement le plus récent dans leur ordre remonte à 2024, quand les exportations de la Slovaquie vers la Hongrie ont dépassé celles vers la Pologne.
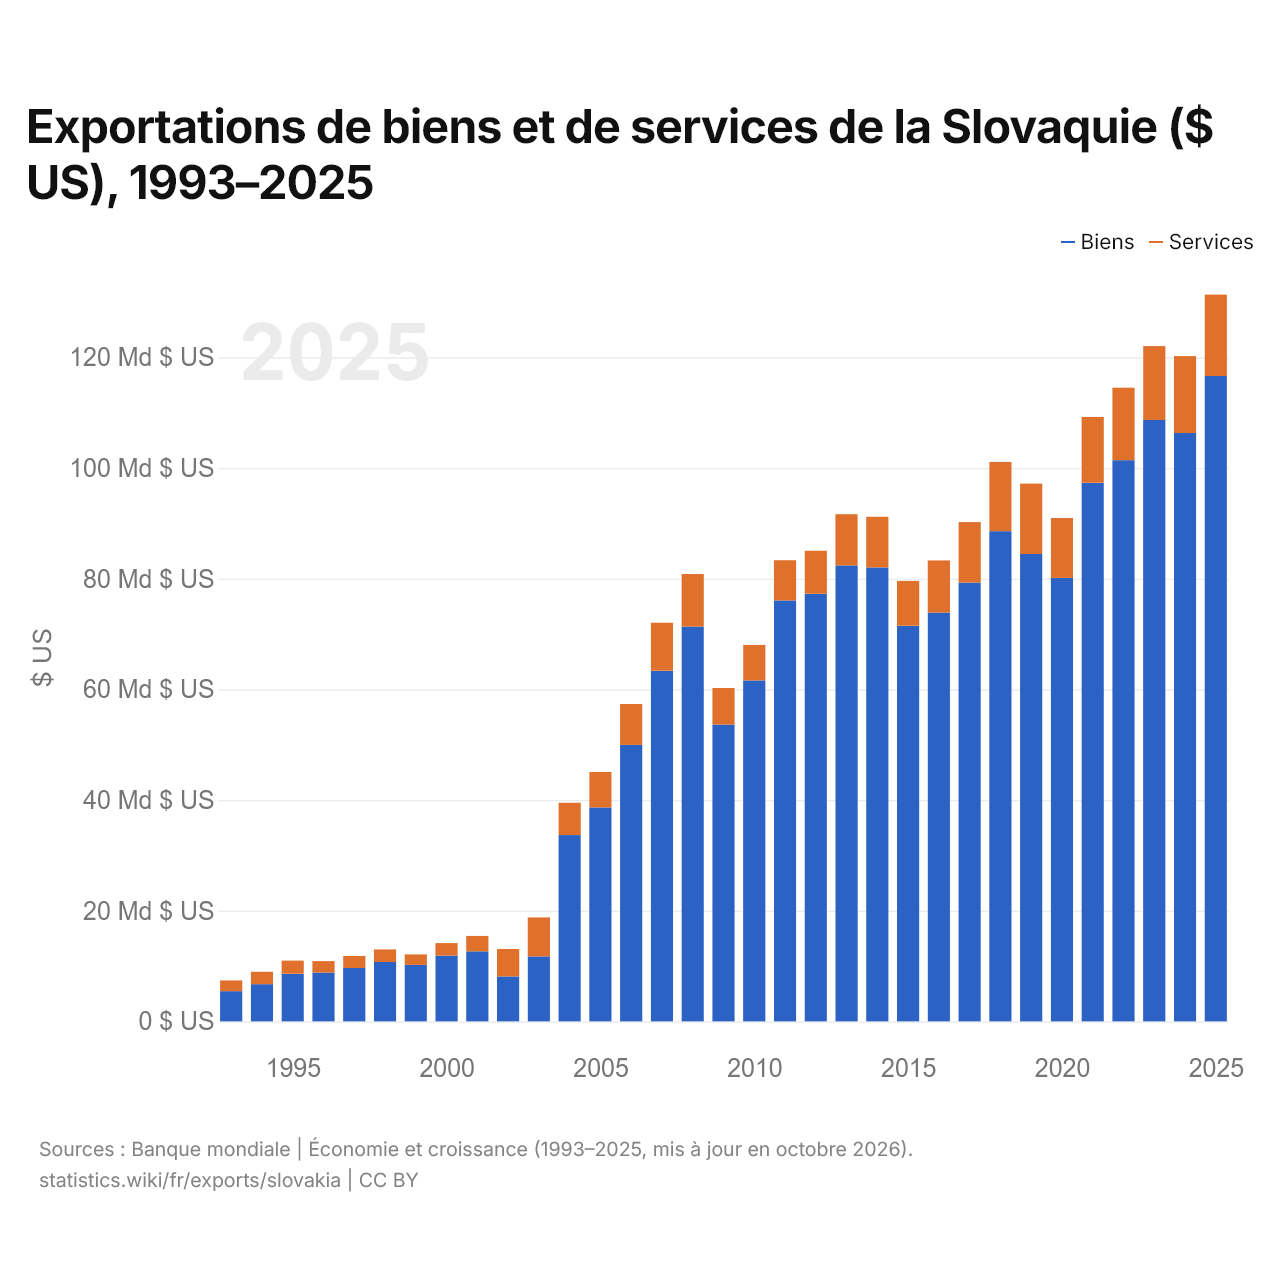
Exportations de biens et de services de la Slovaquie ($ US), 1993–2025
| Année | $ US | |
|---|---|---|
| Biens | Services | |
| 2025 | 116 629 311 540 $ US | 14 702 096 202 $ US |
| 2024 | 106 325 219 799 $ US | 13 910 645 512 $ US |
| 2023 | 108 678 008 493 $ US | 13 362 334 241 $ US |
| 2022 | 101 424 317 049 $ US | 13 095 088 326 $ US |
| 2021 | 97 337 678 492 $ US | 11 899 769 432 $ US |
| 2020 | 80 139 982 636 $ US | 10 833 863 163 $ US |
| 2019 | 84 462 575 022 $ US | 12 718 507 267 $ US |
| 2018 | 88 585 635 015 $ US | 12 522 000 795 $ US |
| 2017 | 79 284 745 354 $ US | 10 947 539 577 $ US |
| 2016 | 73 867 614 302 $ US | 9 431 248 859 $ US |
| 2015 | 71 483 862 052 $ US | 8 122 061 753 $ US |
| 2014 | 82 038 399 235 $ US | 9 142 565 227 $ US |
| 2013 | 82 396 178 609 $ US | 9 251 148 588 $ US |
| 2012 | 77 283 737 364 $ US | 7 768 713 462 $ US |
| 2011 | 76 066 130 755 $ US | 7 276 112 925 $ US |
| 2010 | 61 617 372 910 $ US | 6 412 018 511 $ US |
| 2009 | 53 623 950 505 $ US | 6 614 882 957 $ US |
| 2008 | 71 352 674 200 $ US | 9 494 383 240 $ US |
| 2007 | 63 358 712 442 $ US | 8 686 904 557 $ US |
| 2006 | 49 963 337 484 $ US | 7 393 015 690 $ US |
| 2005 | 38 660 669 205 $ US | 6 398 927 676 $ US |
| 2004 | 33 658 276 915 $ US | 5 847 948 836 $ US |
| 2003 | 11 731 383 936 $ US | 7 062 663 066 $ US |
| 2002 | 8 121 986 239 $ US | 4 942 833 954 $ US |
| 2001 | 12 649 864 385 $ US | 2 781 638 289 $ US |
| 2000 | 11 896 090 154 $ US | 2 240 901 357 $ US |
| 1999 | 10 201 259 493 $ US | 1 899 324 542 $ US |
| 1998 | 10 720 173 976 $ US | 2 292 017 200 $ US |
| 1997 | 9 640 726 248 $ US | 2 167 379 862 $ US |
| 1996 | 8 823 792 904 $ US | 2 065 597 472 $ US |
| 1995 | 8 590 826 423 $ US | 2 378 456 655 $ US |
| 1994 | 6 706 092 530 $ US | 2 261 349 392 $ US |
| 1993 | 5 452 474 589 $ US | 1 938 603 830 $ US |
En 2025, les exportations de biens de la Slovaquie s'élevaient à 117 milliards de dollars et celles de services à 14,7 milliards de dollars ; les services représentaient 11,2 % du total, contre 26,2 % en 1993.
La Slovaquie dans le classement mondial des exportations, 2025
| Rang | Pays | Exportations | Part mondiale | |
|---|---|---|---|---|
| 39 |
 Portugal |
151 Md $US | 0,43 % | |
| 40 |
 Finlande |
134 Md $US | 0,38 % | |
| 41 |
 Afrique du Sud |
134 Md $US | 0,38 % | |
| 42 |
 Slovaquie |
131 Md $US | 0,38 % | |
| 43 |
 Philippines |
129 Md $US | 0,37 % | |
| 44 |
 Chili |
124 Md $US | 0,35 % | |
| 45 |
 Qatar |
114 Md $US | 0,33 % |
Exportations de biens et services de la Slovaquie, % du PIB, 1990–2025
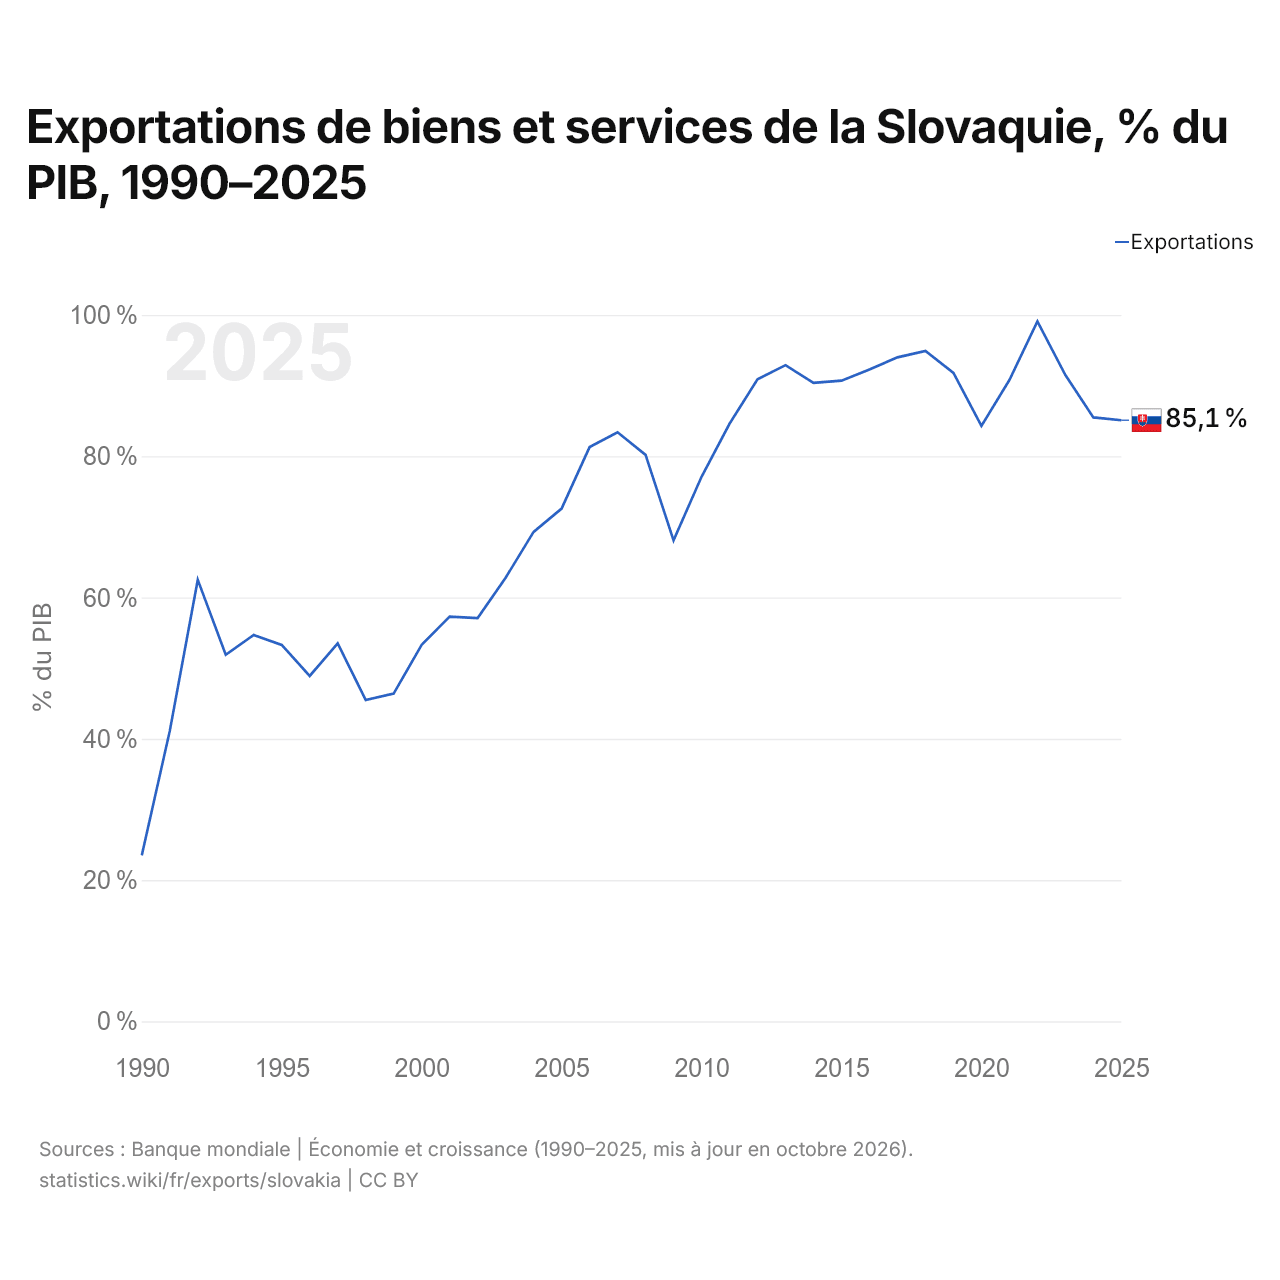
En 2025, les exportations de biens et services de la Slovaquie équivalaient à 85,1 % de son PIB, contre 23,5 % en 1990. La part la plus élevée a été de 99,1 %, en 2022.
Comparer les exportations de la Slovaquie avec celles d'autres pays
Sources :
- TradeMap (2001–2025, mis à jour en octobre 2026)
- Banque mondiale | Économie et croissance (1990–2025, mis à jour en octobre 2026)
Creative Commons Attribution (CC BY) : vous pouvez copier, partager, adapter et réutiliser ce contenu, y compris à des fins commerciales, à condition de citer statistics.wiki et d’indiquer les modifications apportées. Les sources citées ci-dessus peuvent avoir leurs propres conditions de licence.