
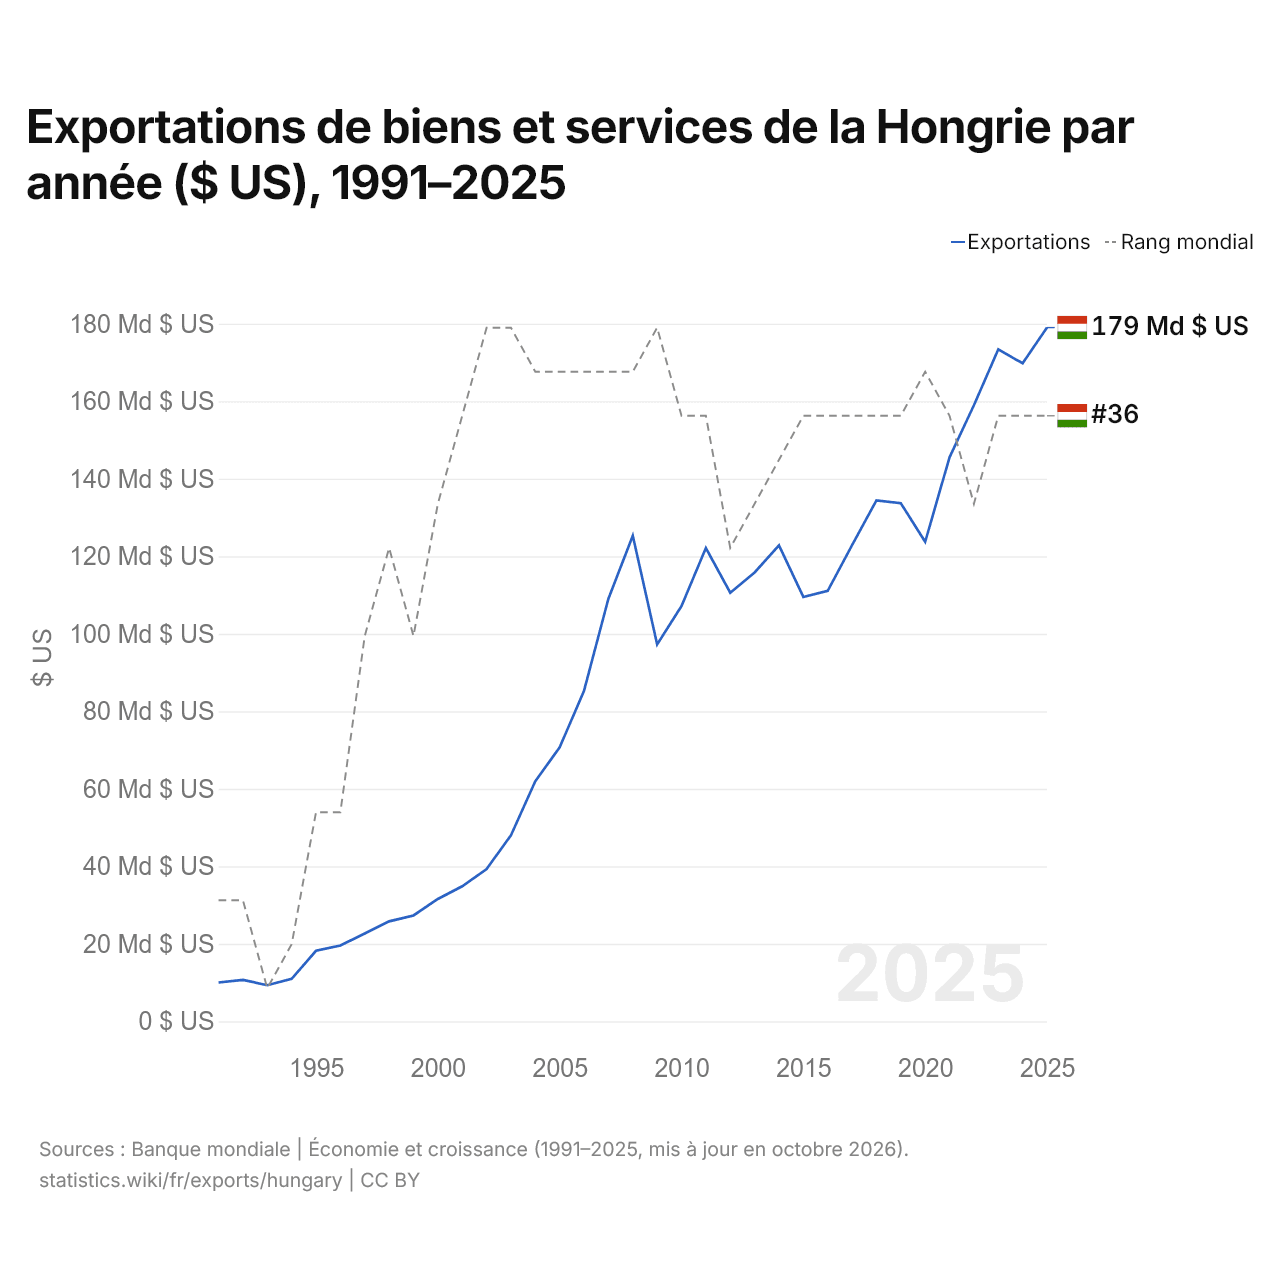
Exportations de biens et services de la Hongrie par année ($ US), 1991–2025
| Année | $ US | Rang mondial |
|---|---|---|
| Exportations | Rang mondial | |
| 2025 | 179 026 907 176 $ US | #36 |
| 2024 | 169 805 683 763 $ US | #36 |
| 2023 | 173 379 370 601 $ US | #36 |
| 2022 | 158 966 257 003 $ US | #38 |
| 2021 | 145 547 409 482 $ US | #36 |
| 2020 | 123 744 764 554 $ US | #35 |
| 2019 | 133 707 076 997 $ US | #36 |
| 2018 | 134 422 841 353 $ US | #36 |
| 2017 | 122 904 333 779 $ US | #36 |
| 2016 | 111 069 631 884 $ US | #36 |
| 2015 | 109 507 057 002 $ US | #36 |
| 2014 | 122 820 302 233 $ US | #37 |
| 2013 | 115 833 299 806 $ US | #38 |
| 2012 | 110 596 984 359 $ US | #39 |
| 2011 | 122 146 730 994 $ US | #36 |
| 2010 | 107 172 345 141 $ US | #36 |
| 2009 | 97 259 190 765 $ US | #34 |
| 2008 | 125 323 028 493 $ US | #35 |
| 2007 | 109 047 007 556 $ US | #35 |
| 2006 | 85 323 332 858 $ US | #35 |
| 2005 | 70 710 738 667 $ US | #35 |
| 2004 | 61 955 833 364 $ US | #35 |
| 2003 | 47 999 431 136 $ US | #34 |
| 2002 | 39 274 697 097 $ US | #34 |
| 2001 | 34 859 576 770 $ US | #36 |
| 2000 | 31 571 752 985 $ US | #38 |
| 1999 | 27 319 788 080 $ US | #41 |
| 1998 | 25 799 585 544 $ US | #39 |
| 1997 | 22 676 867 827 $ US | #41 |
| 1996 | 19 562 990 880 $ US | #45 |
| 1995 | 18 216 633 112 $ US | #45 |
| 1994 | 10 978 579 285 $ US | #48 |
| 1993 | 9 317 495 622 $ US | #49 |
| 1992 | 10 708 915 903 $ US | #47 |
| 1991 | 10 010 613 260 $ US | #47 |
En 2025, les exportations de biens et services de la Hongrie s'élevaient à 179 milliards de dollars, contre 10 milliards de dollars en 1991. Le minimum a été de 9,32 milliards de dollars, en 1993. Elles se classaient au 36e rang mondial, un rang qu'elles occupent depuis 2023. Leur meilleur rang a été le 34e, occupé pour la dernière fois en 2009.
En 2025, les exportations de biens et services de la Hongrie étaient les 18es plus élevées de 41 pays situés en Europe. Les importations de biens et services de la Hongrie s'élevaient à 168 milliards de dollars en 2025, au 37e rang mondial. En 2025, les exportations de la Hongrie dépassaient ses importations de 11 milliards de dollars, soit un excédent commercial.
Exportations de biens de la Hongrie par catégorie, 2025
Exportations de biens, 2025: 166 Md $US
En 2025, la première catégorie des exportations de biens de la Hongrie était « machines, électronique et véhicules », avec 60,4 %, suivie de « produits chimiques, pharmaceutiques et plastiques », avec 12,7 %.
Destinations des exportations de biens de la Hongrie : les 10 premières, 2025
| Rang | Pays | Exportations de biens | Part | |
|---|---|---|---|---|
| 1 |
 Allemagne |
41,0 Md $US | 24,8 % | vs Allemagne |
| 2 |
 Roumanie |
9,11 Md $US | 5,5 % | vs Roumanie |
| 3 |
 Pologne |
8,28 Md $US | 5 % | vs Pologne |
| 4 |
 Italie |
8,11 Md $US | 4,89 % | vs Italie |
| 5 |
 Slovaquie |
7,95 Md $US | 4,79 % | vs Slovaquie |
| 6 |
 Tchéquie |
7,07 Md $US | 4,27 % | vs Tchéquie |
| 7 |
 États-Unis |
6,57 Md $US | 3,96 % | |
| 8 |
 France |
6,45 Md $US | 3,89 % | vs France |
| 9 |
 Autriche |
6,40 Md $US | 3,86 % | vs Autriche |
| 10 |
 Pays-Bas |
6,39 Md $US | 3,85 % | |
| Autres partenaires et non précisés | 58,4 Md $US | 35,2 % |
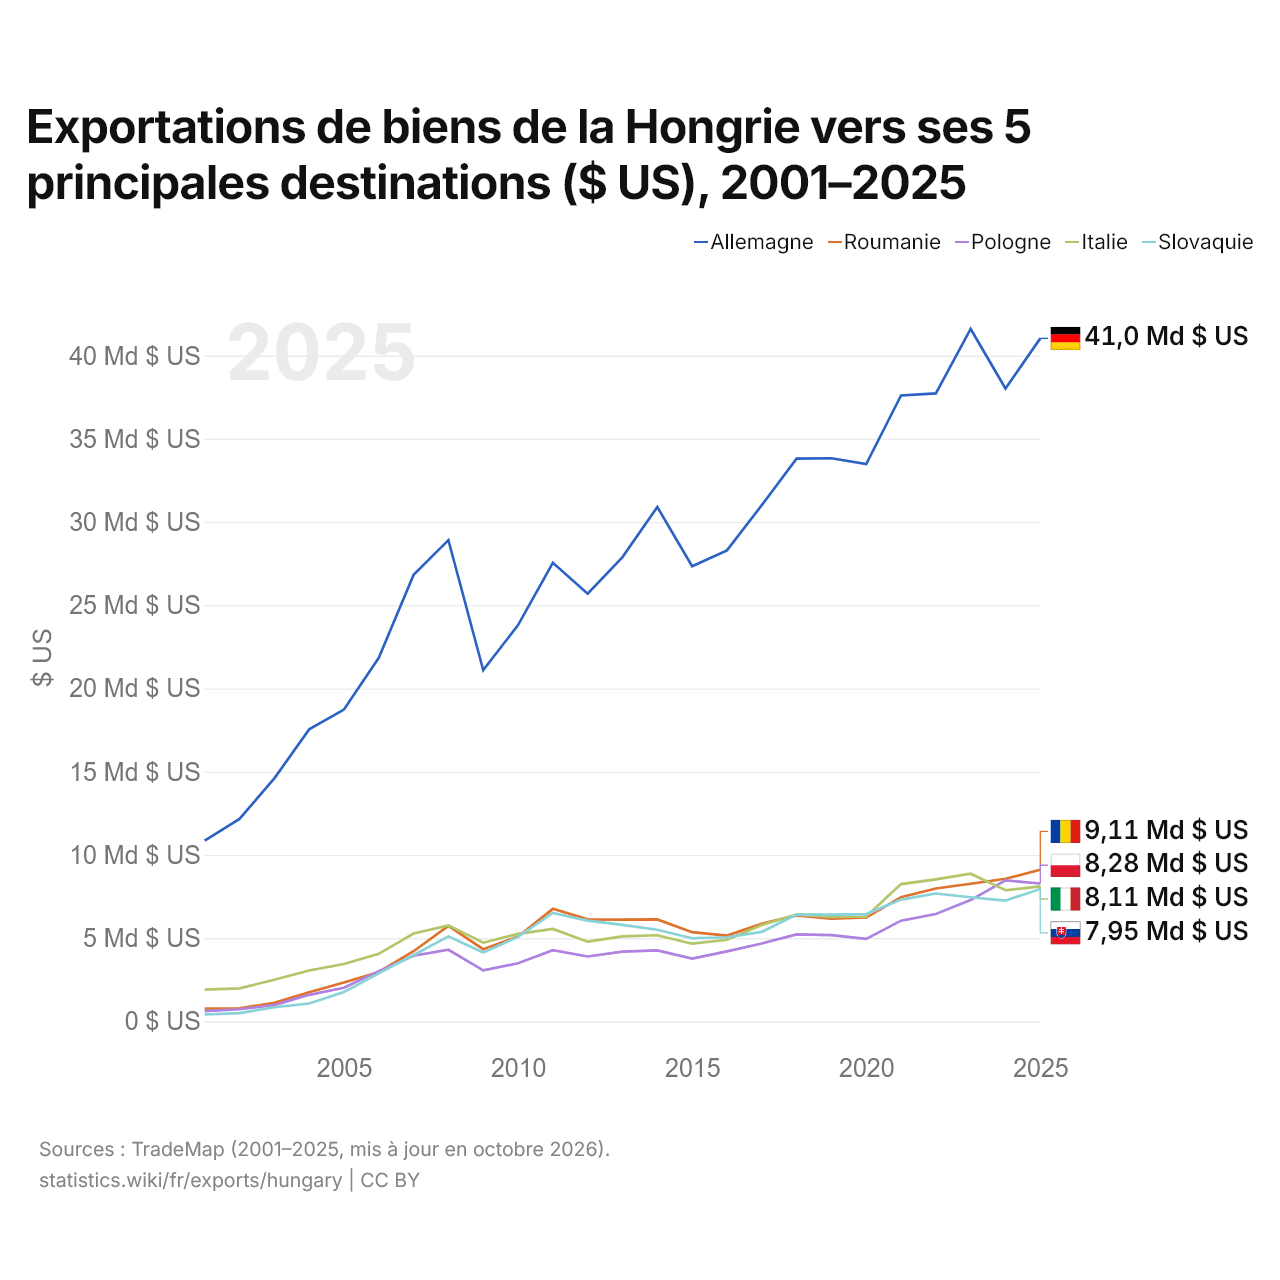
Exportations de biens de la Hongrie vers ses 5 principales destinations ($ US), 2001–2025
| Année | $ US | ||||
|---|---|---|---|---|---|
| Allemagne | Roumanie | Pologne | Italie | Slovaquie | |
| 2025 | 41 029 879 000 $ US | 9 111 564 000 $ US | 8 282 119 000 $ US | 8 112 526 000 $ US | 7 947 482 000 $ US |
| 2024 | 38 018 790 000 $ US | 8 563 637 000 $ US | 8 465 825 000 $ US | 7 874 910 000 $ US | 7 255 722 000 $ US |
| 2023 | 41 598 114 000 $ US | 8 265 168 000 $ US | 7 285 861 000 $ US | 8 871 173 000 $ US | 7 455 533 000 $ US |
| 2022 | 37 724 930 000 $ US | 7 980 460 000 $ US | 6 446 017 000 $ US | 8 525 523 000 $ US | 7 678 817 000 $ US |
| 2021 | 37 602 910 000 $ US | 7 454 356 000 $ US | 6 047 033 000 $ US | 8 244 454 000 $ US | 7 312 637 000 $ US |
| 2020 | 33 478 029 000 $ US | 6 241 648 000 $ US | 4 950 108 000 $ US | 6 300 553 000 $ US | 6 441 752 000 $ US |
| 2019 | 33 827 808 000 $ US | 6 174 042 000 $ US | 5 175 806 000 $ US | 6 272 181 000 $ US | 6 405 979 000 $ US |
| 2018 | 33 803 394 000 $ US | 6 360 679 000 $ US | 5 226 881 000 $ US | 6 413 634 000 $ US | 6 422 669 000 $ US |
| 2017 | 31 009 860 000 $ US | 5 863 764 000 $ US | 4 673 161 000 $ US | 5 790 561 000 $ US | 5 374 152 000 $ US |
| 2016 | 28 293 698 000 $ US | 5 155 254 000 $ US | 4 204 412 000 $ US | 4 899 182 000 $ US | 5 053 414 000 $ US |
| 2015 | 27 340 552 000 $ US | 5 355 449 000 $ US | 3 767 252 000 $ US | 4 665 054 000 $ US | 4 992 122 000 $ US |
| 2014 | 30 899 986 000 $ US | 6 121 492 000 $ US | 4 260 864 000 $ US | 5 170 992 000 $ US | 5 500 569 000 $ US |
| 2013 | 27 888 023 000 $ US | 6 111 627 000 $ US | 4 192 013 000 $ US | 5 101 691 000 $ US | 5 796 840 000 $ US |
| 2012 | 25 694 396 000 $ US | 6 127 705 000 $ US | 3 894 725 000 $ US | 4 785 149 000 $ US | 6 048 641 000 $ US |
| 2011 | 27 550 353 000 $ US | 6 759 415 000 $ US | 4 275 138 000 $ US | 5 550 469 000 $ US | 6 513 317 000 $ US |
| 2010 | 23 805 449 000 $ US | 5 098 748 000 $ US | 3 492 389 000 $ US | 5 252 963 000 $ US | 5 073 125 000 $ US |
| 2009 | 21 101 987 000 $ US | 4 336 550 000 $ US | 3 062 125 000 $ US | 4 723 313 000 $ US | 4 133 208 000 $ US |
| 2008 | 28 909 331 000 $ US | 5 739 594 000 $ US | 4 302 175 000 $ US | 5 764 145 000 $ US | 5 104 987 000 $ US |
| 2007 | 26 824 553 000 $ US | 4 211 021 000 $ US | 3 945 028 000 $ US | 5 273 133 000 $ US | 3 983 267 000 $ US |
| 2006 | 21 841 723 000 $ US | 2 962 412 000 $ US | 3 014 656 000 $ US | 4 057 612 000 $ US | 2 885 087 000 $ US |
| 2005 | 18 731 716 000 $ US | 2 334 718 000 $ US | 2 020 434 000 $ US | 3 444 100 000 $ US | 1 764 215 000 $ US |
| 2004 | 17 539 824 000 $ US | 1 747 824 000 $ US | 1 593 090 000 $ US | 3 054 627 000 $ US | 1 070 981 000 $ US |
| 2003 | 14 595 414 000 $ US | 1 115 678 000 $ US | 975 556 000 $ US | 2 498 320 000 $ US | 846 928 000 $ US |
| 2002 | 12 162 077 000 $ US | 784 287 000 $ US | 727 080 000 $ US | 1 984 089 000 $ US | 496 858 000 $ US |
| 2001 | 10 858 885 000 $ US | 764 230 000 $ US | 609 392 000 $ US | 1 905 356 000 $ US | 411 482 000 $ US |
En 2025, les exportations de biens s'élevaient à 41 milliards de dollars vers l'Allemagne, 9,11 milliards de dollars vers la Roumanie, 8,28 milliards de dollars vers la Pologne, 8,11 milliards de dollars vers l'Italie et 7,95 milliards de dollars vers la Slovaquie. Le premier rang des cinq destinations de la Hongrie est occupé par l'Allemagne chaque année depuis 2001. Le changement le plus récent dans leur ordre remonte à 2024, quand les exportations de la Hongrie vers la Pologne ont dépassé celles vers l'Italie.
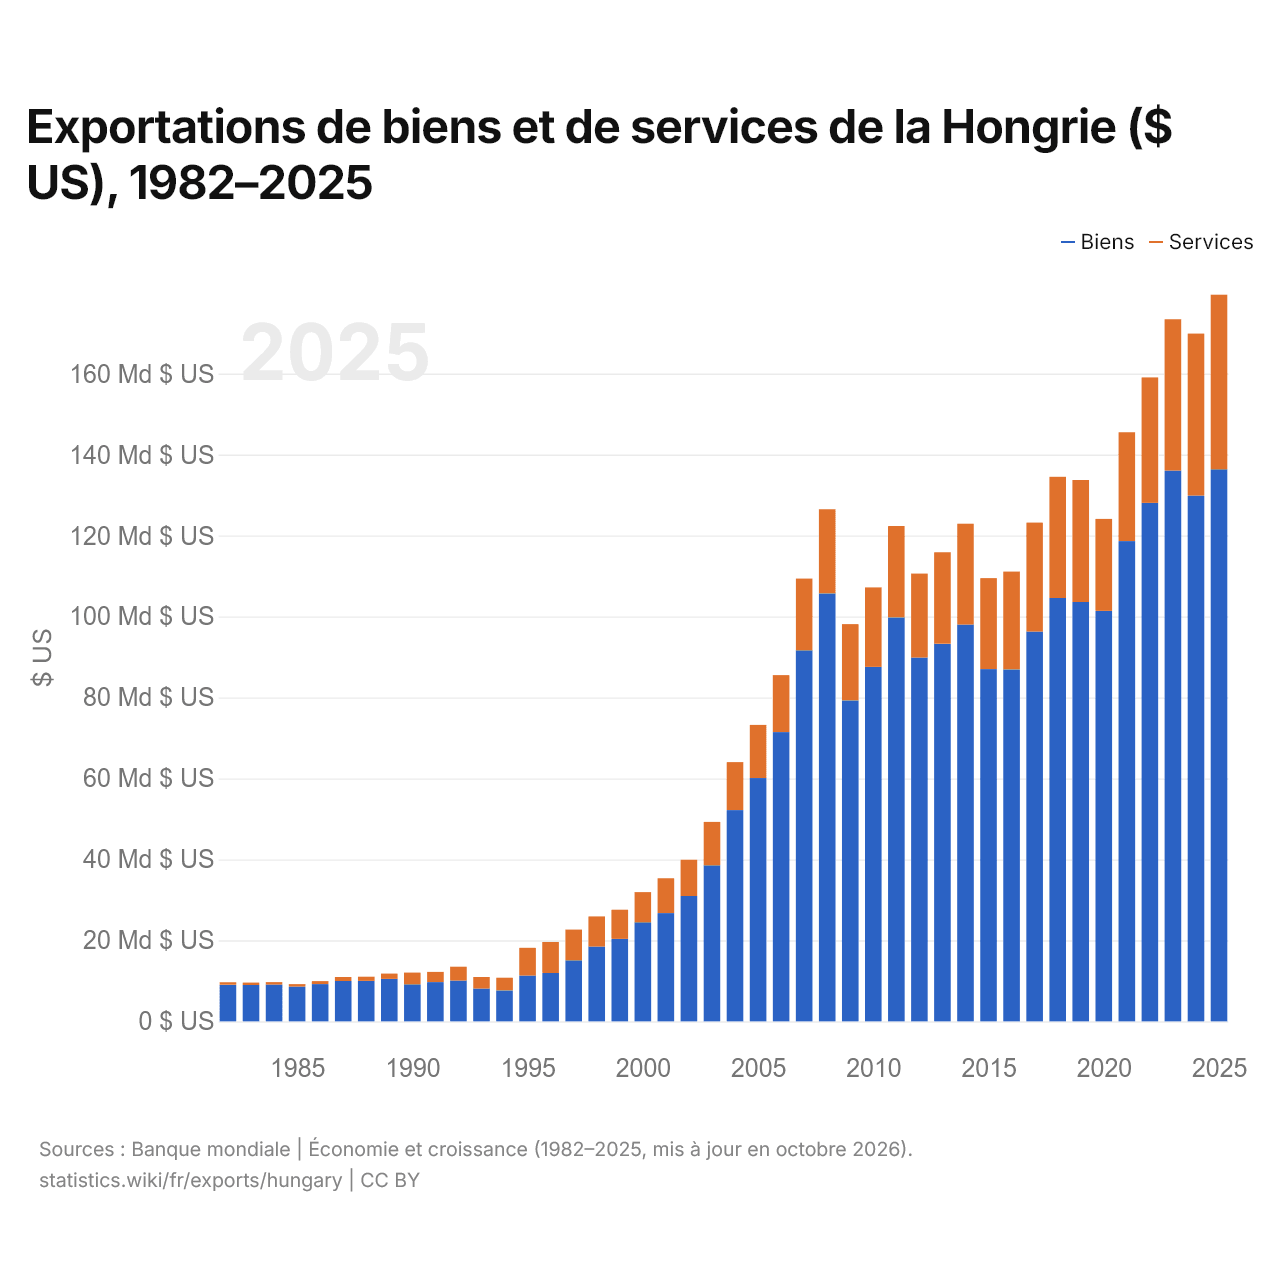
Exportations de biens et de services de la Hongrie ($ US), 1982–2025
| Année | $ US | |
|---|---|---|
| Biens | Services | |
| 2025 | 136 386 327 318 $ US | 43 109 660 023 $ US |
| 2024 | 129 846 656 058 $ US | 40 031 053 828 $ US |
| 2023 | 136 069 087 851 $ US | 37 339 114 885 $ US |
| 2022 | 128 084 535 658 $ US | 30 959 620 443 $ US |
| 2021 | 118 616 309 126 $ US | 26 886 886 300 $ US |
| 2020 | 101 390 531 978 $ US | 22 717 221 868 $ US |
| 2019 | 103 587 343 559 $ US | 30 130 432 790 $ US |
| 2018 | 104 575 195 855 $ US | 29 925 114 736 $ US |
| 2017 | 96 254 325 243 $ US | 26 932 892 485 $ US |
| 2016 | 86 926 883 530 $ US | 24 181 547 657 $ US |
| 2015 | 87 011 801 650 $ US | 22 464 187 326 $ US |
| 2014 | 98 030 885 039 $ US | 24 885 023 369 $ US |
| 2013 | 93 270 935 908 $ US | 22 604 747 446 $ US |
| 2012 | 89 855 311 079 $ US | 20 750 129 604 $ US |
| 2011 | 99 776 305 755 $ US | 22 565 314 000 $ US |
| 2010 | 87 551 406 856 $ US | 19 640 071 485 $ US |
| 2009 | 79 269 521 985 $ US | 18 834 325 199 $ US |
| 2008 | 105 712 622 707 $ US | 20 767 650 477 $ US |
| 2007 | 91 650 574 856 $ US | 17 707 709 321 $ US |
| 2006 | 71 444 353 179 $ US | 14 070 308 107 $ US |
| 2005 | 60 095 050 071 $ US | 13 124 251 574 $ US |
| 2004 | 52 170 305 748 $ US | 11 851 361 633 $ US |
| 2003 | 38 548 335 247 $ US | 10 708 499 903 $ US |
| 2002 | 30 972 099 192 $ US | 8 945 217 163 $ US |
| 2001 | 26 724 180 054 $ US | 8 621 317 267 $ US |
| 2000 | 24 476 084 604 $ US | 7 434 572 268 $ US |
| 1999 | 20 379 578 894 $ US | 7 184 609 985 $ US |
| 1998 | 18 462 289 251 $ US | 7 449 437 925 $ US |
| 1997 | 15 080 009 951 $ US | 7 598 937 008 $ US |
| 1996 | 11 947 574 970 $ US | 7 660 969 562 $ US |
| 1995 | 11 297 475 281 $ US | 6 856 169 855 $ US |
| 1994 | 7 648 220 894 $ US | 3 116 959 038 $ US |
| 1993 | 8 118 736 152 $ US | 2 835 793 844 $ US |
| 1992 | 10 096 604 497 $ US | 3 405 413 899 $ US |
| 1991 | 9 687 529 645 $ US | 2 525 621 664 $ US |
| 1990 | 9 151 260 811 $ US | 2 884 181 851 $ US |
| 1989 | 10 492 947 125 $ US | 1 290 921 324 $ US |
| 1988 | 9 988 949 655 $ US | 1 047 007 357 $ US |
| 1987 | 9 967 098 172 $ US | 980 018 505 $ US |
| 1986 | 9 197 975 657 $ US | 728 986 094 $ US |
| 1985 | 8 577 935 889 $ US | 622 014 629 $ US |
| 1984 | 9 089 965 161 $ US | 594 976 813 $ US |
| 1983 | 8 977 962 863 $ US | 588 992 797 $ US |
| 1982 | 9 038 111 631 $ US | 633 023 528 $ US |
En 2025, les exportations de biens de la Hongrie s'élevaient à 136 milliards de dollars et celles de services à 43,1 milliards de dollars ; les services représentaient 24,0 % du total, contre 6,5 % en 1982.
La Hongrie dans le classement mondial des exportations, 2025
| Rang | Pays | Exportations | Part mondiale | |
|---|---|---|---|---|
| 33 |
Tchéquie
|
262 Md $US | 0,75 % | vs Tchéquie |
| 34 |
 Norvège |
241 Md $US | 0,69 % | |
| 35 |
 Luxembourg |
193 Md $US | 0,55 % | vs Luxembourg |
| 36 |
 Hongrie |
179 Md $US | 0,51 % | |
| 37 |
 Israël |
168 Md $US | 0,48 % | |
| 38 |
Roumanie
|
152 Md $US | 0,44 % | vs Roumanie |
| 39 |
 Portugal |
151 Md $US | 0,43 % | vs Portugal |
Exportations de biens et services de la Hongrie, % du PIB, 1991–2025
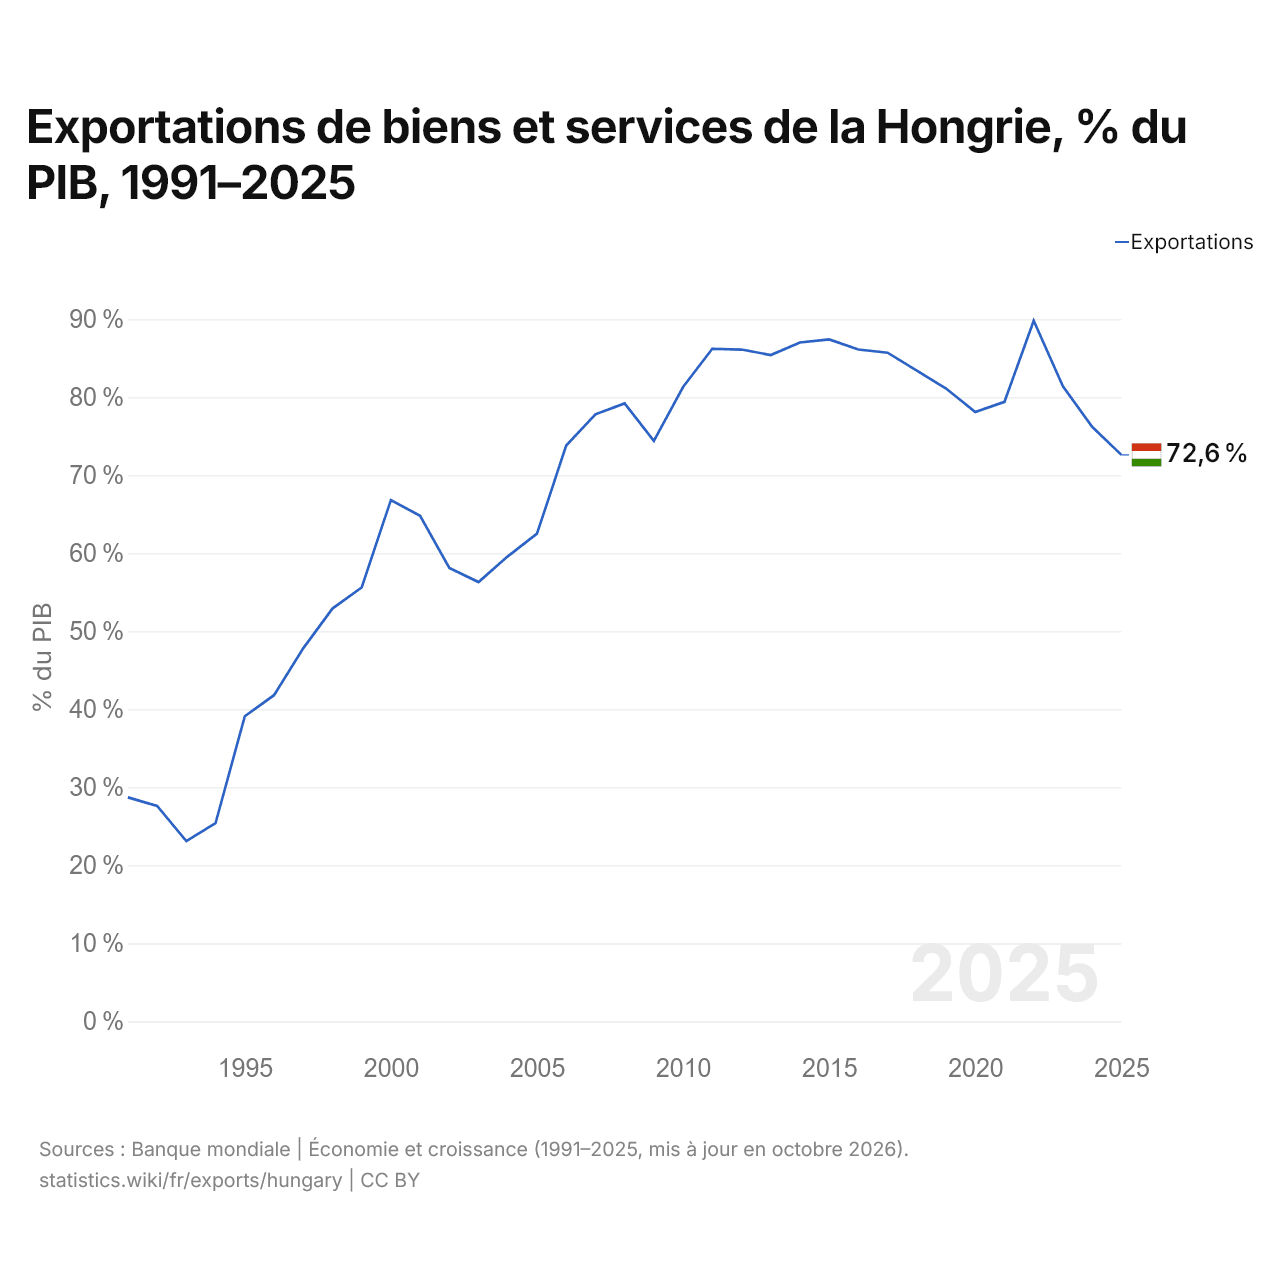
En 2025, les exportations de biens et services de la Hongrie équivalaient à 72,6 % de son PIB, contre 28,7 % en 1991. La part la plus élevée a été de 89,8 %, en 2022.
Comparer les exportations de la Hongrie avec celles d'autres pays
Sources :
- TradeMap (2001–2025, mis à jour en octobre 2026)
- Banque mondiale | Économie et croissance (1982–2025, mis à jour en octobre 2026)
Creative Commons Attribution (CC BY) : vous pouvez copier, partager, adapter et réutiliser ce contenu, y compris à des fins commerciales, à condition de citer statistics.wiki et d’indiquer les modifications apportées. Les sources citées ci-dessus peuvent avoir leurs propres conditions de licence.