
Exportations de biens et services de la Turquie par année ($ US), 1960–2025
| Année | $ US | Rang mondial |
|---|---|---|
| Exportations | Rang mondial | |
| 2025 | 396 923 725 496 $ US | #26 |
| 2024 | 374 686 274 270 $ US | #25 |
| 2023 | 364 211 599 327 $ US | #26 |
| 2022 | 353 224 790 396 $ US | #26 |
| 2021 | 294 429 020 560 $ US | #27 |
| 2020 | 210 844 790 112 $ US | #28 |
| 2019 | 256 263 371 549 $ US | #28 |
| 2018 | 250 128 750 717 $ US | #29 |
| 2017 | 229 267 970 164 $ US | #28 |
| 2016 | 205 793 476 583 $ US | #27 |
| 2015 | 218 795 091 046 $ US | #26 |
| 2014 | 243 287 863 473 $ US | #28 |
| 2013 | 234 800 269 886 $ US | #28 |
| 2012 | 221 029 283 948 $ US | #28 |
| 2011 | 198 303 837 476 $ US | #31 |
| 2010 | 168 951 184 650 $ US | #31 |
| 2009 | 155 351 324 873 $ US | #29 |
| 2008 | 185 490 178 806 $ US | #31 |
| 2007 | 152 035 619 691 $ US | #31 |
| 2006 | 126 908 581 381 $ US | #31 |
| 2005 | 112 432 994 612 $ US | #30 |
| 2004 | 97 840 598 666 $ US | #29 |
| 2003 | 73 154 313 089 $ US | #29 |
| 2002 | 60 832 867 533 $ US | #30 |
| 2001 | 55 193 312 761 $ US | #30 |
| 2000 | 54 766 754 849 $ US | #30 |
| 1999 | 48 333 647 259 $ US | #31 |
| 1998 | 57 013 676 915 $ US | #26 |
| 1997 | 56 559 938 761 $ US | #29 |
| 1996 | 48 967 049 936 $ US | #29 |
| 1995 | 43 006 009 379 $ US | #30 |
| 1994 | 27 909 720 018 $ US | #32 |
| 1993 | 24 669 695 039 $ US | #32 |
| 1992 | 22 898 733 993 $ US | #33 |
| 1991 | 20 904 913 710 $ US | #33 |
| 1990 | 20 135 262 553 $ US | #34 |
| 1989 | 17 357 728 558 $ US | #34 |
| 1988 | 16 951 828 411 $ US | #31 |
| 1987 | 13 584 947 491 $ US | #31 |
| 1986 | 10 073 925 926 $ US | #33 |
| 1985 | 10 663 601 533 $ US | #35 |
| 1984 | 9 354 223 433 $ US | #36 |
| 1983 | 7 708 888 889 $ US | #39 |
| 1982 | 7 636 809 816 $ US | #39 |
| 1981 | 5 863 063 063 $ US | #45 |
| 1980 | 3 552 631 579 $ US | #54 |
| 1979 | 2 883 870 968 $ US | #48 |
| 1978 | 2 733 333 333 $ US | #47 |
| 1977 | 2 238 888 889 $ US | #48 |
| 1976 | 2 500 000 000 $ US | #44 |
| 1975 | 2 035 714 286 $ US | #45 |
| 1974 | 2 028 571 429 $ US | #45 |
| 1973 | 1 828 571 429 $ US | #44 |
| 1972 | 1 242 857 143 $ US | #44 |
| 1971 | 860 000 000 $ US | #47 |
| 1970 | 790 909 091 $ US | #47 |
| 1969 | 700 000 000 $ US | - |
| 1968 | 644 444 444 $ US | - |
| 1967 | 644 444 444 $ US | - |
| 1966 | 577 777 778 $ US | - |
| 1965 | 544 444 444 $ US | - |
| 1964 | 500 000 000 $ US | - |
| 1963 | 433 333 333 $ US | - |
| 1962 | 500 000 000 $ US | - |
| 1961 | 411 111 111 $ US | - |
| 1960 | 155 555 556 $ US | - |
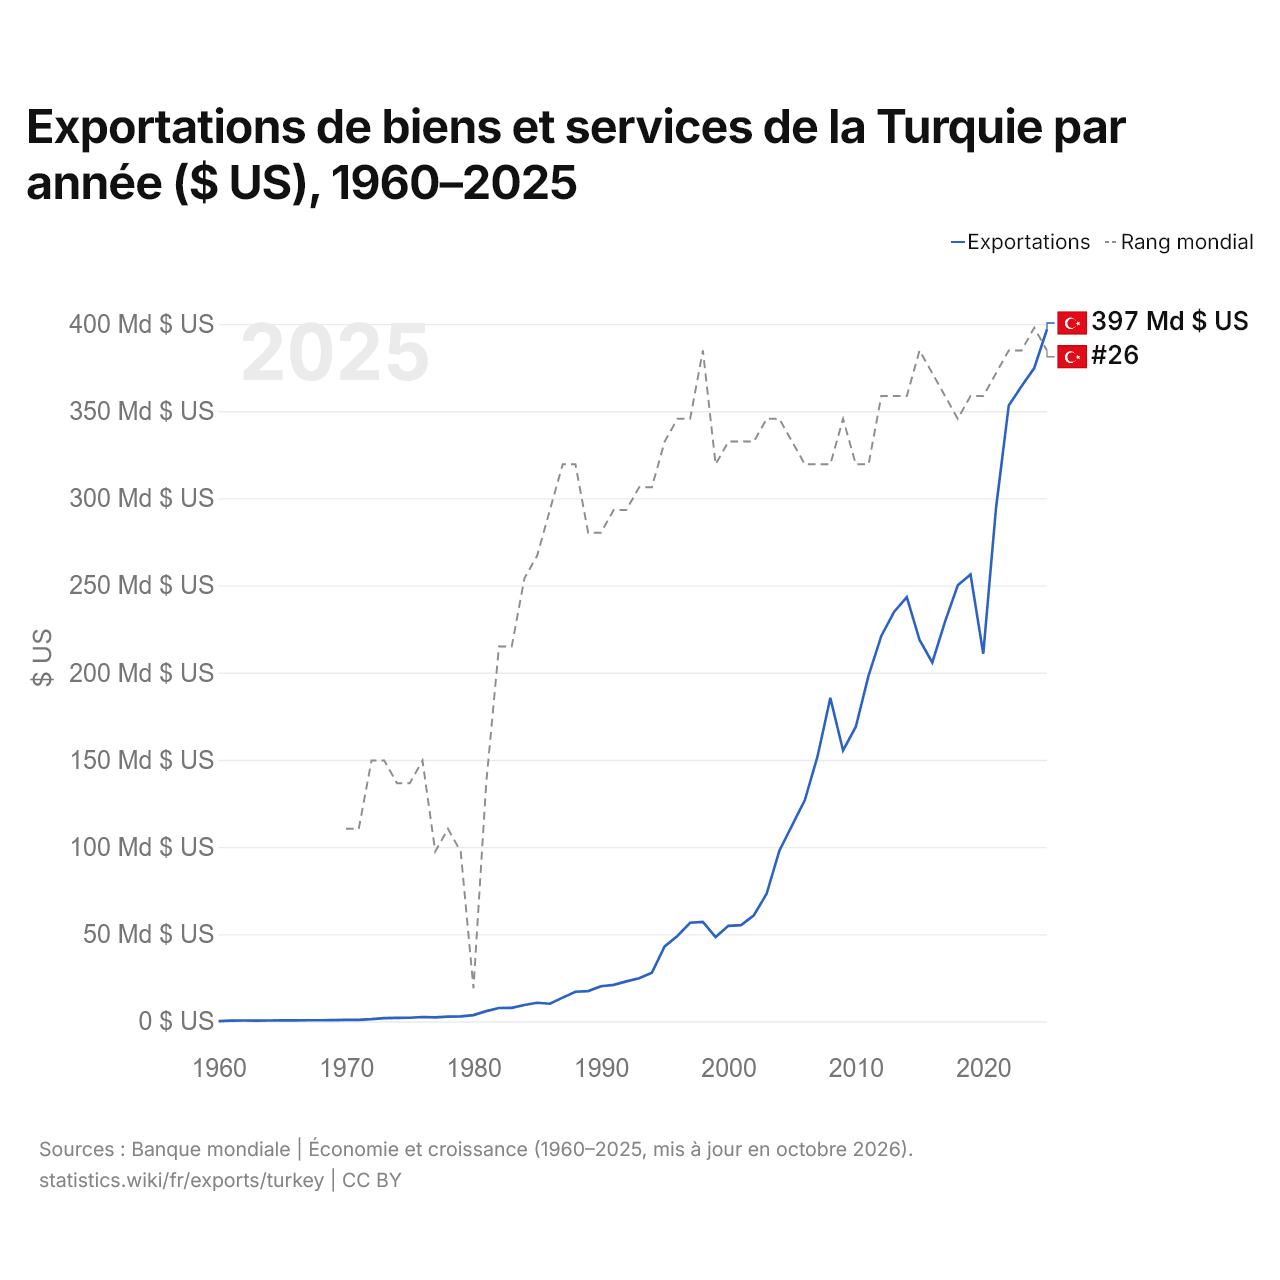
En 2025, les exportations de biens et services de la Turquie s'élevaient à 397 milliards de dollars, contre 156 millions de dollars en 1960. Elles se classaient au 26e rang mondial, en baisse par rapport au 25e rang en 2024. Leur meilleur rang a été le 25e, occupé pour la dernière fois en 2024.
En 2025, les exportations de biens et services de la Turquie étaient les 10es plus élevées de 44 pays situés en Asie. Les importations de biens et services de la Turquie s'élevaient à 401 milliards de dollars en 2025, au 23e rang mondial. En 2025, les importations de la Turquie dépassaient ses exportations de 3,76 milliards de dollars, soit un déficit commercial.
Exportations de biens de la Turquie par catégorie, 2025
Exportations de biens, 2025: 273 Md $US
En 2025, la première catégorie des exportations de biens de la Turquie était « machines, électronique et véhicules », avec 32,6 %, suivie de « textiles, vêtements, chaussures, meubles et jouets », avec 15,1 %.
Destinations des exportations de biens de la Turquie : les 10 premières, 2025
| Rang | Pays | Exportations de biens | Part | |
|---|---|---|---|---|
| 1 |
 Allemagne |
22,2 Md $US | 8,11 % | vs Allemagne |
| 2 |
 Royaume-Uni |
16,8 Md $US | 6,14 % | |
| 3 |
 États-Unis |
16,3 Md $US | 5,98 % | vs USA |
| 4 |
 Italie |
13,2 Md $US | 4,84 % | vs Italie |
| 5 |
 Irak |
12,4 Md $US | 4,53 % | vs Irak |
| 6 |
 France |
11,2 Md $US | 4,1 % | vs France |
| 7 |
 Espagne |
10,4 Md $US | 3,81 % | vs Espagne |
| 8 |
 EAU |
9,28 Md $US | 3,4 % | |
| 9 |
 Roumanie |
8,55 Md $US | 3,13 % | vs Roumanie |
| 10 |
 Pays-Bas |
8,17 Md $US | 2,99 % | vs Pays-Bas |
| Autres partenaires et non précisés | 145 Md $US | 53 % |
Exportations de biens de la Turquie vers ses 5 principales destinations ($ US), 2001–2025
| Année | $ US | ||||
|---|---|---|---|---|---|
| Allemagne | Royaume-Uni | États-Unis | Italie | Irak | |
| 2025 | 22 164 295 000 $ US | 16 771 231 000 $ US | 16 327 902 000 $ US | 13 224 439 000 $ US | 12 374 097 000 $ US |
| 2024 | 20 432 312 000 $ US | 15 289 517 000 $ US | 16 351 880 000 $ US | 12 956 297 000 $ US | 13 006 477 000 $ US |
| 2023 | 21 083 354 000 $ US | 12 463 116 000 $ US | 14 879 654 000 $ US | 12 373 834 000 $ US | 12 759 358 000 $ US |
| 2022 | 21 144 909 000 $ US | 13 010 911 000 $ US | 16 882 282 000 $ US | 12 353 974 000 $ US | 13 750 841 000 $ US |
| 2021 | 19 317 751 000 $ US | 13 705 148 000 $ US | 14 719 306 000 $ US | 11 474 990 000 $ US | 11 131 282 000 $ US |
| 2020 | 15 980 400 000 $ US | 11 236 969 000 $ US | 10 183 213 000 $ US | 8 082 942 000 $ US | 9 142 515 000 $ US |
| 2019 | 16 624 070 000 $ US | 11 281 350 000 $ US | 8 971 874 000 $ US | 9 754 698 000 $ US | 10 224 285 000 $ US |
| 2018 | 16 137 388 000 $ US | 11 107 336 000 $ US | 8 304 672 000 $ US | 9 560 597 000 $ US | 8 346 276 000 $ US |
| 2017 | 15 118 910 000 $ US | 9 603 189 000 $ US | 8 654 268 000 $ US | 8 473 629 000 $ US | 9 054 612 000 $ US |
| 2016 | 14 004 848 000 $ US | 11 690 650 000 $ US | 6 627 394 000 $ US | 7 583 132 000 $ US | 7 640 287 000 $ US |
| 2015 | 13 417 478 000 $ US | 10 556 863 000 $ US | 6 395 899 000 $ US | 6 887 778 000 $ US | 8 550 298 000 $ US |
| 2014 | 16 275 367 000 $ US | 10 216 479 000 $ US | 6 921 399 000 $ US | 7 486 545 000 $ US | 13 154 131 000 $ US |
| 2013 | 14 832 546 000 $ US | 9 126 733 000 $ US | 6 647 525 000 $ US | 7 474 685 000 $ US | 12 949 891 000 $ US |
| 2012 | 13 124 375 000 $ US | 8 693 599 000 $ US | 5 606 487 000 $ US | 6 373 488 000 $ US | 10 822 144 000 $ US |
| 2011 | 13 950 825 000 $ US | 8 151 430 000 $ US | 4 585 849 000 $ US | 7 854 463 000 $ US | 8 310 130 000 $ US |
| 2010 | 11 479 066 000 $ US | 7 235 861 000 $ US | 3 766 034 000 $ US | 6 507 052 000 $ US | 6 036 362 000 $ US |
| 2009 | 9 793 006 000 $ US | 5 937 997 000 $ US | 3 250 109 000 $ US | 5 889 622 000 $ US | 5 123 406 000 $ US |
| 2008 | 12 951 755 000 $ US | 8 158 669 000 $ US | 4 316 424 000 $ US | 7 820 270 000 $ US | 3 916 685 000 $ US |
| 2007 | 11 993 232 000 $ US | 8 626 776 000 $ US | 4 177 593 000 $ US | 7 480 711 000 $ US | 2 844 767 000 $ US |
| 2006 | 9 686 235 000 $ US | 6 814 301 000 $ US | 5 061 330 000 $ US | 6 752 991 000 $ US | 2 589 352 000 $ US |
| 2005 | 9 455 050 000 $ US | 5 917 163 000 $ US | 4 910 817 000 $ US | 5 618 164 000 $ US | 2 750 080 000 $ US |
| 2004 | 8 745 282 000 $ US | 5 544 303 000 $ US | 4 860 148 000 $ US | 4 649 422 000 $ US | 1 820 802 000 $ US |
| 2003 | 7 484 931 000 $ US | 3 670 093 000 $ US | 3 753 865 000 $ US | 3 194 797 000 $ US | 829 058 000 $ US |
| 2002 | 5 868 813 000 $ US | 3 024 942 000 $ US | 3 356 360 000 $ US | 2 375 994 000 $ US | - |
| 2001 | 5 366 680 000 $ US | 2 174 892 000 $ US | 3 125 804 000 $ US | 2 342 204 000 $ US | - |
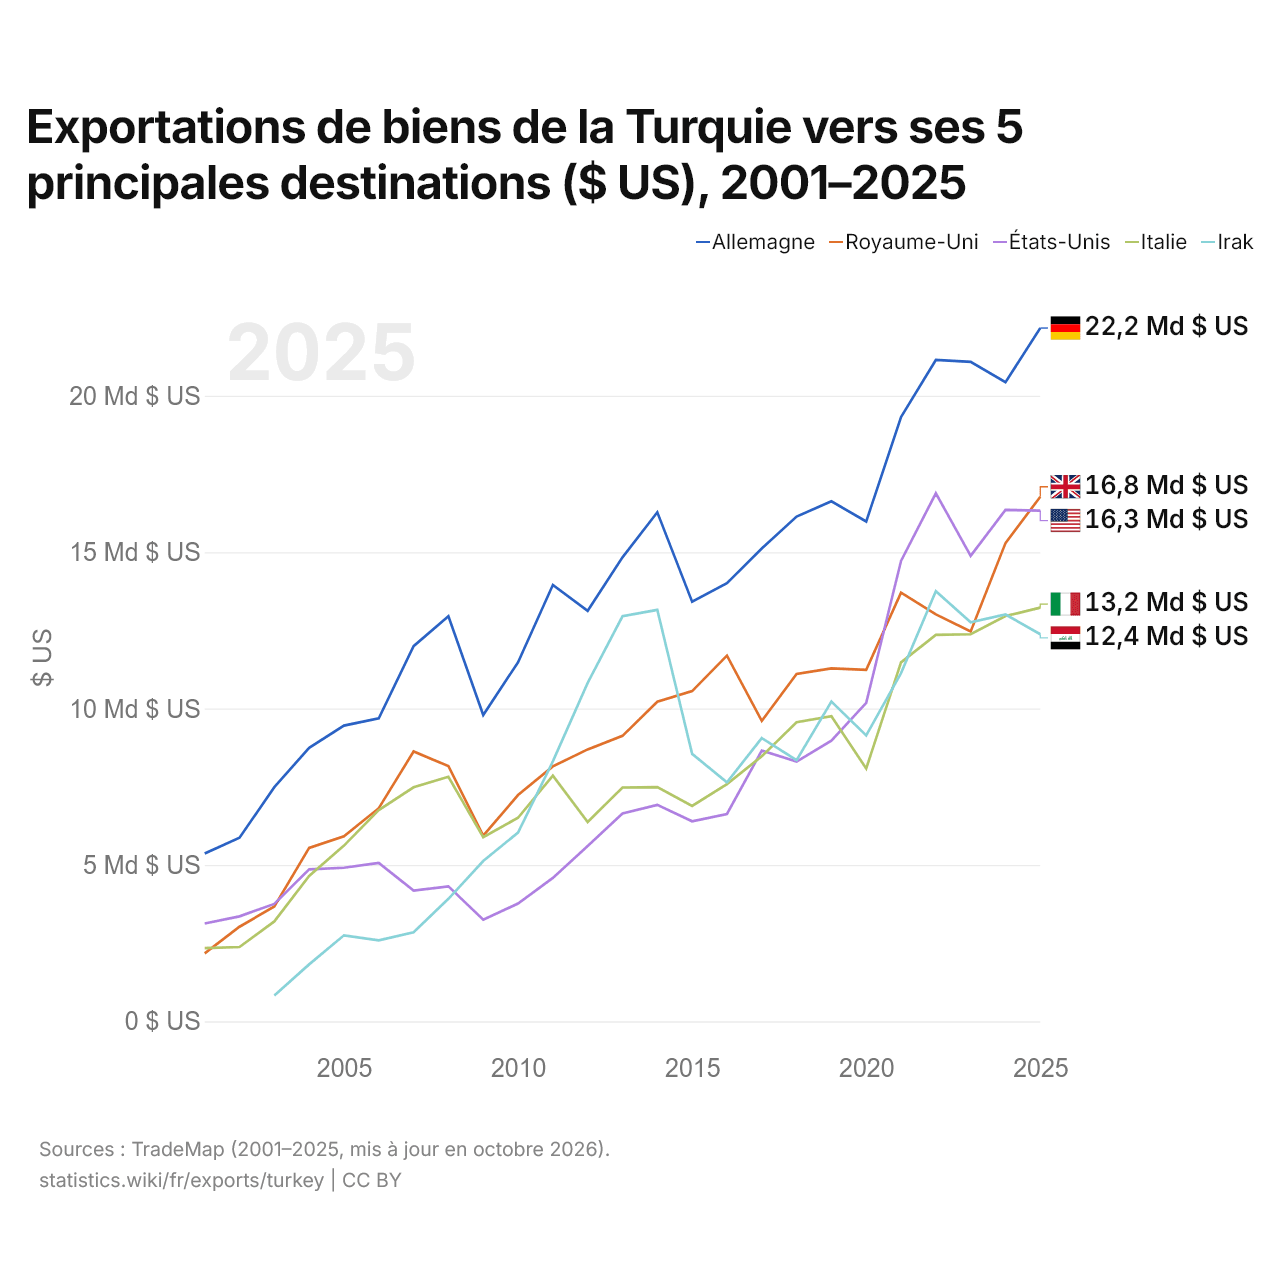
En 2025, les exportations de biens s'élevaient à 22,2 milliards de dollars vers l'Allemagne, 16,8 milliards de dollars vers le Royaume-Uni, 16,3 milliards de dollars vers les États-Unis, 13,2 milliards de dollars vers l'Italie et 12,4 milliards de dollars vers l'Irak. Le premier rang des cinq destinations de la Turquie est occupé par l'Allemagne chaque année depuis 2001. Le changement le plus récent dans leur ordre remonte à 2025, quand les exportations de la Turquie vers le Royaume-Uni ont dépassé celles vers les États-Unis.
Exportations de biens et de services de la Turquie ($ US), 1974–2025
| Année | $ US | |
|---|---|---|
| Biens | Services | |
| 2025 | 270 673 000 000 $ US | 122 604 000 000 $ US |
| 2024 | 257 453 000 000 $ US | 117 189 000 000 $ US |
| 2023 | 250 994 000 000 $ US | 105 534 000 000 $ US |
| 2022 | 253 352 000 000 $ US | 93 250 000 000 $ US |
| 2021 | 224 673 000 000 $ US | 62 863 000 000 $ US |
| 2020 | 168 378 000 000 $ US | 39 256 000 000 $ US |
| 2019 | 182 200 000 000 $ US | 71 665 000 000 $ US |
| 2018 | 178 905 000 000 $ US | 65 470 000 000 $ US |
| 2017 | 169 214 000 000 $ US | 59 118 000 000 $ US |
| 2016 | 152 645 000 000 $ US | 51 382 000 000 $ US |
| 2015 | 154 865 000 000 $ US | 62 022 000 000 $ US |
| 2014 | 173 292 000 000 $ US | 69 311 000 000 $ US |
| 2013 | 167 397 000 000 $ US | 65 981 000 000 $ US |
| 2012 | 161 948 000 000 $ US | 49 690 000 000 $ US |
| 2011 | 142 392 000 000 $ US | 41 255 000 000 $ US |
| 2010 | 120 992 000 000 $ US | 36 449 000 000 $ US |
| 2009 | 109 732 000 000 $ US | 35 816 000 000 $ US |
| 2008 | 140 906 000 000 $ US | 37 112 000 000 $ US |
| 2007 | 115 379 000 000 $ US | 30 006 000 000 $ US |
| 2006 | 93 778 000 000 $ US | 26 093 000 000 $ US |
| 2005 | 78 509 000 000 $ US | 27 822 000 000 $ US |
| 2004 | 68 833 000 000 $ US | 23 085 000 000 $ US |
| 2003 | 52 472 000 000 $ US | 18 030 000 000 $ US |
| 2002 | 40 705 000 000 $ US | 14 045 000 000 $ US |
| 2001 | 34 810 000 000 $ US | 15 153 000 000 $ US |
| 2000 | 30 923 000 000 $ US | 19 430 000 000 $ US |
| 1999 | 29 135 000 000 $ US | 16 347 000 000 $ US |
| 1998 | 30 852 000 000 $ US | 23 265 000 000 $ US |
| 1997 | 32 195 000 000 $ US | 19 333 000 000 $ US |
| 1996 | 32 142 000 000 $ US | 13 008 000 000 $ US |
| 1995 | 21 975 000 000 $ US | 14 606 000 000 $ US |
| 1994 | 18 390 000 000 $ US | 10 801 000 000 $ US |
| 1993 | 15 611 000 000 $ US | 10 652 000 000 $ US |
| 1992 | 14 891 000 000 $ US | 9 407 000 000 $ US |
| 1991 | 13 667 000 000 $ US | 8 372 000 000 $ US |
| 1990 | 13 026 000 000 $ US | 8 016 000 000 $ US |
| 1989 | 11 780 000 000 $ US | 6 414 000 000 $ US |
| 1988 | 11 929 000 000 $ US | 5 652 000 000 $ US |
| 1987 | 10 322 000 000 $ US | 3 813 000 000 $ US |
| 1986 | 7 583 000 000 $ US | 2 997 000 000 $ US |
| 1985 | 8 255 000 000 $ US | 2 864 000 000 $ US |
| 1984 | 7 389 000 000 $ US | 2 220 000 000 $ US |
| 1983 | 5 905 000 000 $ US | 1 939 000 000 $ US |
| 1982 | 5 890 000 000 $ US | 1 918 000 000 $ US |
| 1981 | 4 703 000 000 $ US | 1 264 000 000 $ US |
| 1980 | 2 910 000 000 $ US | 711 000 000 $ US |
| 1979 | 2 261 000 000 $ US | 674 000 000 $ US |
| 1978 | 2 288 000 000 $ US | 467 000 000 $ US |
| 1977 | 1 753 000 000 $ US | 534 000 000 $ US |
| 1976 | 1 960 000 000 $ US | 580 000 000 $ US |
| 1975 | 1 401 000 000 $ US | 616 000 000 $ US |
| 1974 | 1 532 000 000 $ US | 549 000 000 $ US |
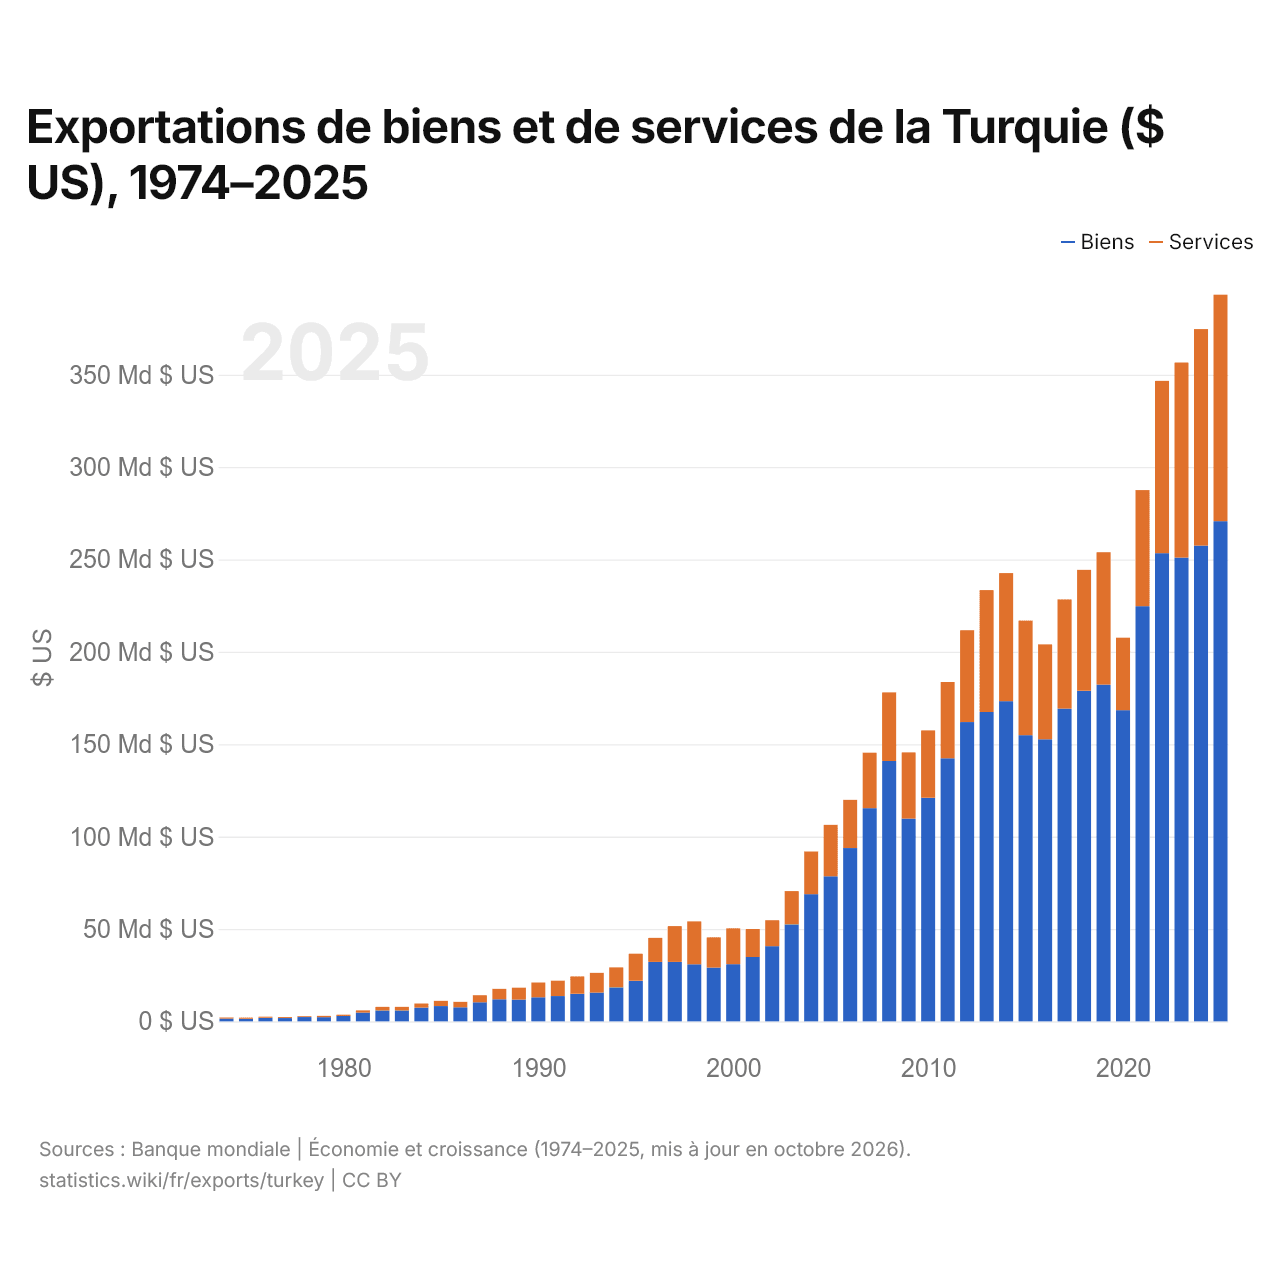
En 2025, les exportations de biens de la Turquie s'élevaient à 271 milliards de dollars et celles de services à 123 milliards de dollars ; les services représentaient 31,2 % du total, contre 26,4 % en 1974.
La Turquie dans le classement mondial des exportations, 2025
| Rang | Pays | Exportations | Part mondiale | |
|---|---|---|---|---|
| 23 |
 Australie |
418 Md $US | 1,2 % | vs Australie |
| 24 |
 Thaïlande |
411 Md $US | 1,18 % | vs Thaïlande |
| 25 |
 Brésil |
406 Md $US | 1,16 % | vs Brésil |
| 26 |
 Turquie |
397 Md $US | 1,14 % | |
| 27 |
 Arabie saoudite |
380 Md $US | 1,09 % | vs Arabie saoudite |
| 28 |
 Suède |
356 Md $US | 1,02 % | |
| 29 |
 Malaisie |
335 Md $US | 0,96 % | vs Malaisie |
Exportations de biens et services de la Turquie, % du PIB, 1960–2025
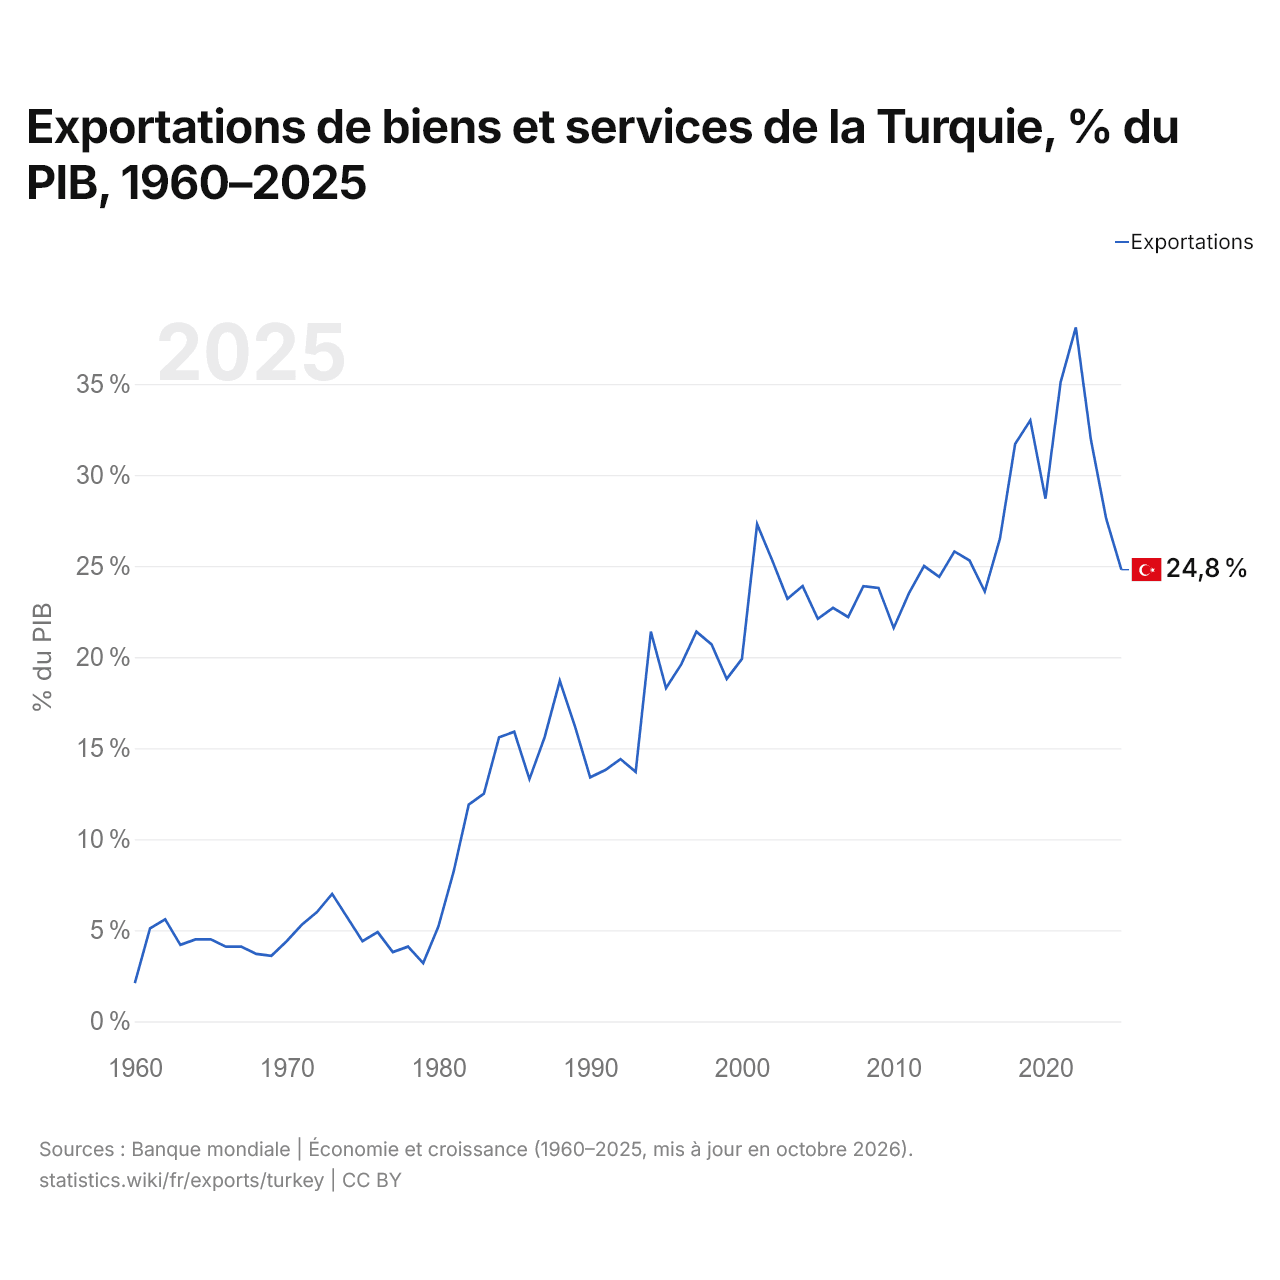
En 2025, les exportations de biens et services de la Turquie équivalaient à 24,8 % de son PIB, contre 2,1 % en 1960. La part la plus élevée a été de 38,1 %, en 2022.
Comparer les exportations de la Turquie avec celles d'autres pays
Sources :
- TradeMap (2001–2025, mis à jour en octobre 2026)
- Banque mondiale | Économie et croissance (1960–2025, mis à jour en octobre 2026)
Creative Commons Attribution (CC BY) : vous pouvez copier, partager, adapter et réutiliser ce contenu, y compris à des fins commerciales, à condition de citer statistics.wiki et d’indiquer les modifications apportées. Les sources citées ci-dessus peuvent avoir leurs propres conditions de licence.