
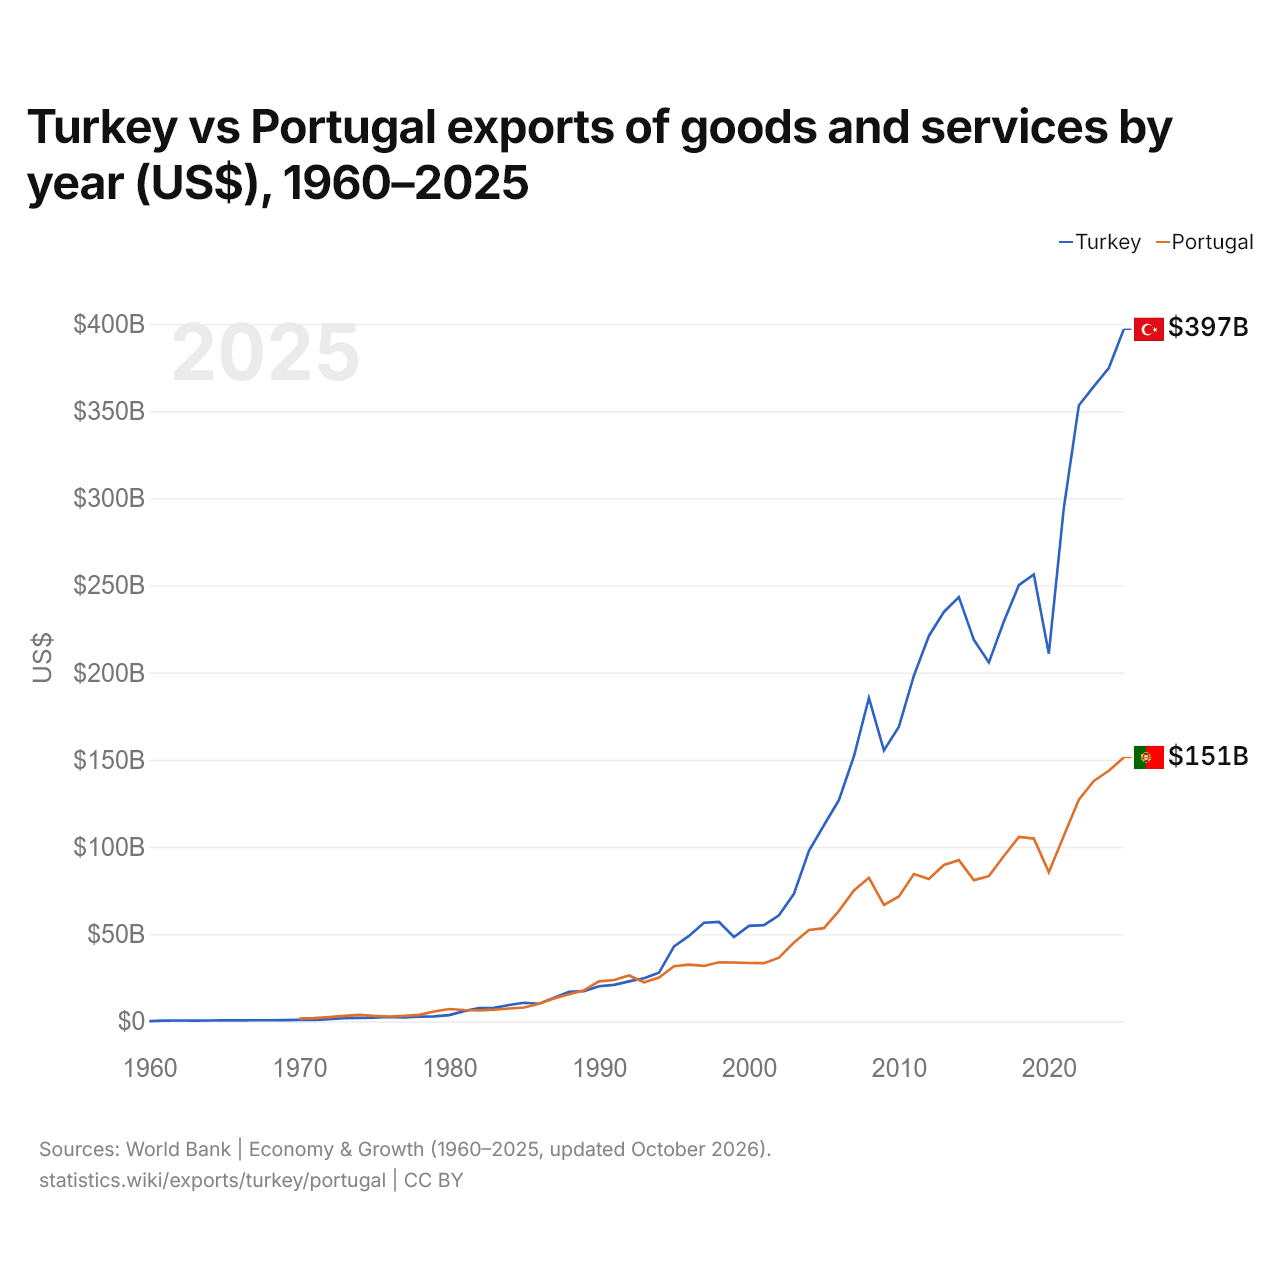
Turquie vs Portugal : exportations de biens et services par année ($ US), 1960–2025
| Année | $ US | |
|---|---|---|
 Turquie |
 Portugal |
|
| 2025 | 396 923 725 496 $ US | 151 336 322 847 $ US |
| 2024 | 374 686 274 270 $ US | 143 716 598 546 $ US |
| 2023 | 364 211 599 327 $ US | 137 846 682 522 $ US |
| 2022 | 353 224 790 396 $ US | 127 117 787 017 $ US |
| 2021 | 294 429 020 560 $ US | 106 387 190 475 $ US |
| 2020 | 210 844 790 112 $ US | 85 546 804 978 $ US |
| 2019 | 256 263 371 549 $ US | 104 818 126 822 $ US |
| 2018 | 250 128 750 717 $ US | 105 740 319 070 $ US |
| 2017 | 229 267 970 164 $ US | 94 844 484 378 $ US |
| 2016 | 205 793 476 583 $ US | 83 254 740 237 $ US |
| 2015 | 218 795 091 046 $ US | 80 984 130 312 $ US |
| 2014 | 243 287 863 473 $ US | 92 457 300 369 $ US |
| 2013 | 234 800 269 886 $ US | 89 682 537 232 $ US |
| 2012 | 221 029 283 948 $ US | 81 685 225 652 $ US |
| 2011 | 198 303 837 476 $ US | 84 455 064 293 $ US |
| 2010 | 168 951 184 650 $ US | 71 598 934 533 $ US |
| 2009 | 155 351 324 873 $ US | 66 778 989 702 $ US |
| 2008 | 185 490 178 806 $ US | 82 346 807 429 $ US |
| 2007 | 152 035 619 691 $ US | 75 020 812 081 $ US |
| 2006 | 126 908 581 381 $ US | 63 373 039 604 $ US |
| 2005 | 112 432 994 612 $ US | 53 424 570 458 $ US |
| 2004 | 97 840 598 666 $ US | 52 396 449 477 $ US |
| 2003 | 73 154 313 089 $ US | 45 217 764 525 $ US |
| 2002 | 60 832 867 533 $ US | 36 493 691 735 $ US |
| 2001 | 55 193 312 761 $ US | 33 364 915 450 $ US |
| 2000 | 54 766 754 849 $ US | 33 452 144 656 $ US |
| 1999 | 48 333 647 259 $ US | 33 756 675 285 $ US |
| 1998 | 57 013 676 915 $ US | 33 876 548 308 $ US |
| 1997 | 56 559 938 761 $ US | 31 774 839 337 $ US |
| 1996 | 48 967 049 936 $ US | 32 556 406 291 $ US |
| 1995 | 43 006 009 379 $ US | 31 620 944 673 $ US |
| 1994 | 27 909 720 018 $ US | 25 055 310 386 $ US |
| 1993 | 24 669 695 039 $ US | 22 422 442 339 $ US |
| 1992 | 22 898 733 993 $ US | 26 315 596 971 $ US |
| 1991 | 20 904 913 710 $ US | 23 689 342 306 $ US |
| 1990 | 20 135 262 553 $ US | 22 960 185 628 $ US |
| 1989 | 17 357 728 558 $ US | 17 854 164 757 $ US |
| 1988 | 16 951 828 411 $ US | 15 572 504 178 $ US |
| 1987 | 13 584 947 491 $ US | 13 172 520 279 $ US |
| 1986 | 10 073 925 926 $ US | 10 071 952 821 $ US |
| 1985 | 10 663 601 533 $ US | 7 929 289 328 $ US |
| 1984 | 9 354 223 433 $ US | 7 358 490 824 $ US |
| 1983 | 7 708 888 889 $ US | 6 687 714 441 $ US |
| 1982 | 7 636 809 816 $ US | 6 314 253 280 $ US |
| 1981 | 5 863 063 063 $ US | 6 501 188 925 $ US |
| 1980 | 3 552 631 579 $ US | 7 058 033 640 $ US |
| 1979 | 2 883 870 968 $ US | 5 643 155 738 $ US |
| 1978 | 2 733 333 333 $ US | 3 702 002 737 $ US |
| 1977 | 2 238 888 889 $ US | 3 094 730 225 $ US |
| 1976 | 2 500 000 000 $ US | 2 777 320 955 $ US |
| 1975 | 2 035 714 286 $ US | 3 092 305 882 $ US |
| 1974 | 2 028 571 429 $ US | 3 686 495 659 $ US |
| 1973 | 1 828 571 429 $ US | 3 160 024 530 $ US |
| 1972 | 1 242 857 143 $ US | 2 398 176 427 $ US |
| 1971 | 860 000 000 $ US | 1 808 141 343 $ US |
| 1970 | 790 909 091 $ US | 1 549 504 881 $ US |
| 1969 | 700 000 000 $ US | - |
| 1968 | 644 444 444 $ US | - |
| 1967 | 644 444 444 $ US | - |
| 1966 | 577 777 778 $ US | - |
| 1965 | 544 444 444 $ US | - |
| 1964 | 500 000 000 $ US | - |
| 1963 | 433 333 333 $ US | - |
| 1962 | 500 000 000 $ US | - |
| 1961 | 411 111 111 $ US | - |
| 1960 | 155 555 556 $ US | - |
En 2025, les exportations de biens et services de la Turquie s'élevaient à 397 milliards de dollars et celles du Portugal à 151 milliards de dollars : celles de la Turquie étaient 2,6 fois plus élevées. En 1970, les exportations du Portugal étaient 2,0 fois plus élevées : 791 millions de dollars pour la Turquie et 1,55 milliard de dollars pour le Portugal.
Les exportations de biens et services de la Turquie sont supérieures à celles du Portugal chaque année depuis 1993.
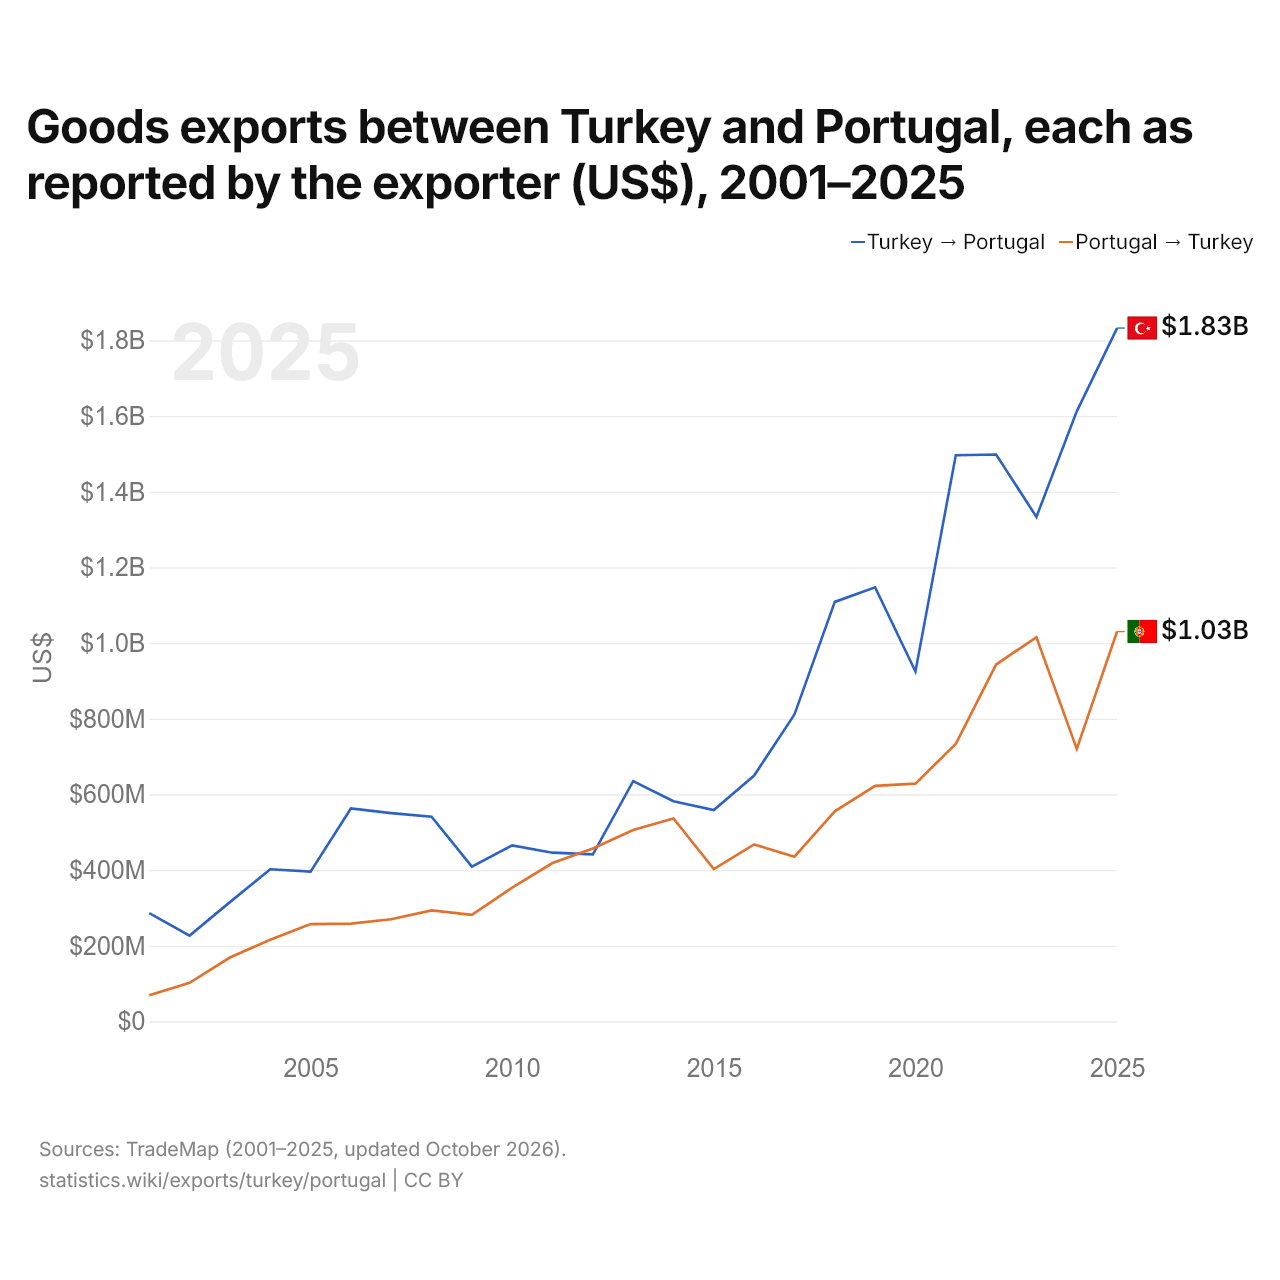
Exportations de biens entre la Turquie et le Portugal, selon chaque exportateur ($ US), 2001–2025
| Année | $ US | |
|---|---|---|
| Turquie → Portugal | Portugal → Turquie | |
| 2025 | 1 832 561 000 $ US | 1 030 315 000 $ US |
| 2024 | 1 612 444 000 $ US | 719 914 000 $ US |
| 2023 | 1 333 394 000 $ US | 1 015 372 000 $ US |
| 2022 | 1 498 293 000 $ US | 943 128 000 $ US |
| 2021 | 1 496 349 000 $ US | 733 451 000 $ US |
| 2020 | 924 650 000 $ US | 628 354 000 $ US |
| 2019 | 1 147 190 000 $ US | 622 286 000 $ US |
| 2018 | 1 108 751 000 $ US | 555 338 000 $ US |
| 2017 | 811 176 000 $ US | 435 194 000 $ US |
| 2016 | 649 735 000 $ US | 467 709 000 $ US |
| 2015 | 558 357 000 $ US | 402 578 000 $ US |
| 2014 | 581 702 000 $ US | 536 322 000 $ US |
| 2013 | 634 947 000 $ US | 505 934 000 $ US |
| 2012 | 441 102 000 $ US | 457 037 000 $ US |
| 2011 | 445 740 000 $ US | 418 496 000 $ US |
| 2010 | 465 228 000 $ US | 353 344 000 $ US |
| 2009 | 408 920 000 $ US | 281 568 000 $ US |
| 2008 | 540 744 000 $ US | 293 182 000 $ US |
| 2007 | 550 527 000 $ US | 269 708 000 $ US |
| 2006 | 562 721 000 $ US | 258 250 000 $ US |
| 2005 | 395 538 000 $ US | 256 986 000 $ US |
| 2004 | 401 998 000 $ US | 215 816 000 $ US |
| 2003 | 315 201 000 $ US | 168 568 000 $ US |
| 2002 | 226 648 000 $ US | 101 670 000 $ US |
| 2001 | 286 099 000 $ US | 68 699 000 $ US |
En 2025, les exportations de biens de la Turquie vers le Portugal, selon la Turquie, s'élevaient à 1,83 milliard de dollars, et celles du Portugal vers la Turquie, selon le Portugal, à 1,03 milliard de dollars : 1,8 fois plus pour celles de la Turquie. En 2001, elles s'élevaient à 286 millions de dollars pour la Turquie et à 68,7 millions de dollars pour le Portugal.
Turquie vs Portugal : chiffres des exportations
|
Turquie
|
Portugal
|
|
|---|---|---|
| Exportations | 397 Md $US (2025) | 151 Md $US (2025) |
| Rang mondial | 26/176 | 39/176 |
| Part mondiale | 1,14 % | 0,43 % |
| % du PIB | 24,8 % | 43,7 % |
| Première catégorie de biens | Machines, électronique et véhicules (32,6 %, 2025) | Machines, électronique et véhicules (31,6 %, 2025) |
| Première destination des biens | Allemagne (8,11 %, 2025) | Espagne (26 %, 2025) |
Comparer les exportations de 2 pays au choix
Sources :
- Banque mondiale | Économie et croissance (1960–2025, mis à jour en octobre 2026)
- TradeMap (2001–2025, mis à jour en octobre 2026)
Creative Commons Attribution (CC BY) : vous pouvez copier, partager, adapter et réutiliser ce contenu, y compris à des fins commerciales, à condition de citer statistics.wiki et d’indiquer les modifications apportées. Les sources citées ci-dessus peuvent avoir leurs propres conditions de licence.