
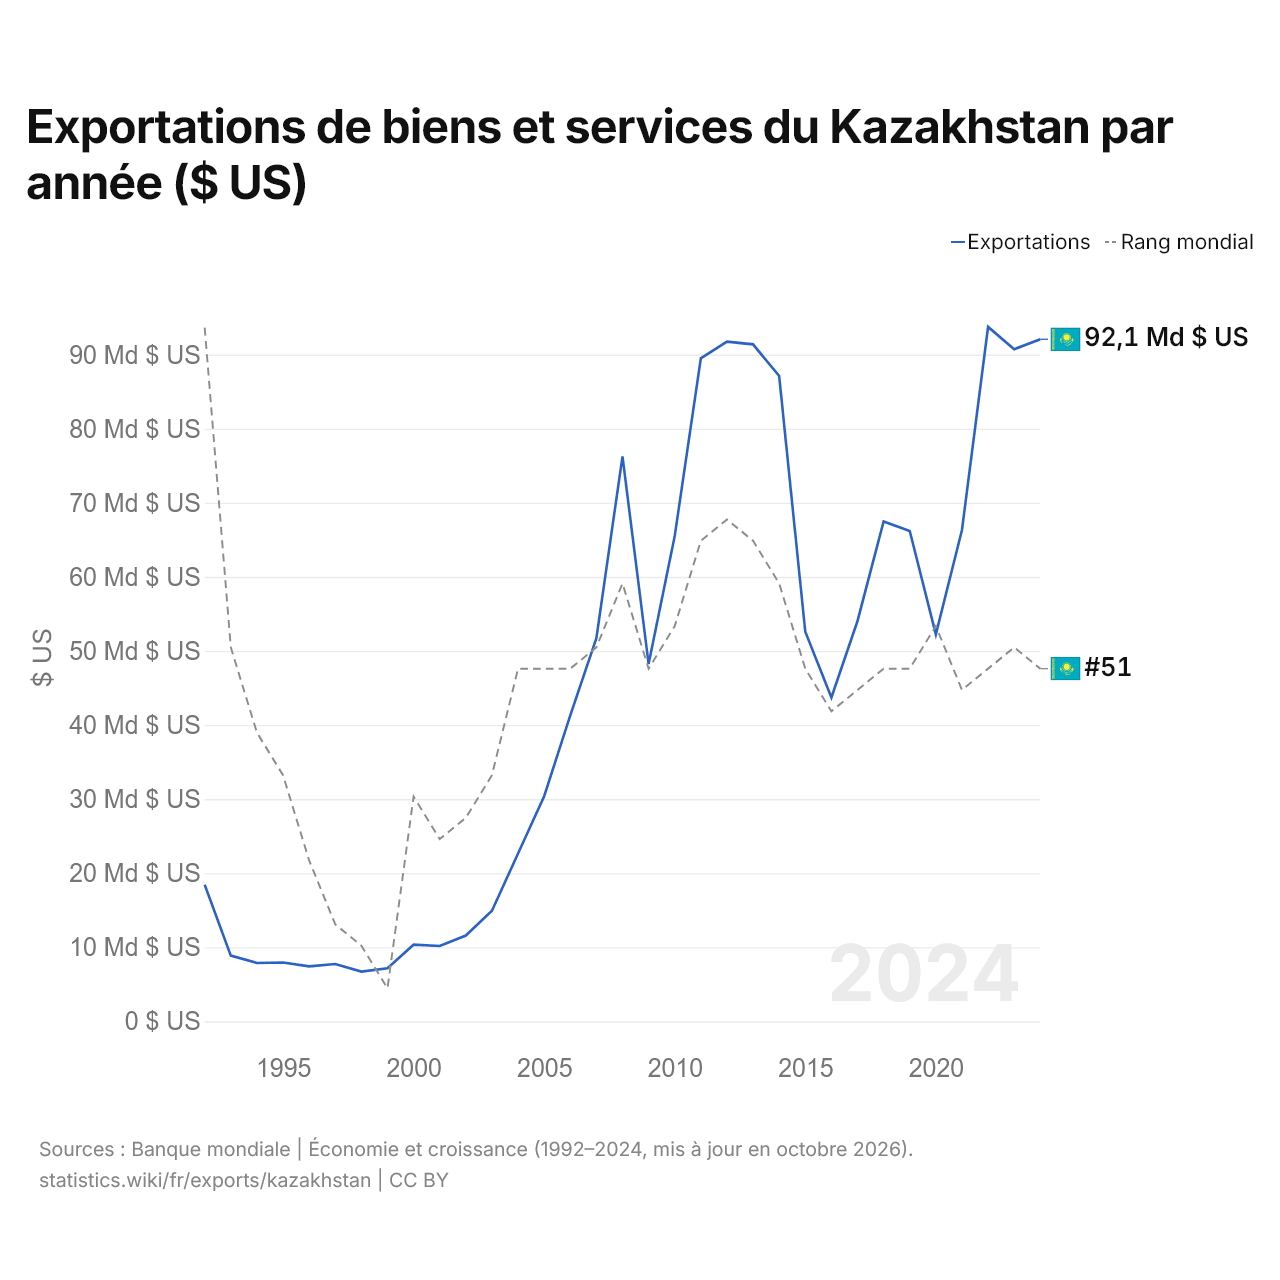
Exportations de biens et services du Kazakhstan par année ($ US)
| Année | $ US | Rang mondial |
|---|---|---|
| Exportations | Rang mondial | |
| 2024 | 92 070 351 467 $ US | #51 |
| 2023 | 90 729 107 012 $ US | #50 |
| 2022 | 93 736 589 050 $ US | #51 |
| 2021 | 66 318 146 546 $ US | #52 |
| 2020 | 52 229 576 023 $ US | #49 |
| 2019 | 66 197 682 052 $ US | #51 |
| 2018 | 67 477 058 330 $ US | #51 |
| 2017 | 54 041 327 349 $ US | #52 |
| 2016 | 43 714 755 378 $ US | #53 |
| 2015 | 52 581 502 969 $ US | #51 |
| 2014 | 87 108 795 076 $ US | #47 |
| 2013 | 91 381 274 046 $ US | #45 |
| 2012 | 91 747 467 851 $ US | #44 |
| 2011 | 89 503 237 238 $ US | #45 |
| 2010 | 65 502 334 498 $ US | #49 |
| 2009 | 48 243 335 560 $ US | #51 |
| 2008 | 76 257 078 322 $ US | #47 |
| 2007 | 51 704 450 816 $ US | #50 |
| 2006 | 41 291 961 259 $ US | #51 |
| 2005 | 30 386 570 590 $ US | #51 |
| 2004 | 22 654 791 782 $ US | #51 |
| 2003 | 14 928 755 904 $ US | #56 |
| 2002 | 11 576 895 509 $ US | #58 |
| 2001 | 10 166 980 822 $ US | #59 |
| 2000 | 10 353 710 625 $ US | #57 |
| 1999 | 7 163 702 505 $ US | #66 |
| 1998 | 6 716 763 896 $ US | #64 |
| 1997 | 7 739 646 727 $ US | #63 |
| 1996 | 7 418 919 357 $ US | #60 |
| 1995 | 7 940 652 378 $ US | #56 |
| 1994 | 7 876 550 644 $ US | #54 |
| 1993 | 8 871 031 904 $ US | #50 |
| 1992 | 18 440 081 612 $ US | #35 |
Les exportations de biens et services du Kazakhstan s'élèvent à 92,1 milliards de dollars (2024), contre 18,4 milliards de dollars en 1992. Le maximum a été de 93,7 milliards de dollars, en 2022. Elles se classent au 51e rang mondial, en baisse par rapport au 50e rang l'année précédente. Leur meilleur rang a été le 35e, occupé pour la dernière fois en 1992.
Les exportations de biens et services du Kazakhstan sont les 19es plus élevées de 44 pays situés en Asie. Les importations de biens et services du Kazakhstan s'élevaient à 80,3 milliards de dollars en 2025, au 53e rang mondial. Les exportations du Kazakhstan dépassent ses importations de 17,5 milliards de dollars, soit un excédent commercial (2024).
Exportations de biens du Kazakhstan par catégorie, 2025
Exportations de biens, 2025: 79,2 Md $US
En 2025, la première catégorie des exportations de biens du Kazakhstan était « pétrole, gaz, minerais et autres matières premières », avec 68,6 %, suivie de « métaux communs (fer, acier, cuivre, aluminium) », avec 13,0 %.
Destinations des exportations de biens du Kazakhstan : les 10 premières, 2025
| Rang | Pays | Exportations de biens | Part | |
|---|---|---|---|---|
| 1 |
 Italie |
15,6 Md $US | 19,7 % | |
| 2 |
 Chine |
15,2 Md $US | 19,2 % | |
| 3 |
 Russie |
8,25 Md $US | 10,4 % | vs Russie |
| 4 |
 Pays-Bas |
5,98 Md $US | 7,55 % | |
| 5 |
 Turquie |
3,90 Md $US | 4,92 % | vs Turquie |
| 6 |
 Ouzbékistan |
3,49 Md $US | 4,4 % | vs Ouzbékistan |
| 7 |
 France |
3,33 Md $US | 4,2 % | vs France |
| 8 |
 Roumanie |
2,63 Md $US | 3,32 % | |
| 9 |
 Grèce |
2,35 Md $US | 2,96 % | |
| 10 |
 Kirghizistan |
1,76 Md $US | 2,22 % | vs Kirghizistan |
| Autres partenaires et non précisés | 16,7 Md $US | 21,1 % |
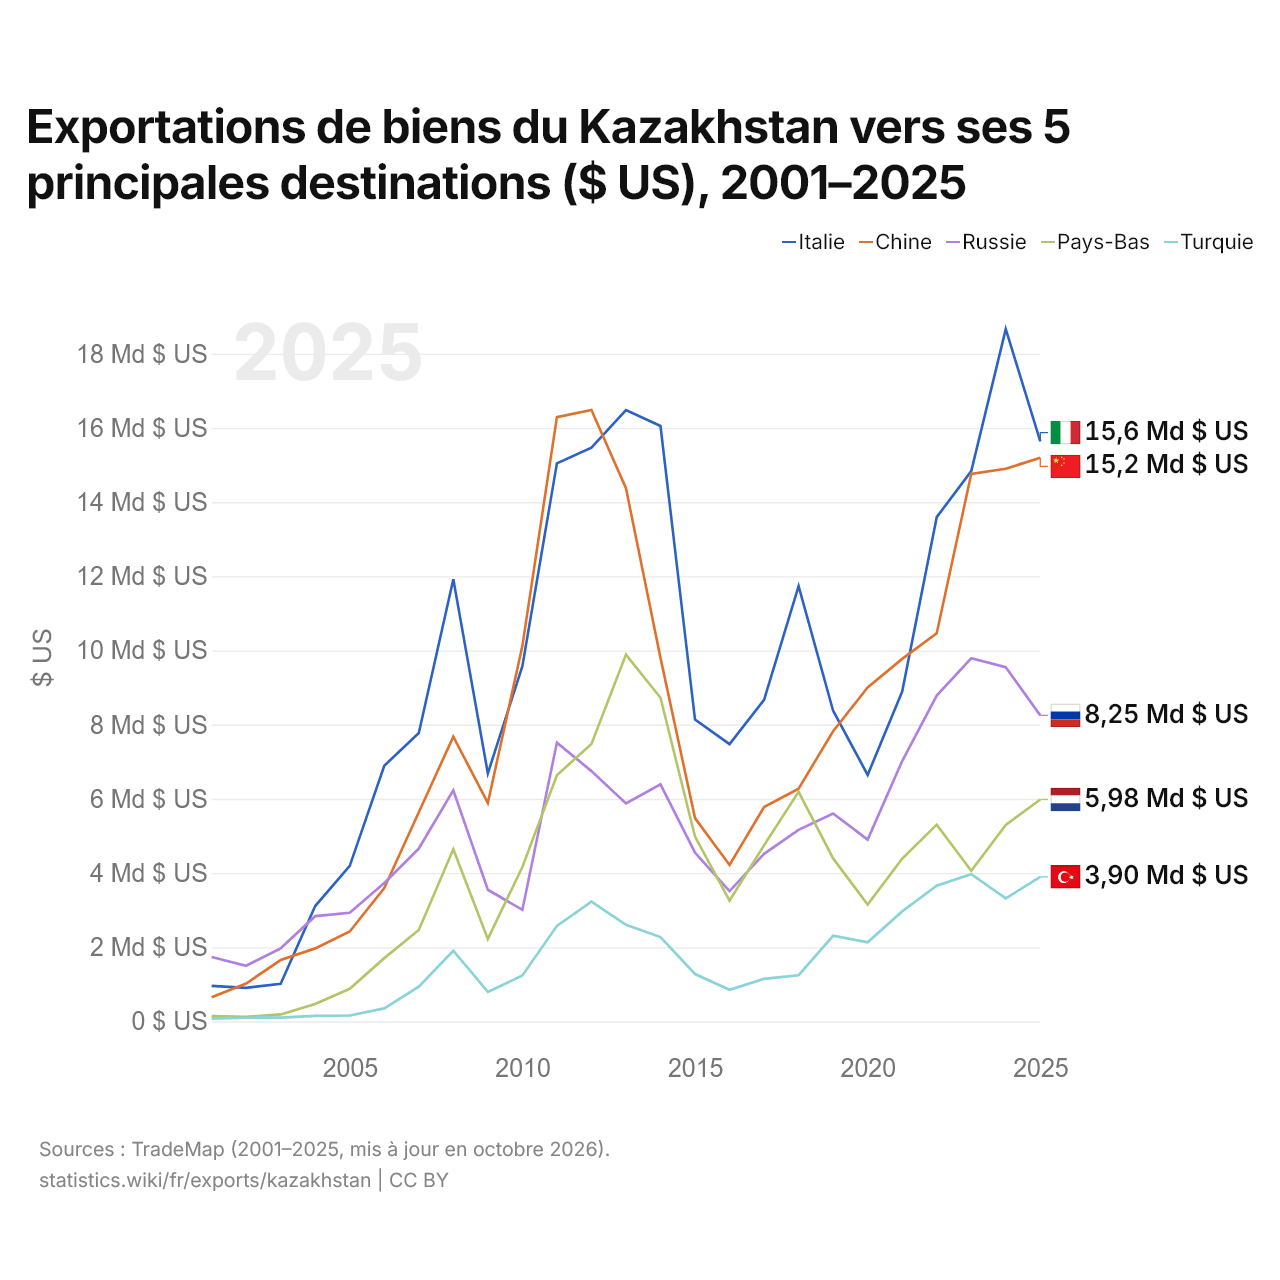
Exportations de biens du Kazakhstan vers ses 5 principales destinations ($ US), 2001–2025
| Année | $ US | ||||
|---|---|---|---|---|---|
| Italie | Chine | Russie | Pays-Bas | Turquie | |
| 2025 | 15 639 067 000 $ US | 15 196 008 000 $ US | 8 248 320 000 $ US | 5 981 853 000 $ US | 3 896 866 000 $ US |
| 2024 | 18 662 973 000 $ US | 14 897 477 000 $ US | 9 546 501 000 $ US | 5 295 627 000 $ US | 3 315 428 000 $ US |
| 2023 | 14 835 274 000 $ US | 14 758 685 000 $ US | 9 788 231 000 $ US | 4 057 549 000 $ US | 3 969 147 000 $ US |
| 2022 | 13 594 629 000 $ US | 10 461 771 000 $ US | 8 780 725 000 $ US | 5 304 152 000 $ US | 3 656 614 000 $ US |
| 2021 | 8 889 096 000 $ US | 9 772 506 000 $ US | 7 018 746 000 $ US | 4 384 191 000 $ US | 2 964 666 000 $ US |
| 2020 | 6 644 707 000 $ US | 9 004 007 000 $ US | 4 899 450 000 $ US | 3 148 592 000 $ US | 2 131 540 000 $ US |
| 2019 | 8 373 767 000 $ US | 7 823 406 000 $ US | 5 602 532 000 $ US | 4 393 199 000 $ US | 2 307 482 000 $ US |
| 2018 | 11 735 376 000 $ US | 6 272 925 000 $ US | 5 162 087 000 $ US | 6 189 723 000 $ US | 1 242 048 000 $ US |
| 2017 | 8 669 344 000 $ US | 5 777 685 000 $ US | 4 515 165 000 $ US | 4 748 206 000 $ US | 1 145 853 000 $ US |
| 2016 | 7 474 770 000 $ US | 4 214 926 000 $ US | 3 509 162 000 $ US | 3 255 796 000 $ US | 851 083 000 $ US |
| 2015 | 8 136 264 000 $ US | 5 480 138 000 $ US | 4 547 555 000 $ US | 4 980 964 000 $ US | 1 275 573 000 $ US |
| 2014 | 16 051 570 000 $ US | 9 799 418 000 $ US | 6 388 500 000 $ US | 8 724 188 000 $ US | 2 272 446 000 $ US |
| 2013 | 16 480 655 000 $ US | 14 373 748 000 $ US | 5 875 274 000 $ US | 9 888 286 000 $ US | 2 603 061 000 $ US |
| 2012 | 15 465 718 000 $ US | 16 484 409 000 $ US | 6 747 212 000 $ US | 7 479 433 000 $ US | 3 229 013 000 $ US |
| 2011 | 15 045 254 000 $ US | 16 291 513 000 $ US | 7 514 522 000 $ US | 6 637 107 000 $ US | 2 574 351 000 $ US |
| 2010 | 9 576 766 000 $ US | 10 122 070 000 $ US | 3 006 543 000 $ US | 4 160 972 000 $ US | 1 234 821 000 $ US |
| 2009 | 6 686 756 000 $ US | 5 888 593 000 $ US | 3 546 967 000 $ US | 2 222 452 000 $ US | 791 832 000 $ US |
| 2008 | 11 920 317 000 $ US | 7 676 609 000 $ US | 6 227 049 000 $ US | 4 638 669 000 $ US | 1 903 764 000 $ US |
| 2007 | 7 774 224 000 $ US | 5 635 914 000 $ US | 4 658 919 000 $ US | 2 464 262 000 $ US | 934 365 000 $ US |
| 2006 | 6 891 644 000 $ US | 3 592 514 000 $ US | 3 730 037 000 $ US | 1 704 555 000 $ US | 348 200 000 $ US |
| 2005 | 4 190 531 000 $ US | 2 422 507 000 $ US | 2 926 578 000 $ US | 877 836 000 $ US | 156 975 000 $ US |
| 2004 | 3 108 975 000 $ US | 1 966 911 000 $ US | 2 836 286 000 $ US | 464 600 000 $ US | 147 057 000 $ US |
| 2003 | 1 013 098 000 $ US | 1 653 081 000 $ US | 1 967 740 000 $ US | 186 141 000 $ US | 99 193 000 $ US |
| 2002 | 904 222 000 $ US | 1 018 680 000 $ US | 1 497 738 000 $ US | 123 553 000 $ US | 97 449 000 $ US |
| 2001 | 956 196 000 $ US | 646 651 000 $ US | 1 733 412 000 $ US | 141 327 000 $ US | 74 231 000 $ US |
En 2025, les exportations de biens s'élevaient à 15,6 milliards de dollars vers l'Italie, 15,2 milliards de dollars vers la Chine, 8,25 milliards de dollars vers la Russie, 5,98 milliards de dollars vers les Pays-Bas et 3,9 milliards de dollars vers la Turquie. Le premier rang des cinq destinations du Kazakhstan est occupé par l'Italie depuis 2022.
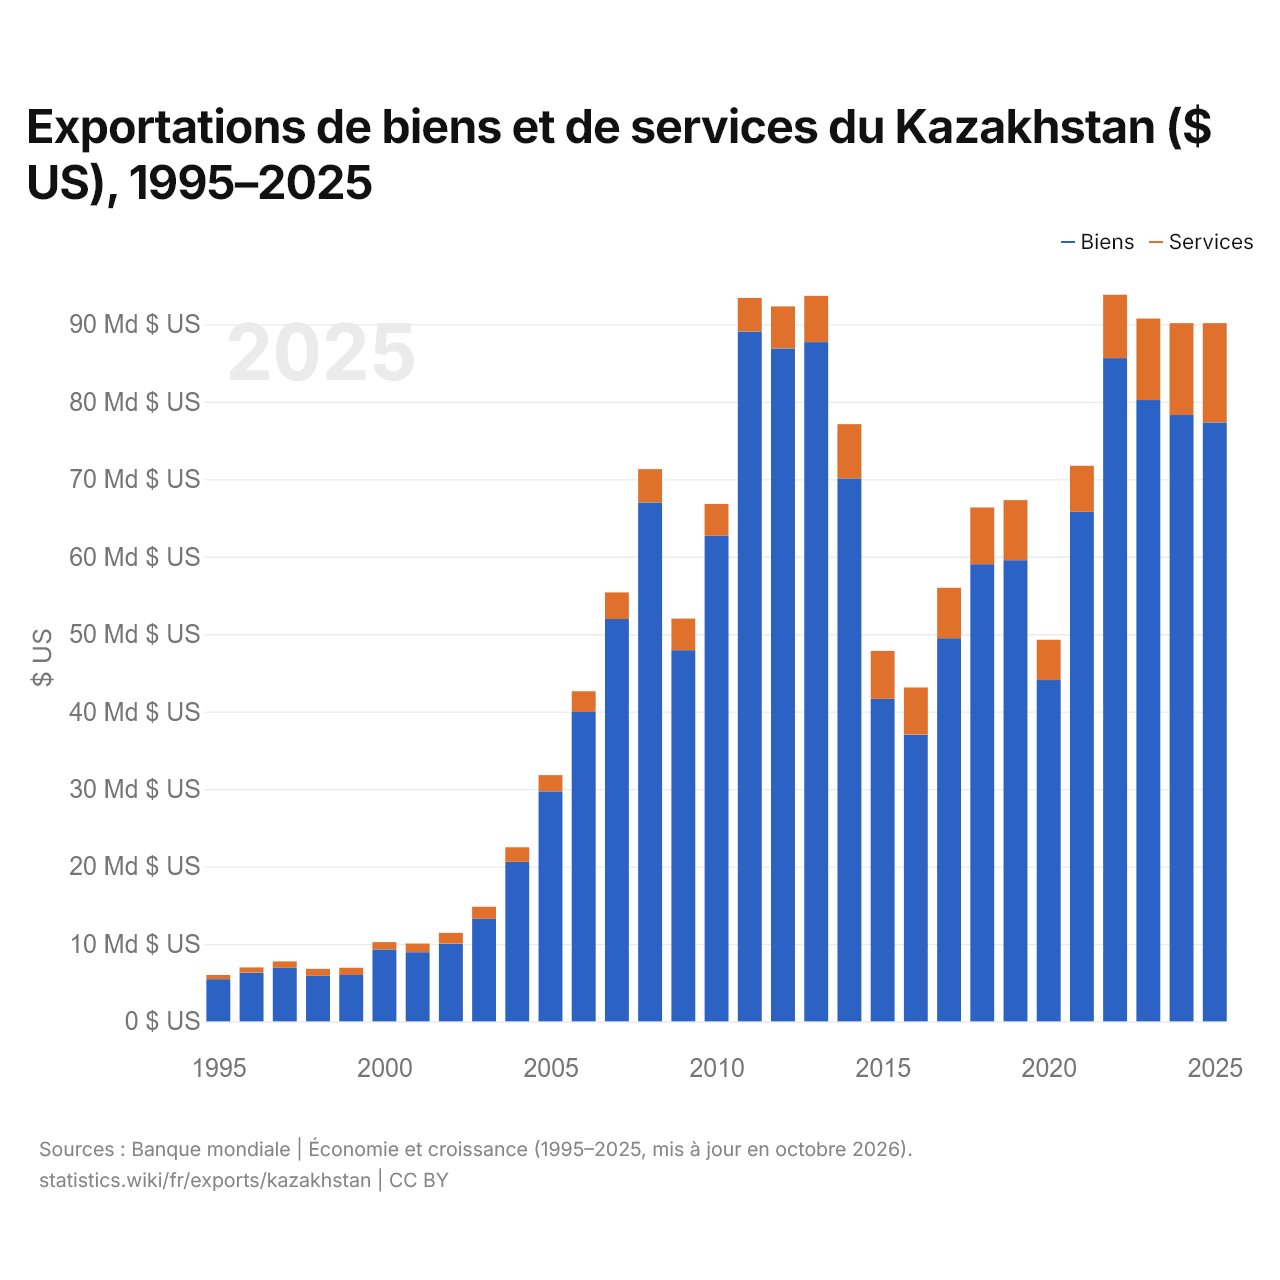
Exportations de biens et de services du Kazakhstan ($ US), 1995–2025
| Année | $ US | |
|---|---|---|
| Biens | Services | |
| 2025 | 77 325 397 162 $ US | 12 818 869 436 $ US |
| 2024 | 78 278 512 339 $ US | 11 866 667 809 $ US |
| 2023 | 80 216 223 882 $ US | 10 525 226 047 $ US |
| 2022 | 85 630 418 900 $ US | 8 191 286 634 $ US |
| 2021 | 65 790 637 963 $ US | 5 935 022 035 $ US |
| 2020 | 44 065 071 708 $ US | 5 208 279 295 $ US |
| 2019 | 59 541 448 681 $ US | 7 754 345 037 $ US |
| 2018 | 59 025 316 879 $ US | 7 319 913 578 $ US |
| 2017 | 49 469 468 607 $ US | 6 504 880 103 $ US |
| 2016 | 37 021 558 674 $ US | 6 084 529 823 $ US |
| 2015 | 41 647 392 523 $ US | 6 177 432 154 $ US |
| 2014 | 70 106 327 628 $ US | 7 002 484 343 $ US |
| 2013 | 87 699 198 139 $ US | 5 970 584 064 $ US |
| 2012 | 86 876 287 419 $ US | 5 430 908 296 $ US |
| 2011 | 89 062 790 048 $ US | 4 337 739 917 $ US |
| 2010 | 62 684 092 722 $ US | 4 118 964 033 $ US |
| 2009 | 47 909 872 863 $ US | 4 103 678 781 $ US |
| 2008 | 67 001 557 299 $ US | 4 292 415 769 $ US |
| 2007 | 51 953 709 284 $ US | 3 424 832 597 $ US |
| 2006 | 39 938 585 194 $ US | 2 676 890 786 $ US |
| 2005 | 29 693 647 519 $ US | 2 087 321 796 $ US |
| 2004 | 20 595 728 373 $ US | 1 874 103 679 $ US |
| 2003 | 13 223 380 776 $ US | 1 579 041 042 $ US |
| 2002 | 10 018 193 941 $ US | 1 406 633 407 $ US |
| 2001 | 8 922 759 340 $ US | 1 122 763 010 $ US |
| 2000 | 9 287 045 820 $ US | 939 070 919 $ US |
| 1999 | 5 988 700 000 $ US | 932 500 000 $ US |
| 1998 | 5 870 500 000 $ US | 904 300 000 $ US |
| 1997 | 6 899 300 000 $ US | 841 900 000 $ US |
| 1996 | 6 291 600 000 $ US | 674 400 000 $ US |
| 1995 | 5 440 000 000 $ US | 535 100 000 $ US |
En 2025, les exportations de biens du Kazakhstan s'élevaient à 77,3 milliards de dollars et celles de services à 12,8 milliards de dollars ; les services représentaient 14,2 % du total, contre 9,0 % en 1995.
Le Kazakhstan dans le classement mondial des exportations







Exportations de biens et services du Kazakhstan, % du PIB
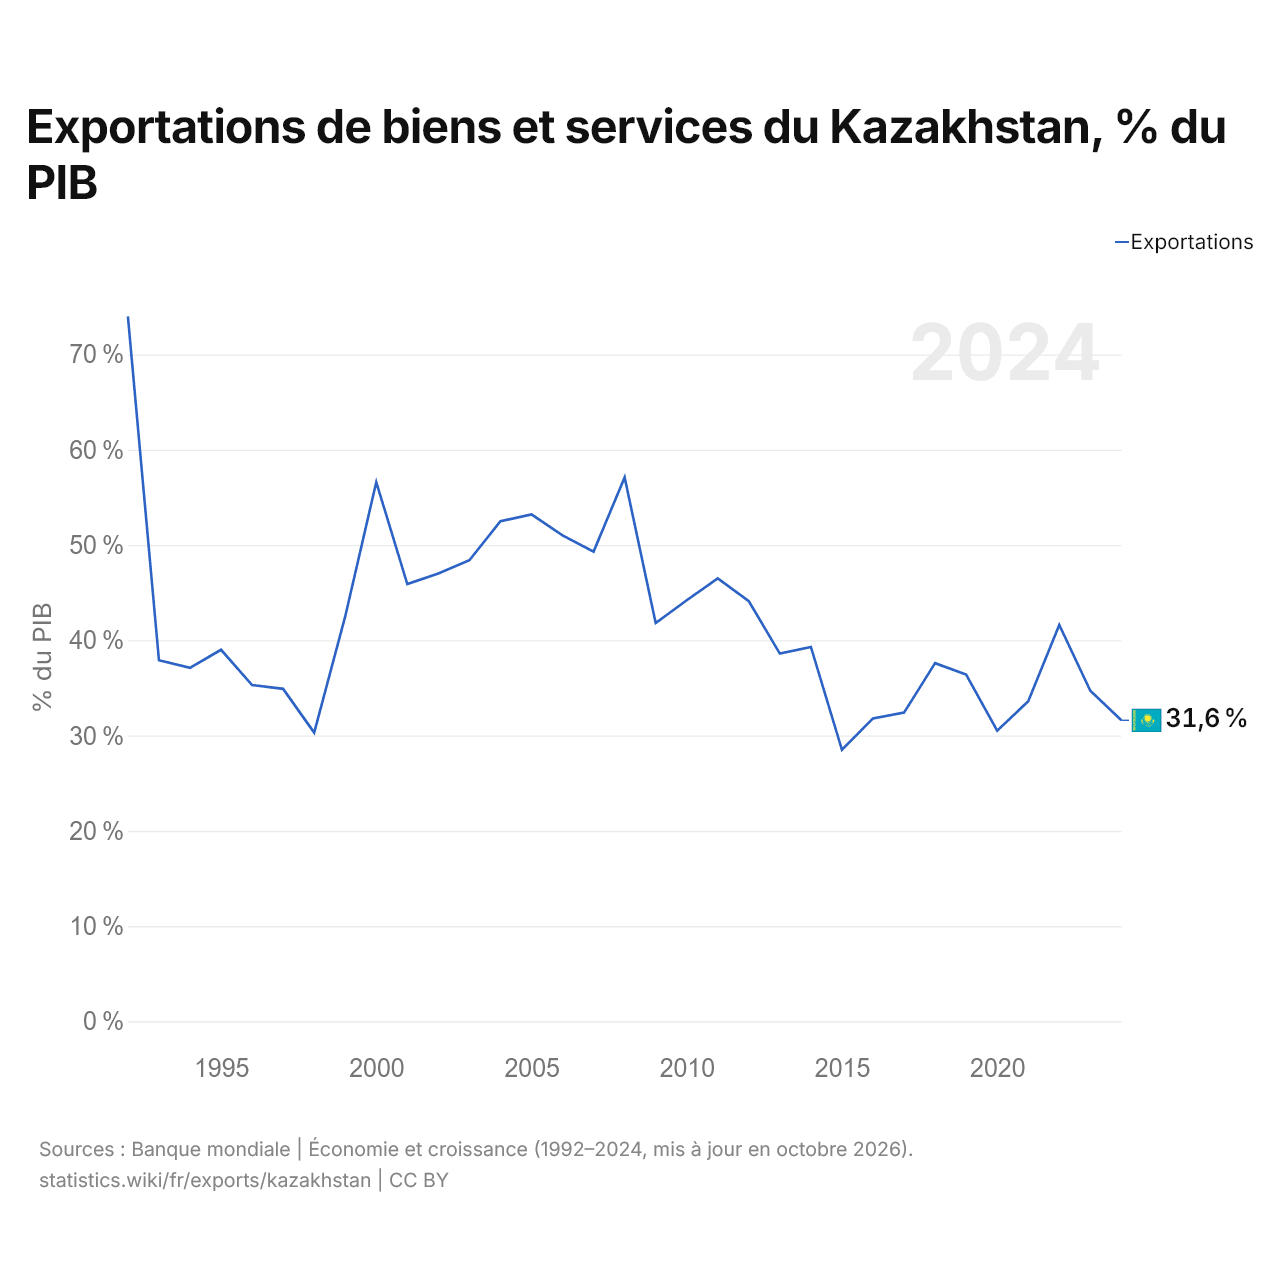
Les exportations de biens et services du Kazakhstan équivalent à 31,6 % de son PIB (2024), contre 74,0 % en 1992. La part la plus faible a été de 28,5 %, en 2015.
Comparer les exportations du Kazakhstan avec celles d'autres pays
Sources :
- TradeMap (2001–2025, mis à jour en octobre 2026)
- Banque mondiale | Économie et croissance (1992–2025, mis à jour en octobre 2026)
Creative Commons Attribution (CC BY) : vous pouvez copier, partager, adapter et réutiliser ce contenu, y compris à des fins commerciales, à condition de citer statistics.wiki et d’indiquer les modifications apportées. Les sources citées ci-dessus peuvent avoir leurs propres conditions de licence.