
Exportations de biens et services du Pérou par année ($ US), 1960–2025
| Année | $ US | Rang mondial |
|---|---|---|
| Exportations | Rang mondial | |
| 2025 | 100 355 362 281 $ US | #49 |
| 2024 | 84 269 317 213 $ US | #52 |
| 2023 | 72 822 828 839 $ US | #53 |
| 2022 | 70 945 282 635 $ US | #53 |
| 2021 | 66 169 160 383 $ US | #53 |
| 2020 | 46 347 277 393 $ US | #54 |
| 2019 | 54 892 296 037 $ US | #54 |
| 2018 | 56 077 049 768 $ US | #54 |
| 2017 | 52 160 903 521 $ US | #54 |
| 2016 | 43 369 573 655 $ US | #54 |
| 2015 | 40 403 976 964 $ US | #57 |
| 2014 | 45 391 688 188 $ US | #59 |
| 2013 | 49 908 231 211 $ US | #59 |
| 2012 | 52 881 688 028 $ US | #59 |
| 2011 | 52 392 070 005 $ US | #56 |
| 2010 | 41 051 280 917 $ US | #59 |
| 2009 | 31 948 077 817 $ US | #59 |
| 2008 | 35 836 836 529 $ US | #62 |
| 2007 | 32 206 455 737 $ US | #60 |
| 2006 | 27 068 649 606 $ US | #59 |
| 2005 | 20 421 330 421 $ US | #60 |
| 2004 | 15 298 201 418 $ US | #61 |
| 2003 | 11 167 509 772 $ US | #64 |
| 2002 | 9 462 717 116 $ US | #62 |
| 2001 | 8 637 724 124 $ US | #63 |
| 2000 | 8 676 752 916 $ US | #61 |
| 1999 | 7 727 286 157 $ US | #59 |
| 1998 | 7 605 311 668 $ US | #60 |
| 1997 | 8 418 168 168 $ US | #59 |
| 1996 | 7 357 698 733 $ US | #61 |
| 1995 | 6 717 350 829 $ US | #60 |
| 1994 | 5 732 107 084 $ US | #60 |
| 1993 | 4 336 828 767 $ US | #63 |
| 1992 | 4 500 645 313 $ US | #60 |
| 1991 | 4 190 478 468 $ US | #59 |
| 1990 | 4 145 689 007 $ US | #61 |
| 1989 | 2 549 118 176 $ US | #62 |
| 1988 | 2 331 272 000 $ US | #60 |
| 1987 | 4 672 236 797 $ US | #50 |
| 1986 | 3 594 264 205 $ US | #52 |
| 1985 | 3 942 344 117 $ US | #50 |
| 1984 | 3 839 792 319 $ US | #50 |
| 1983 | 3 770 030 204 $ US | #50 |
| 1982 | 4 101 399 615 $ US | #51 |
| 1981 | 4 018 299 007 $ US | #54 |
| 1980 | 4 628 615 890 $ US | #47 |
| 1979 | 4 308 384 769 $ US | #45 |
| 1978 | 2 521 221 600 $ US | #48 |
| 1977 | 2 250 793 523 $ US | #47 |
| 1976 | 1 892 130 904 $ US | #48 |
| 1975 | 1 788 374 611 $ US | #48 |
| 1974 | 1 956 022 867 $ US | #46 |
| 1973 | 1 465 079 294 $ US | #46 |
| 1972 | 1 263 534 016 $ US | #43 |
| 1971 | 1 147 257 884 $ US | #43 |
| 1970 | 1 294 540 906 $ US | #38 |
| 1969 | 1 121 418 743 $ US | - |
| 1968 | 1 038 733 473 $ US | - |
| 1967 | 955 400 397 $ US | - |
| 1966 | 950 758 983 $ US | - |
| 1965 | 809 077 281 $ US | - |
| 1964 | 805 981 794 $ US | - |
| 1963 | 663 776 046 $ US | - |
| 1962 | 655 757 632 $ US | - |
| 1961 | 602 985 560 $ US | - |
| 1960 | 519 816 793 $ US | - |
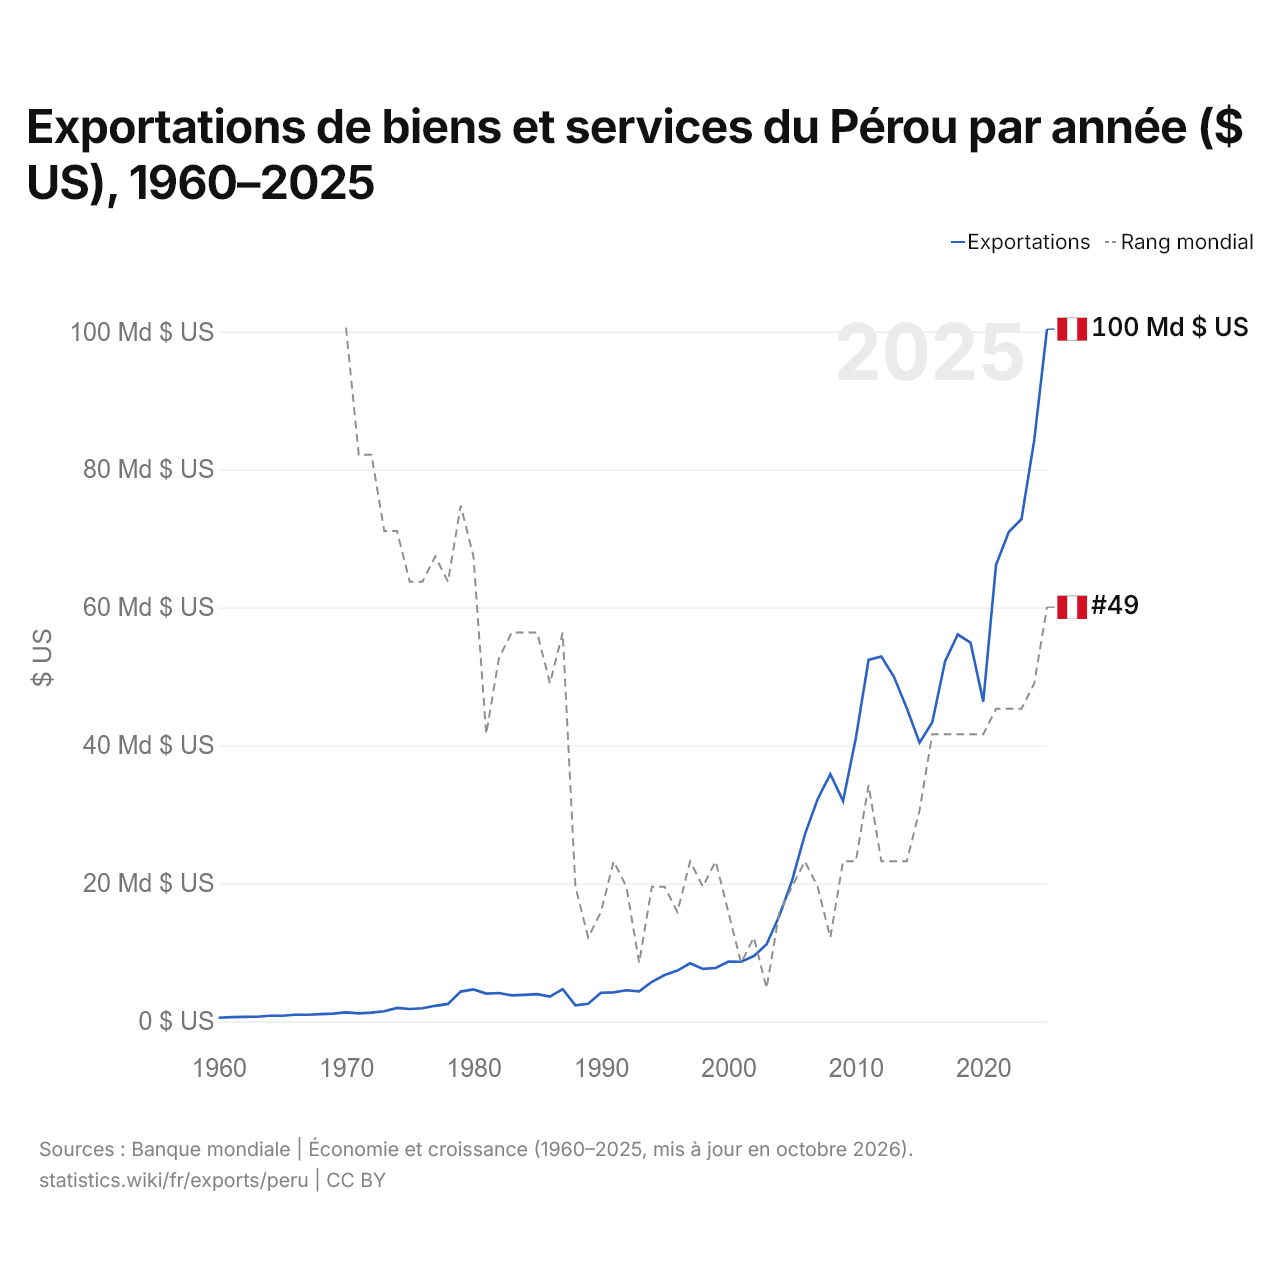
En 2025, les exportations de biens et services du Pérou s'élevaient à 100 milliards de dollars, contre 520 millions de dollars en 1960. Elles se classaient au 49e rang mondial, en hausse par rapport au 52e rang en 2024. Leur meilleur rang a été le 38e, occupé pour la dernière fois en 1970.
En 2025, les exportations de biens et services du Pérou étaient les 5es plus élevées de 27 pays situés en Amérique latine. Les importations de biens et services du Pérou s'élevaient à 73,2 milliards de dollars en 2025, au 55e rang mondial. En 2025, les exportations du Pérou dépassaient ses importations de 27,2 milliards de dollars, soit un excédent commercial.
Exportations de biens du Pérou par catégorie, 2025
Exportations de biens, 2025: 90,1 Md $US
En 2025, la première catégorie des exportations de biens du Pérou était « pétrole, gaz, minerais et autres matières premières », avec 45,9 %, suivie de « métaux précieux, pierres précieuses, bijoux, montres, instruments de musique et art », avec 20,5 %.
Destinations des exportations de biens du Pérou : les 10 premières, 2025
| Rang | Pays | Exportations de biens | Part | |
|---|---|---|---|---|
| 1 |
 Chine |
32,6 Md $US | 36,2 % | |
| 2 |
 États-Unis |
10,2 Md $US | 11,3 % | |
| 3 |
 Inde |
6,53 Md $US | 7,25 % | |
| 4 |
 Canada |
5,02 Md $US | 5,57 % | vs Canada |
| 5 |
 Japon |
3,21 Md $US | 3,56 % | |
| 6 |
 EAU |
2,89 Md $US | 3,2 % | |
| 7 |
 Espagne |
2,82 Md $US | 3,13 % | |
| 8 |
 Pays-Bas |
2,72 Md $US | 3,02 % | |
| 9 |
 Suisse |
2,60 Md $US | 2,89 % | |
| 10 |
 Chili |
2,30 Md $US | 2,55 % | vs Chili |
| Autres partenaires et non précisés | 19,2 Md $US | 21,3 % |
Exportations de biens du Pérou vers ses 5 principales destinations ($ US), 2001–2025
| Année | $ US | ||||
|---|---|---|---|---|---|
| Chine | États-Unis | Inde | Canada | Japon | |
| 2025 | 32 627 667 000 $ US | 10 200 416 000 $ US | 6 527 923 000 $ US | 5 015 615 000 $ US | 3 210 203 000 $ US |
| 2024 | 25 224 297 000 $ US | 9 554 345 000 $ US | 4 717 114 000 $ US | 3 806 834 000 $ US | 3 334 242 000 $ US |
| 2023 | 23 098 362 000 $ US | 9 229 714 000 $ US | 2 531 110 000 $ US | 3 042 023 000 $ US | 2 314 781 000 $ US |
| 2022 | 21 040 988 000 $ US | 8 655 783 000 $ US | 2 302 484 000 $ US | 2 684 439 000 $ US | 3 157 827 000 $ US |
| 2021 | 17 994 761 000 $ US | 7 192 891 000 $ US | 2 509 157 000 $ US | 2 740 341 000 $ US | 2 780 239 000 $ US |
| 2020 | 10 963 064 000 $ US | 6 240 574 000 $ US | 1 100 148 000 $ US | 2 394 013 000 $ US | 1 724 174 000 $ US |
| 2019 | 13 159 187 000 $ US | 5 551 812 000 $ US | 1 786 341 000 $ US | 2 401 960 000 $ US | 1 929 320 000 $ US |
| 2018 | 13 167 721 000 $ US | 7 837 624 000 $ US | 2 470 853 000 $ US | 917 379 000 $ US | 2 177 050 000 $ US |
| 2017 | 11 626 233 000 $ US | 6 935 897 000 $ US | 1 964 212 000 $ US | 1 202 168 000 $ US | 1 880 078 000 $ US |
| 2016 | 8 483 938 000 $ US | 6 235 293 000 $ US | 929 917 000 $ US | 1 683 746 000 $ US | 1 262 586 000 $ US |
| 2015 | 7 332 901 000 $ US | 5 020 220 000 $ US | 676 289 000 $ US | 2 305 901 000 $ US | 1 118 559 000 $ US |
| 2014 | 7 042 587 000 $ US | 6 253 910 000 $ US | 321 253 000 $ US | 2 566 309 000 $ US | 1 583 984 000 $ US |
| 2013 | 7 432 842 000 $ US | 9 209 547 000 $ US | 594 991 000 $ US | 2 775 798 000 $ US | 2 303 102 000 $ US |
| 2012 | 8 011 106 000 $ US | 8 205 655 000 $ US | 387 957 000 $ US | 3 483 973 000 $ US | 2 638 638 000 $ US |
| 2011 | 6 972 639 000 $ US | 6 272 046 000 $ US | 248 183 000 $ US | 4 232 469 000 $ US | 2 174 663 000 $ US |
| 2010 | 5 538 656 000 $ US | 7 030 970 000 $ US | 219 417 000 $ US | 3 346 413 000 $ US | 1 843 920 000 $ US |
| 2009 | 4 077 957 000 $ US | 4 603 773 000 $ US | 108 017 000 $ US | 2 310 897 000 $ US | 1 376 462 000 $ US |
| 2008 | 3 734 995 000 $ US | 5 835 264 000 $ US | 281 407 000 $ US | 1 949 884 000 $ US | 1 860 025 000 $ US |
| 2007 | 3 040 489 000 $ US | 5 585 918 000 $ US | 211 224 000 $ US | 1 840 800 000 $ US | 2 180 551 000 $ US |
| 2006 | 2 268 655 000 $ US | 5 707 487 000 $ US | 102 280 000 $ US | 1 611 607 000 $ US | 1 230 787 000 $ US |
| 2005 | 1 860 865 000 $ US | 5 257 260 000 $ US | 79 031 000 $ US | 1 021 810 000 $ US | 604 498 000 $ US |
| 2004 | 1 244 699 000 $ US | 3 730 489 000 $ US | 49 862 000 $ US | 326 179 000 $ US | 554 160 000 $ US |
| 2003 | 676 972 000 $ US | 2 434 506 000 $ US | 19 026 000 $ US | 136 394 000 $ US | 391 170 000 $ US |
| 2002 | 597 625 000 $ US | 1 998 085 000 $ US | 21 682 000 $ US | 140 088 000 $ US | 374 296 000 $ US |
| 2001 | 426 253 000 $ US | 1 693 609 000 $ US | 36 460 000 $ US | 143 138 000 $ US | 383 017 000 $ US |
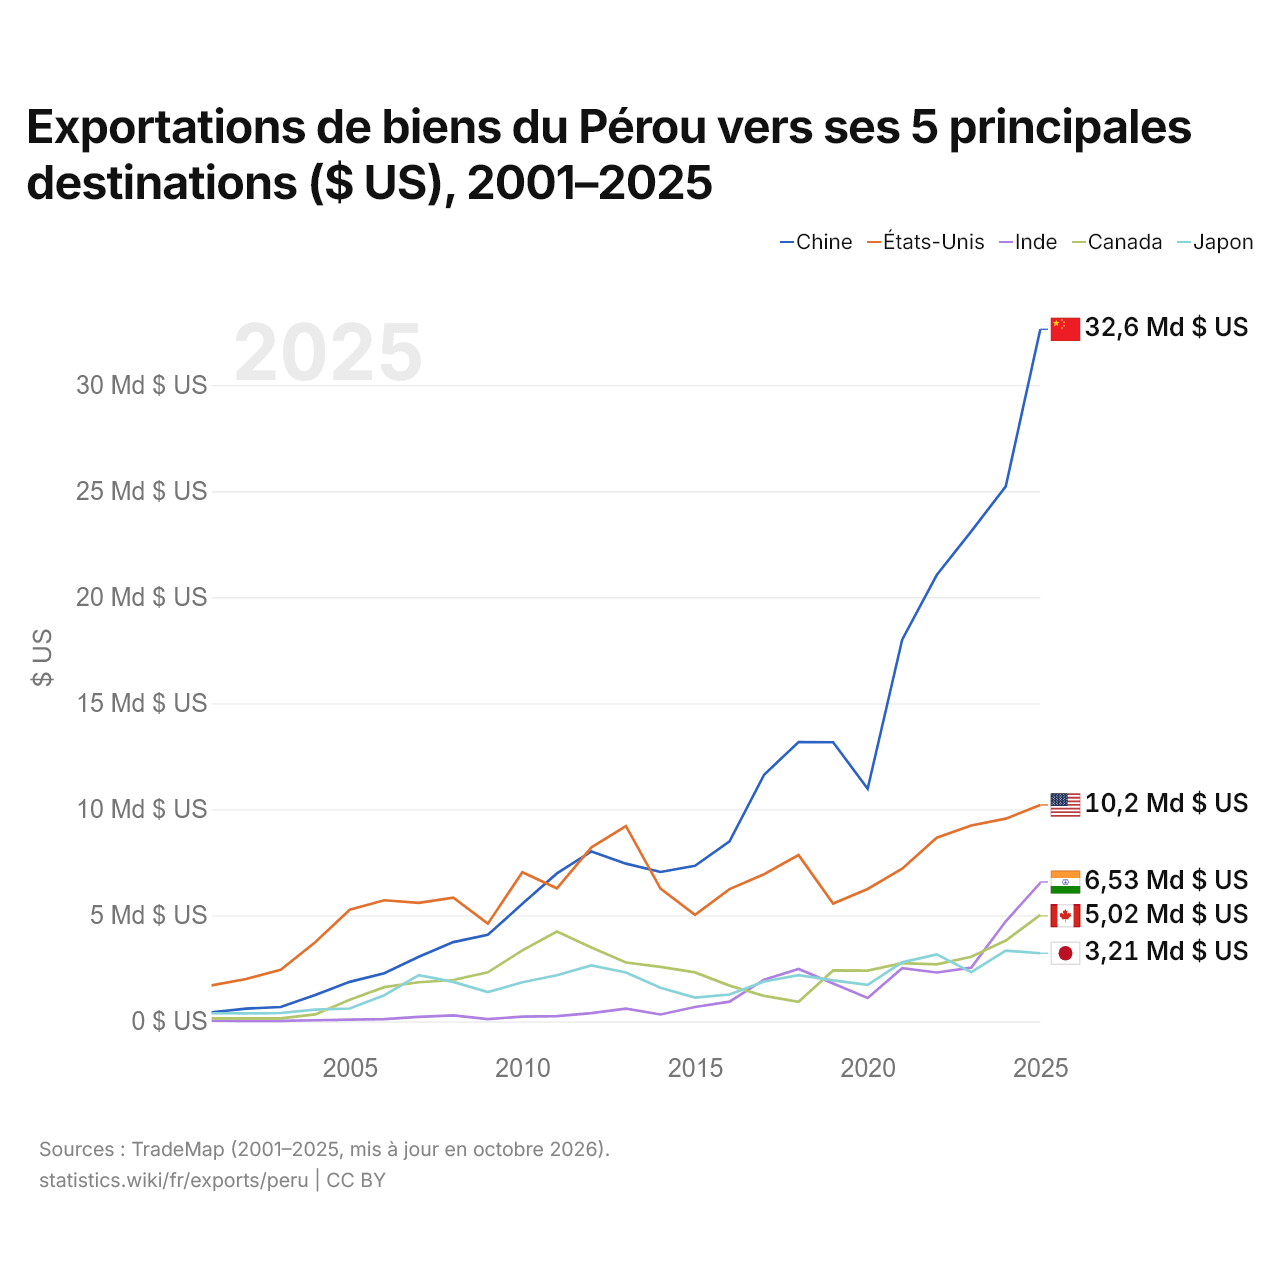
En 2025, les exportations de biens s'élevaient à 32,6 milliards de dollars vers la Chine, 10,2 milliards de dollars vers les États-Unis, 6,53 milliards de dollars vers l'Inde, 5,02 milliards de dollars vers le Canada et 3,21 milliards de dollars vers le Japon. Le premier rang des cinq destinations du Pérou est occupé par la Chine depuis 2014. Le changement le plus récent dans leur ordre remonte à 2024, quand les exportations du Pérou vers l'Inde ont dépassé celles vers le Canada.
Exportations de biens et de services du Pérou ($ US), 1977–2025
| Année | $ US | |
|---|---|---|
| Biens | Services | |
| 2025 | 93 992 953 468 $ US | 7 642 959 672 $ US |
| 2024 | 76 357 067 736 $ US | 7 020 790 570 $ US |
| 2023 | 66 962 715 471 $ US | 5 748 397 882 $ US |
| 2022 | 66 339 229 808 $ US | 4 952 171 384 $ US |
| 2021 | 63 113 900 674 $ US | 2 859 781 190 $ US |
| 2020 | 42 821 587 914 $ US | 2 639 235 709 $ US |
| 2019 | 47 995 151 542 $ US | 6 647 895 328 $ US |
| 2018 | 49 072 600 156 $ US | 6 300 014 583 $ US |
| 2017 | 45 404 522 297 $ US | 6 063 110 288 $ US |
| 2016 | 37 088 387 742 $ US | 5 789 560 274 $ US |
| 2015 | 34 414 042 399 $ US | 5 693 685 728 $ US |
| 2014 | 39 535 684 732 $ US | 5 466 909 837 $ US |
| 2013 | 42 863 351 015 $ US | 5 422 692 159 $ US |
| 2012 | 47 411 493 296 $ US | 4 575 562 098 $ US |
| 2011 | 46 375 961 554 $ US | 3 565 292 290 $ US |
| 2010 | 35 803 080 814 $ US | 3 273 041 456 $ US |
| 2009 | 26 961 518 361 $ US | 3 439 083 419 $ US |
| 2008 | 31 018 398 880 $ US | 3 288 280 884 $ US |
| 2007 | 28 093 427 370 $ US | 2 830 558 818 $ US |
| 2006 | 23 829 967 431 $ US | 2 295 403 765 $ US |
| 2005 | 17 365 592 658 $ US | 2 015 796 223 $ US |
| 2004 | 12 806 738 902 $ US | 1 782 047 435 $ US |
| 2003 | 9 088 992 652 $ US | 1 529 776 309 $ US |
| 2002 | 7 710 436 855 $ US | 1 193 550 466 $ US |
| 2001 | 7 025 289 679 $ US | 1 131 296 790 $ US |
| 2000 | 6 953 859 190 $ US | 1 251 101 690 $ US |
| 1999 | 6 086 305 605 $ US | 1 370 056 702 $ US |
| 1998 | 5 755 474 271 $ US | 1 455 944 553 $ US |
| 1997 | 6 823 338 177 $ US | 1 300 868 232 $ US |
| 1996 | 5 876 889 778 $ US | 1 242 663 605 $ US |
| 1995 | 5 490 435 105 $ US | 832 622 585 $ US |
| 1994 | 4 422 655 563 $ US | 880 738 713 $ US |
| 1993 | 3 383 977 473 $ US | 654 553 440 $ US |
| 1992 | 3 662 000 000 $ US | 744 000 000 $ US |
| 1991 | 3 408 000 000 $ US | 795 000 000 $ US |
| 1990 | 3 321 000 000 $ US | 771 000 000 $ US |
| 1989 | 3 532 600 000 $ US | 835 940 000 $ US |
| 1988 | 2 731 470 000 $ US | 831 250 000 $ US |
| 1987 | 2 714 780 000 $ US | 792 940 000 $ US |
| 1986 | 2 576 060 000 $ US | 680 920 000 $ US |
| 1985 | 3 049 000 000 $ US | 695 000 000 $ US |
| 1984 | 3 146 900 000 $ US | 670 100 000 $ US |
| 1983 | 3 015 000 000 $ US | 711 000 000 $ US |
| 1982 | 3 293 000 000 $ US | 784 000 000 $ US |
| 1981 | 3 249 000 000 $ US | 770 000 000 $ US |
| 1980 | 3 916 000 000 $ US | 714 600 000 $ US |
| 1979 | 3 490 900 000 $ US | 593 700 000 $ US |
| 1978 | 1 940 600 000 $ US | 459 100 000 $ US |
| 1977 | 1 725 600 000 $ US | 405 700 000 $ US |
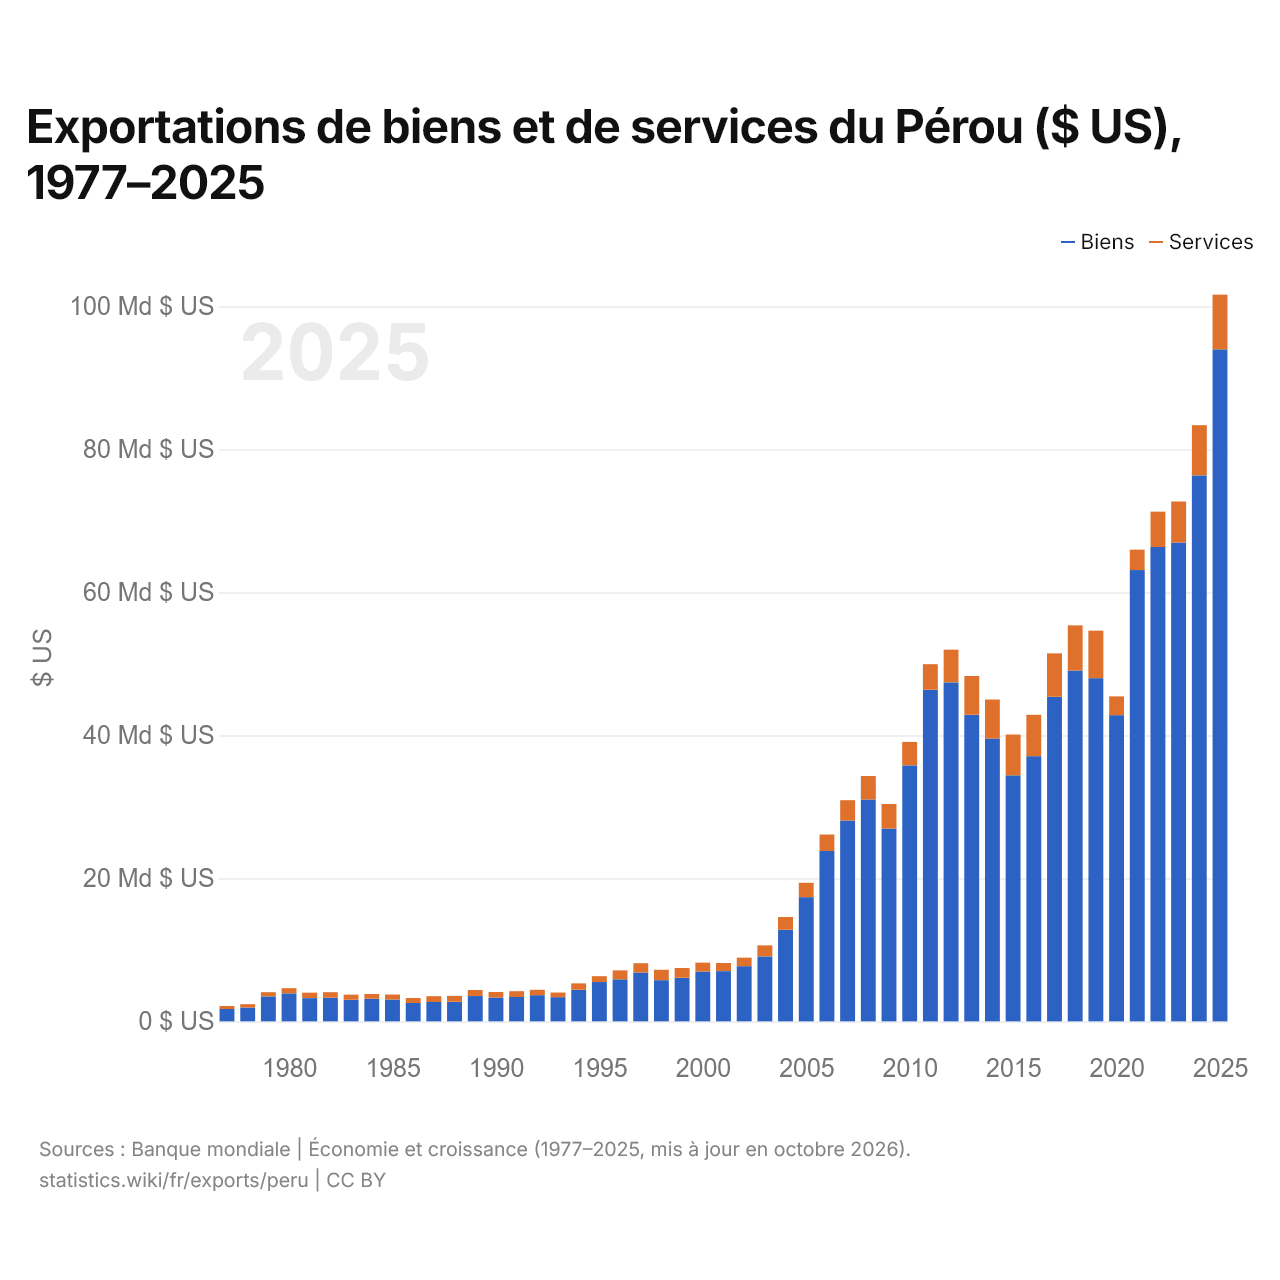
En 2025, les exportations de biens du Pérou s'élevaient à 94 milliards de dollars et celles de services à 7,64 milliards de dollars ; les services représentaient 7,5 % du total, contre 19,0 % en 1977.
Le Pérou dans le classement mondial des exportations, 2025
| Rang | Pays | Exportations | Part mondiale | |
|---|---|---|---|---|
| 46 |
 Grèce |
111 Md $US | 0,32 % | |
| 47 |
 Argentine |
106 Md $US | 0,3 % | vs Argentine |
| 48 |
 Irak |
103 Md $US | 0,29 % | |
| 49 |
 Pérou |
100 Md $US | 0,29 % | |
| 50 |
 Iran |
93,4 Md $US | 0,27 % | |
| 51 |
 Kazakhstan |
92,1 Md $US (2024) | 0,28 % | |
| 52 |
 Koweït |
83,4 Md $US | 0,24 % |
Exportations de biens et services du Pérou, % du PIB, 1960–2025
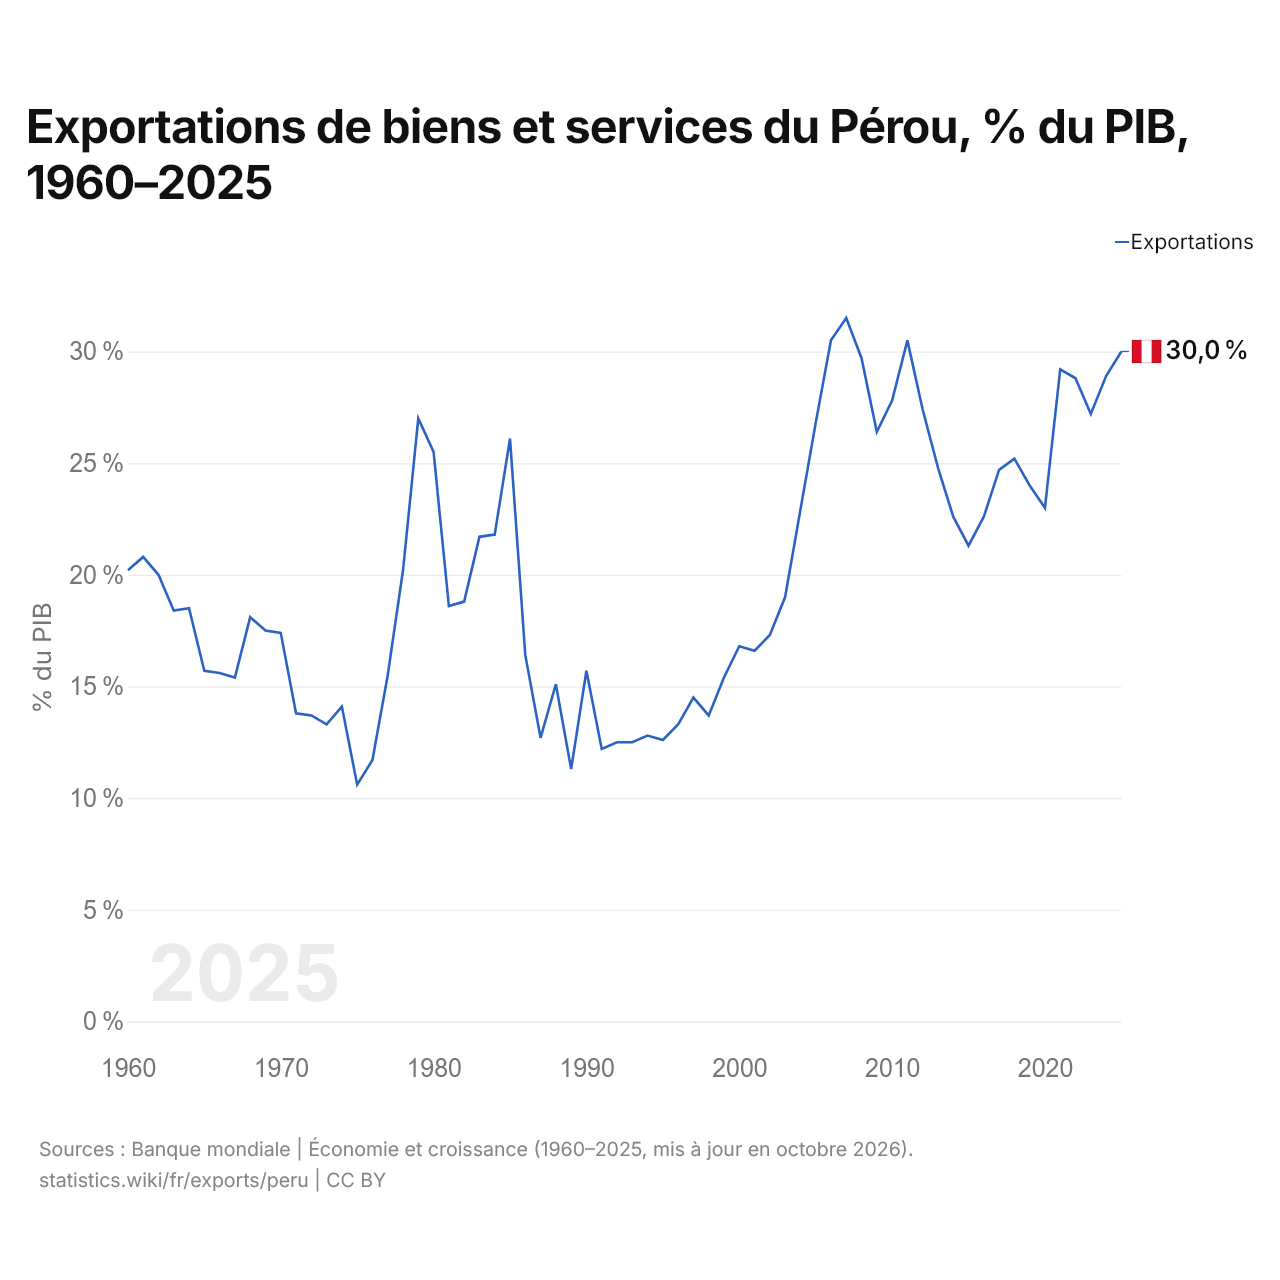
En 2025, les exportations de biens et services du Pérou équivalaient à 30,0 % de son PIB, contre 20,2 % en 1960. La part la plus élevée a été de 31,5 %, en 2007.
Comparer les exportations du Pérou avec celles d'autres pays
Sources :
- Banque mondiale | Économie et croissance (1960–2025, mis à jour en octobre 2026)
- TradeMap (2001–2025, mis à jour en octobre 2026)
Creative Commons Attribution (CC BY) : vous pouvez copier, partager, adapter et réutiliser ce contenu, y compris à des fins commerciales, à condition de citer statistics.wiki et d’indiquer les modifications apportées. Les sources citées ci-dessus peuvent avoir leurs propres conditions de licence.