
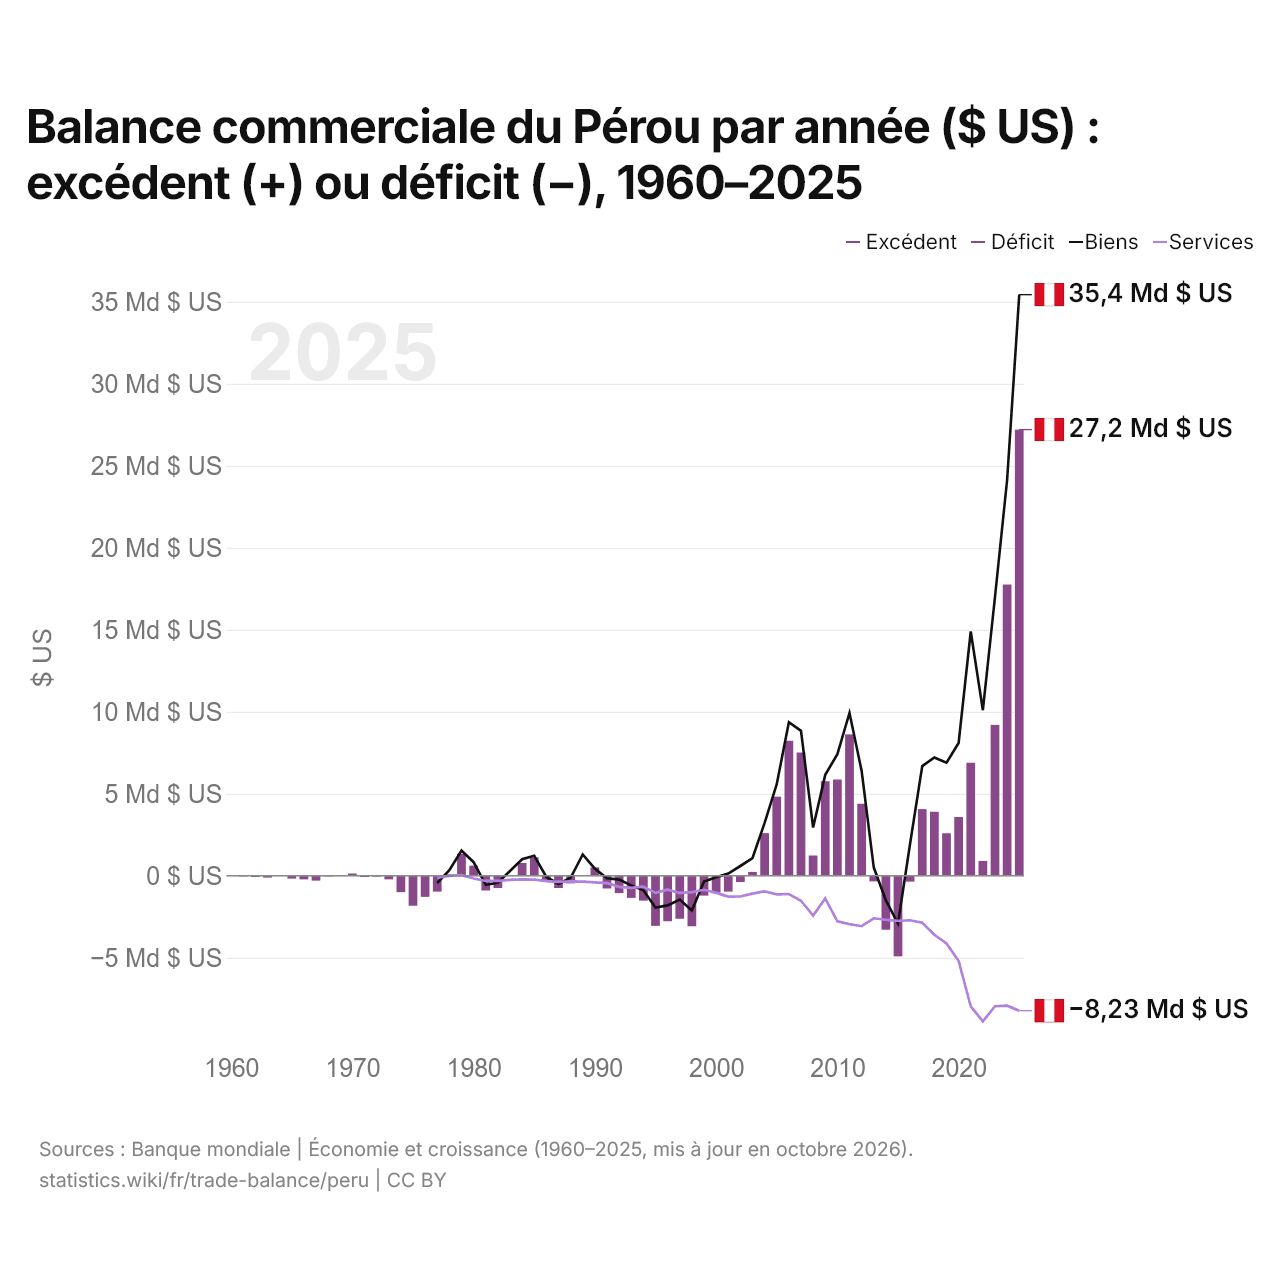
Balance commerciale du Pérou par année ($ US) : excédent (+) ou déficit (−), 1960–2025
| Année | $ US | ||
|---|---|---|---|
| Biens et services | Biens | Services | |
| 2025 | 27 204 165 667 $ US | 35 432 608 834 $ US | −8 230 461 343 $ US |
| 2024 | 17 758 098 060 $ US | 24 144 395 676 $ US | −7 921 865 366 $ US |
| 2023 | 9 202 083 644 $ US | 17 005 048 135 $ US | −7 957 101 704 $ US |
| 2022 | 902 434 592 $ US | 10 094 105 982 $ US | −8 877 095 715 $ US |
| 2021 | 6 890 510 994 $ US | 14 893 558 878 $ US | −7 971 349 737 $ US |
| 2020 | 3 578 887 312 $ US | 8 097 587 956 $ US | −5 192 988 126 $ US |
| 2019 | 2 590 972 472 $ US | 6 892 824 384 $ US | −4 124 343 147 $ US |
| 2018 | 3 901 901 142 $ US | 7 215 378 006 $ US | −3 599 989 166 $ US |
| 2017 | 4 064 422 258 $ US | 6 685 966 342 $ US | −2 861 628 520 $ US |
| 2016 | −361 178 550 $ US | 1 962 371 619 $ US | −2 715 103 366 $ US |
| 2015 | −4 912 325 216 $ US | −2 912 416 538 $ US | −2 754 696 182 $ US |
| 2014 | −3 291 248 744 $ US | −1 502 123 779 $ US | −2 682 588 696 $ US |
| 2013 | −343 092 025 $ US | 512 536 801 $ US | −2 592 291 524 $ US |
| 2012 | 4 391 136 441 $ US | 6 396 967 919 $ US | −3 077 341 941 $ US |
| 2011 | 8 617 697 251 $ US | 9 927 184 749 $ US | −2 947 137 176 $ US |
| 2010 | 5 870 890 669 $ US | 7 411 809 586 $ US | −2 777 029 243 $ US |
| 2009 | 5 765 885 399 $ US | 6 153 434 290 $ US | −1 378 599 900 $ US |
| 2008 | 1 231 415 975 $ US | 2 940 237 548 $ US | −2 426 552 073 $ US |
| 2007 | 7 515 819 751 $ US | 8 835 480 795 $ US | −1 523 967 941 $ US |
| 2006 | 8 233 372 015 $ US | 9 361 853 919 $ US | −1 112 991 583 $ US |
| 2005 | 4 822 398 156 $ US | 5 583 408 147 $ US | −1 131 599 192 $ US |
| 2004 | 2 596 227 078 $ US | 3 224 228 236 $ US | −951 667 577 $ US |
| 2003 | 237 698 321 $ US | 1 078 183 018 $ US | −1 092 247 435 $ US |
| 2002 | −383 204 935 $ US | 593 465 059 $ US | −1 266 142 298 $ US |
| 2001 | −968 615 490 $ US | 131 735 565 $ US | −1 273 226 991 $ US |
| 2000 | −1 035 559 758 $ US | −93 018 239 $ US | −1 044 493 113 $ US |
| 1999 | −1 210 518 540 $ US | −354 258 043 $ US | −856 364 529 $ US |
| 1998 | −3 078 787 465 $ US | −2 121 700 137 $ US | −997 351 523 $ US |
| 1997 | −2 625 375 375 $ US | −1 448 453 286 $ US | −1 048 898 053 $ US |
| 1996 | −2 774 314 468 $ US | −1 805 453 062 $ US | −851 962 657 $ US |
| 1995 | −3 053 462 186 $ US | −1 932 376 966 $ US | −1 042 343 174 $ US |
| 1994 | −1 517 027 864 $ US | −884 721 633 $ US | −660 632 336 $ US |
| 1993 | −1 346 342 115 $ US | −587 547 391 $ US | −738 132 623 $ US |
| 1992 | −1 061 106 846 $ US | −238 000 000 $ US | −676 000 000 $ US |
| 1991 | −774 221 751 $ US | −154 000 000 $ US | −447 000 000 $ US |
| 1990 | 508 322 309 $ US | 432 000 000 $ US | −399 000 000 $ US |
| 1989 | 27 564 710 $ US | 1 299 410 000 $ US | −360 460 000 $ US |
| 1988 | −466 704 000 $ US | −122 600 000 $ US | −343 860 000 $ US |
| 1987 | −745 196 258 $ US | −500 300 000 $ US | −370 730 000 $ US |
| 1986 | −356 551 353 $ US | −73 230 000 $ US | −331 600 000 $ US |
| 1985 | 1 117 545 718 $ US | 1 219 000 000 $ US | −239 000 000 $ US |
| 1984 | 781 976 936 $ US | 1 006 900 000 $ US | −220 800 000 $ US |
| 1983 | 40 524 755 $ US | 293 000 000 $ US | −254 000 000 $ US |
| 1982 | −748 315 484 $ US | −428 000 000 $ US | −314 000 000 $ US |
| 1981 | −899 795 888 $ US | −553 000 000 $ US | −317 000 000 $ US |
| 1980 | 616 225 601 $ US | 826 000 000 $ US | −165 100 000 $ US |
| 1979 | 1 343 792 281 $ US | 1 539 600 000 $ US | 33 800 000 $ US |
| 1978 | 81 804 651 $ US | 340 100 000 $ US | −10 500 000 $ US |
| 1977 | −966 402 847 $ US | −438 400 000 $ US | −117 500 000 $ US |
| 1976 | −1 284 218 466 $ US | - | - |
| 1975 | −1 828 097 677 $ US | - | - |
| 1974 | −1 002 633 464 $ US | - | - |
| 1973 | −222 259 287 $ US | - | - |
| 1972 | −59 463 419 $ US | - | - |
| 1971 | −77 548 357 $ US | - | - |
| 1970 | 136 918 187 $ US | - | - |
| 1969 | 41 315 403 $ US | - | - |
| 1968 | −43 953 905 $ US | - | - |
| 1967 | −294 255 206 $ US | - | - |
| 1966 | −220 009 086 $ US | - | - |
| 1965 | −171 534 175 $ US | - | - |
| 1964 | −12 485 258 $ US | - | - |
| 1963 | −112 706 863 $ US | - | - |
| 1962 | −65 477 167 $ US | - | - |
| 1961 | −40 342 816 $ US | - | - |
| 1960 | −1 540 208 $ US | - | - |
En 2025, la balance commerciale du Pérou affichait un excédent de 27,2 milliards de dollars, contre un déficit de 1,54 million de dollars en 1960. Le plus grand déficit a été de 4,91 milliards de dollars, en 2015. La balance commerciale du Pérou est excédentaire chaque année depuis 2017. Le commerce de biens affichait un excédent de 35,4 milliards de dollars et celui de services un déficit de 8,23 milliards de dollars.
En 2025, l'excédent commercial du Pérou était le plus élevé de 26 pays situés en Amérique latine, devant le Chili (excédent de 14,8 milliards de dollars). De 2016 à 2025, les soldes commerciaux du Pérou ont totalisé un excédent de 75,7 milliards de dollars, contre un excédent de 33,1 milliards de dollars de 2006 à 2015. En 2025, les transactions courantes du Pérou affichaient un excédent de 3,6 % du PIB.
Commerce de biens du Pérou avec ses 10 principaux partenaires commerciaux, selon le Pérou, 2025
| Pays | Exportations vers | Importations depuis | Solde | |
|---|---|---|---|---|
 Chine |
32,6 Md $US | 19,0 Md $US | +13,6 Md $US | |
 États-Unis |
10,2 Md $US | 10,9 Md $US | −743 M $US | |
 Inde |
6,53 Md $US | 1,39 Md $US | +5,14 Md $US | |
 Canada |
5,02 Md $US | 1,18 Md $US | +3,83 Md $US | vs Canada |
 Brésil |
1,59 Md $US | 3,54 Md $US | −1,95 Md $US | |
 Japon |
3,21 Md $US | 1,21 Md $US | +2,00 Md $US | |
 Espagne |
2,82 Md $US | 953 M $US | +1,86 Md $US | |
 Chili |
2,30 Md $US | 1,32 Md $US | +975 M $US | vs Chili |
 Argentine |
313 M $US | 3,00 Md $US | −2,68 Md $US | vs Argentine |
 Colombie |
1,13 Md $US | 2,06 Md $US | −933 M $US | vs Colombie |
Balance commerciale du Pérou : excédent (+) ou déficit (−)
Comparer la balance commerciale du Pérou avec celle d'autres pays
Sources :
- TradeMap (2025, mis à jour en octobre 2026)
- Banque mondiale | Économie et croissance (1960–2025, mis à jour en octobre 2026)
Creative Commons Attribution (CC BY) : vous pouvez copier, partager, adapter et réutiliser ce contenu, y compris à des fins commerciales, à condition de citer statistics.wiki et d’indiquer les modifications apportées. Les sources citées ci-dessus peuvent avoir leurs propres conditions de licence.