
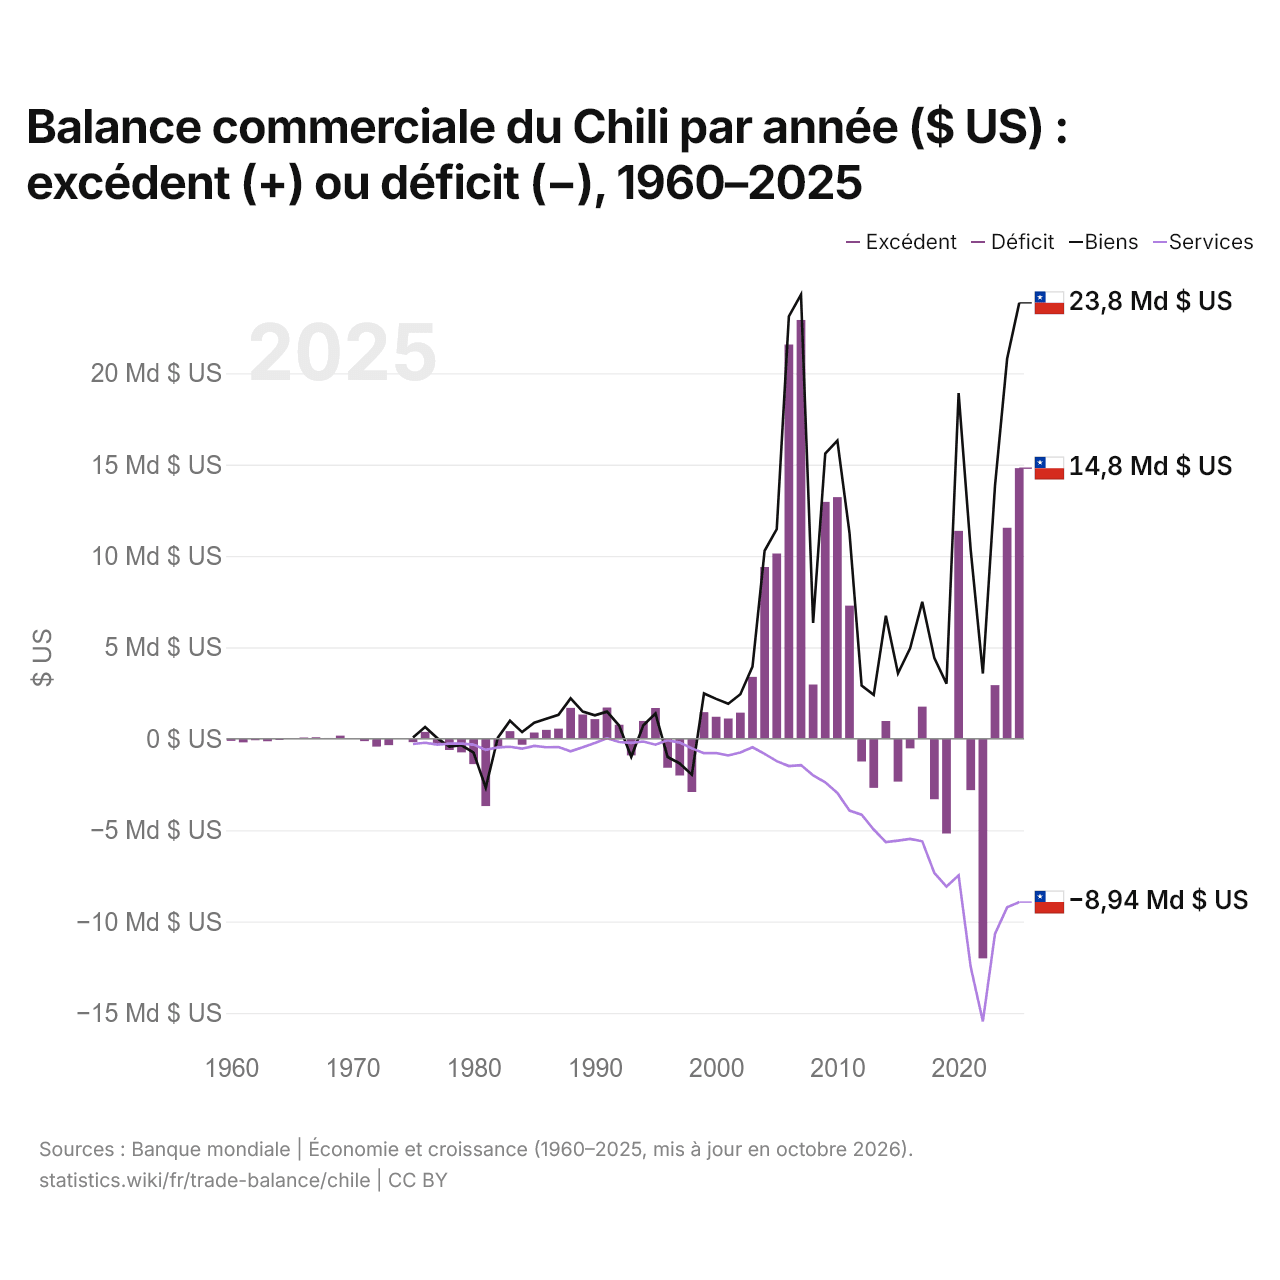
Balance commerciale du Chili par année ($ US) : excédent (+) ou déficit (−), 1960–2025
| Année | $ US | ||
|---|---|---|---|
| Biens et services | Biens | Services | |
| 2025 | 14 804 975 228 $ US | 23 847 483 262 $ US | −8 936 436 623 $ US |
| 2024 | 11 545 176 279 $ US | 20 786 106 473 $ US | −9 222 607 002 $ US |
| 2023 | 2 933 166 506 $ US | 13 842 440 399 $ US | −10 674 073 677 $ US |
| 2022 | −12 014 002 658 $ US | 3 570 170 230 $ US | −15 459 973 251 $ US |
| 2021 | −2 812 122 188 $ US | 10 305 307 876 $ US | −12 493 781 215 $ US |
| 2020 | 11 375 796 052 $ US | 18 916 838 077 $ US | −7 472 497 958 $ US |
| 2019 | −5 182 833 879 $ US | 3 016 114 211 $ US | −8 085 039 909 $ US |
| 2018 | −3 310 530 298 $ US | 4 408 553 728 $ US | −7 341 459 723 $ US |
| 2017 | 1 757 984 593 $ US | 7 490 388 029 $ US | −5 610 538 074 $ US |
| 2016 | −527 476 210 $ US | 4 950 676 697 $ US | −5 478 624 067 $ US |
| 2015 | −2 344 379 586 $ US | 3 575 844 055 $ US | −5 570 964 042 $ US |
| 2014 | 968 625 055 $ US | 6 730 623 443 $ US | −5 656 386 892 $ US |
| 2013 | −2 686 187 876 $ US | 2 399 399 685 $ US | −4 964 712 505 $ US |
| 2012 | −1 241 559 881 $ US | 2 909 235 473 $ US | −4 156 421 239 $ US |
| 2011 | 7 284 859 134 $ US | 11 266 280 940 $ US | −3 925 623 938 $ US |
| 2010 | 13 219 086 595 $ US | 16 314 604 394 $ US | −2 967 625 900 $ US |
| 2009 | 12 961 051 576 $ US | 15 600 676 607 $ US | −2 384 528 438 $ US |
| 2008 | 2 965 553 776 $ US | 6 339 793 631 $ US | −2 001 270 083 $ US |
| 2007 | 22 911 435 530 $ US | 24 296 241 476 $ US | −1 440 673 507 $ US |
| 2006 | 21 568 421 478 $ US | 23 112 183 624 $ US | −1 492 137 882 $ US |
| 2005 | 10 136 483 837 $ US | 11 465 310 546 $ US | −1 224 687 592 $ US |
| 2004 | 9 394 522 805 $ US | 10 287 252 365 $ US | −828 175 740 $ US |
| 2003 | 3 387 497 528 $ US | 3 943 450 626 $ US | −466 770 446 $ US |
| 2002 | 1 426 773 699 $ US | 2 435 596 068 $ US | −751 495 185 $ US |
| 2001 | 1 109 305 458 $ US | 1 915 250 807 $ US | −915 964 256 $ US |
| 2000 | 1 202 974 079 $ US | 2 181 077 166 $ US | −781 022 488 $ US |
| 1999 | 1 453 087 040 $ US | 2 480 158 434 $ US | −790 185 006 $ US |
| 1998 | −2 909 838 412 $ US | −1 965 893 790 $ US | −526 183 533 $ US |
| 1997 | −2 009 169 758 $ US | −1 352 262 337 $ US | −211 118 472 $ US |
| 1996 | −1 587 287 186 $ US | −997 349 196 $ US | −75 275 937 $ US |
| 1995 | 1 678 472 004 $ US | 1 381 000 000 $ US | −324 100 000 $ US |
| 1994 | 975 504 071 $ US | 732 000 000 $ US | −151 000 000 $ US |
| 1993 | −910 684 560 $ US | −989 800 000 $ US | −225 900 000 $ US |
| 1992 | 767 144 020 $ US | 722 000 000 $ US | −176 000 000 $ US |
| 1991 | 1 706 007 584 $ US | 1 485 100 000 $ US | 33 600 000 $ US |
| 1990 | 1 074 813 125 $ US | 1 283 500 000 $ US | −228 210 000 $ US |
| 1989 | 1 325 335 767 $ US | 1 483 200 000 $ US | −460 660 000 $ US |
| 1988 | 1 690 789 705 $ US | 2 209 800 000 $ US | −690 500 000 $ US |
| 1987 | 555 122 127 $ US | 1 308 700 000 $ US | −453 800 000 $ US |
| 1986 | 488 799 123 $ US | 1 092 100 000 $ US | −464 340 000 $ US |
| 1985 | 339 874 219 $ US | 883 700 000 $ US | −387 980 000 $ US |
| 1984 | −326 526 915 $ US | 362 000 000 $ US | −543 000 000 $ US |
| 1983 | 412 516 962 $ US | 986 000 000 $ US | −439 000 000 $ US |
| 1982 | −515 371 499 $ US | 63 000 000 $ US | −474 000 000 $ US |
| 1981 | −3 683 471 885 $ US | −2 677 000 000 $ US | −608 000 000 $ US |
| 1980 | −1 387 218 822 $ US | −764 000 000 $ US | −320 000 000 $ US |
| 1979 | −745 793 488 $ US | −355 000 000 $ US | −263 000 000 $ US |
| 1978 | −613 837 751 $ US | −426 000 000 $ US | −270 000 000 $ US |
| 1977 | −320 362 052 $ US | 35 000 000 $ US | −317 000 000 $ US |
| 1976 | 375 782 332 $ US | 643 000 000 $ US | −218 000 000 $ US |
| 1975 | −187 399 628 $ US | 70 000 000 $ US | −287 000 000 $ US |
| 1974 | 37 116 935 $ US | - | - |
| 1973 | −351 014 126 $ US | - | - |
| 1972 | −426 238 589 $ US | - | - |
| 1971 | −131 010 402 $ US | - | - |
| 1970 | 35 341 639 $ US | - | - |
| 1969 | 168 513 808 $ US | - | - |
| 1968 | 43 189 791 $ US | - | - |
| 1967 | 80 542 423 $ US | - | - |
| 1966 | 67 017 398 $ US | - | - |
| 1965 | 38 087 742 $ US | - | - |
| 1964 | −58 309 926 $ US | - | - |
| 1963 | −138 188 656 $ US | - | - |
| 1962 | −81 469 754 $ US | - | - |
| 1961 | −198 972 381 $ US | - | - |
| 1960 | −114 140 000 $ US | - | - |
En 2025, la balance commerciale du Chili affichait un excédent de 14,8 milliards de dollars, contre un déficit de 114 millions de dollars en 1960. Le plus grand déficit a été de 12 milliards de dollars, en 2022, et le plus grand excédent de 22,9 milliards de dollars, en 2007. La balance commerciale du Chili est excédentaire chaque année depuis 2023. Le commerce de biens affichait un excédent de 23,8 milliards de dollars et celui de services un déficit de 8,94 milliards de dollars.
En 2025, le solde commercial du Chili était le 2e plus élevé de 26 pays situés en Amérique latine, où les soldes allaient d'un déficit de 24,7 milliards de dollars en Colombie à un excédent de 27,2 milliards de dollars au Pérou. De 2016 à 2025, les soldes commerciaux du Chili ont totalisé un excédent de 18,6 milliards de dollars, contre un excédent de 75,6 milliards de dollars de 2006 à 2015. En 2025, les transactions courantes du Chili affichaient un déficit de 1,2 % du PIB.
Commerce de biens du Chili avec ses 10 principaux partenaires commerciaux, selon le Chili, 2025
| Pays | Exportations vers | Importations depuis | Solde | |
|---|---|---|---|---|
 Chine |
39,0 Md $US | 23,8 Md $US | +15,1 Md $US | |
 États-Unis |
19,7 Md $US | 15,9 Md $US | +3,82 Md $US | |
 Brésil |
5,20 Md $US | 7,85 Md $US | −2,65 Md $US | vs Brésil |
 Japon |
8,40 Md $US | 1,82 Md $US | +6,57 Md $US | |
 Argentine |
1,30 Md $US | 6,85 Md $US | −5,55 Md $US | vs Argentine |
 Corée du Sud |
4,87 Md $US | 1,63 Md $US | +3,24 Md $US | |
 Inde |
3,94 Md $US | 1,42 Md $US | +2,52 Md $US | |
 Allemagne |
1,77 Md $US | 3,08 Md $US | −1,31 Md $US | |
 Pérou |
2,43 Md $US | 2,13 Md $US | +301 M $US | vs Pérou |
 Espagne |
2,09 Md $US | 2,13 Md $US | −44,1 M $US |
Balance commerciale du Chili : excédent (+) ou déficit (−)
Comparer la balance commerciale du Chili avec celle d'autres pays
Sources :
- TradeMap (2025, mis à jour en octobre 2026)
- Banque mondiale | Économie et croissance (1960–2025, mis à jour en octobre 2026)
Creative Commons Attribution (CC BY) : vous pouvez copier, partager, adapter et réutiliser ce contenu, y compris à des fins commerciales, à condition de citer statistics.wiki et d’indiquer les modifications apportées. Les sources citées ci-dessus peuvent avoir leurs propres conditions de licence.