
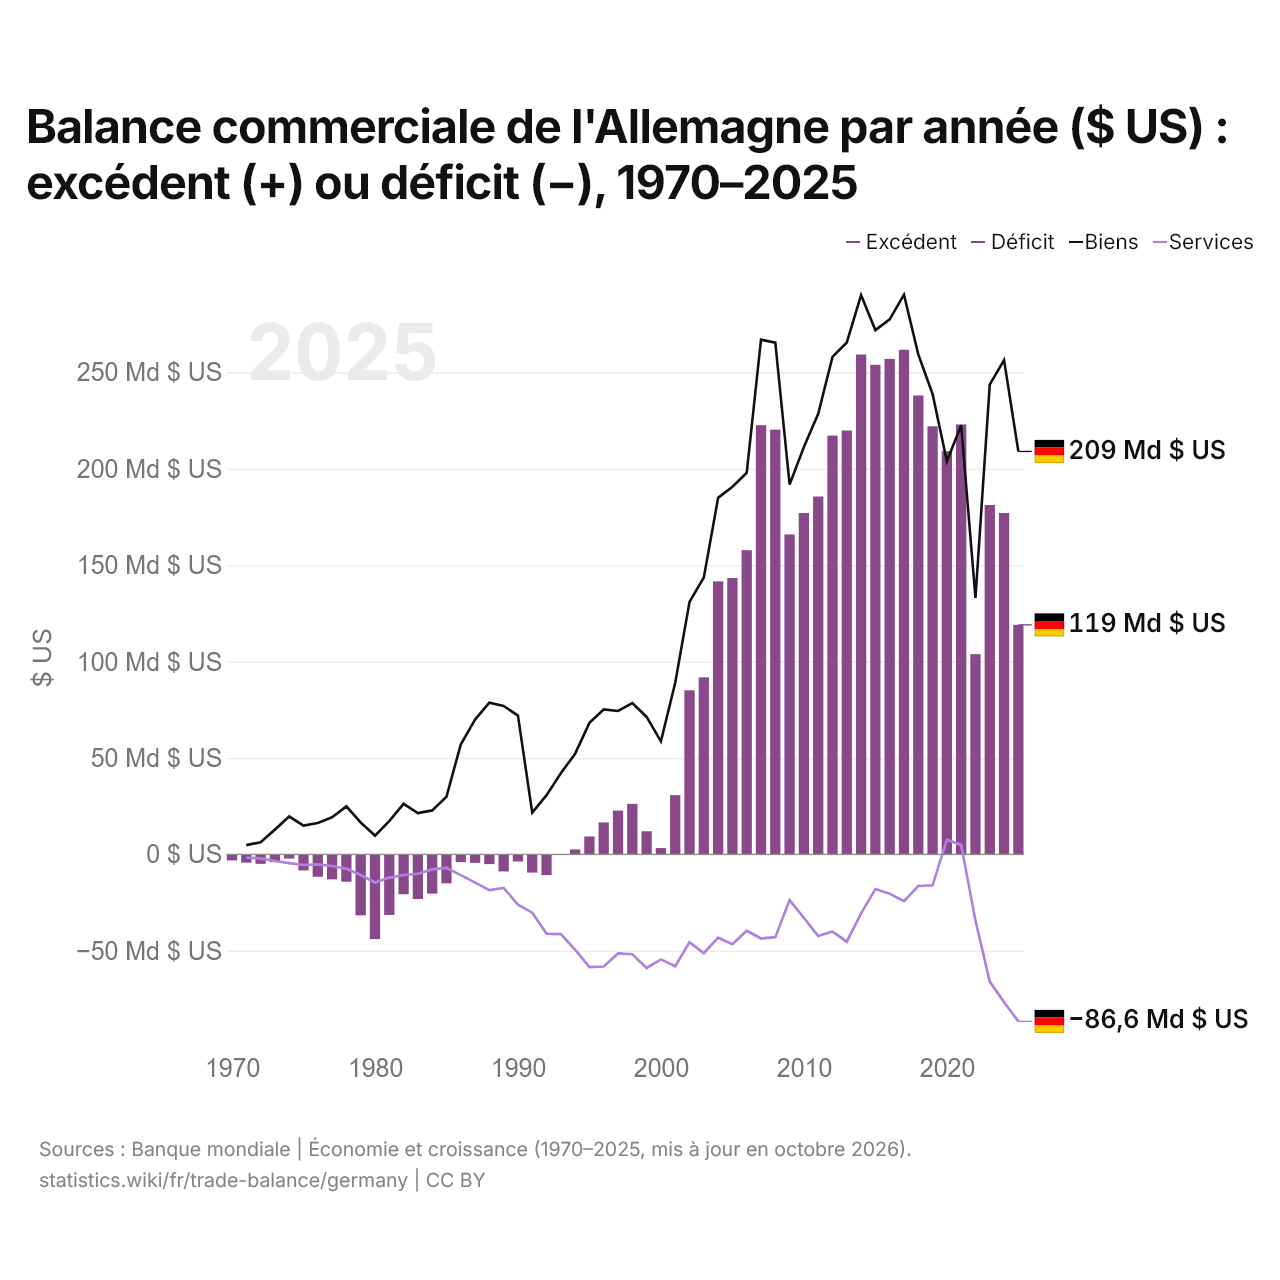
Balance commerciale de l'Allemagne par année ($ US) : excédent (+) ou déficit (−), 1970–2025
| Année | $ US | ||
|---|---|---|---|
| Biens et services | Biens | Services | |
| 2025 | 119 036 943 611 $ US | 208 964 502 916 $ US | −86 622 358 810 $ US |
| 2024 | 176 993 019 011 $ US | 256 345 482 950 $ US | −76 670 864 506 $ US |
| 2023 | 181 209 809 275 $ US | 243 654 398 196 $ US | −66 042 223 079 $ US |
| 2022 | 103 809 534 747 $ US | 132 963 061 426 $ US | −34 289 012 510 $ US |
| 2021 | 222 995 040 802 $ US | 222 509 758 115 $ US | 4 906 088 338 $ US |
| 2020 | 209 133 823 156 $ US | 203 819 589 593 $ US | 7 616 450 853 $ US |
| 2019 | 222 041 052 173 $ US | 238 776 333 289 $ US | −16 063 700 194 $ US |
| 2018 | 237 995 400 452 $ US | 259 317 254 267 $ US | −16 439 689 424 $ US |
| 2017 | 261 732 442 733 $ US | 290 289 940 340 $ US | −24 300 593 583 $ US |
| 2016 | 256 950 954 099 $ US | 277 498 011 178 $ US | −20 445 828 960 $ US |
| 2015 | 253 944 200 893 $ US | 271 889 863 761 $ US | −18 025 280 453 $ US |
| 2014 | 259 262 242 062 $ US | 290 027 974 518 $ US | −30 643 801 700 $ US |
| 2013 | 219 838 066 559 $ US | 265 527 150 748 $ US | −45 326 766 200 $ US |
| 2012 | 217 210 227 233 $ US | 258 019 654 081 $ US | −40 066 071 742 $ US |
| 2011 | 185 606 097 335 $ US | 228 476 027 107 $ US | −42 366 302 055 $ US |
| 2010 | 177 011 015 050 $ US | 211 274 726 488 $ US | −32 934 160 308 $ US |
| 2009 | 165 923 316 906 $ US | 191 811 953 066 $ US | −23 723 332 387 $ US |
| 2008 | 220 288 283 354 $ US | 265 387 833 011 $ US | −42 963 666 416 $ US |
| 2007 | 222 623 193 646 $ US | 266 928 303 237 $ US | −43 678 314 969 $ US |
| 2006 | 157 789 848 554 $ US | 197 895 988 661 $ US | −39 615 811 736 $ US |
| 2005 | 143 315 467 107 $ US | 190 620 125 277 $ US | −46 622 491 194 $ US |
| 2004 | 141 587 181 187 $ US | 184 895 071 599 $ US | −43 235 491 953 $ US |
| 2003 | 91 785 747 701 $ US | 143 585 392 098 $ US | −51 267 197 472 $ US |
| 2002 | 85 110 145 458 $ US | 130 917 612 921 $ US | −45 507 695 656 $ US |
| 2001 | 30 705 762 723 $ US | 88 996 844 494 $ US | −58 058 746 355 $ US |
| 2000 | 3 259 428 685 $ US | 58 597 202 253 $ US | −54 492 356 606 $ US |
| 1999 | 11 966 537 957 $ US | 71 280 370 166 $ US | −58 955 081 577 $ US |
| 1998 | 26 183 172 169 $ US | 78 477 362 003 $ US | −51 838 565 622 $ US |
| 1997 | 22 686 668 171 $ US | 74 346 826 655 $ US | −51 391 061 576 $ US |
| 1996 | 16 562 256 304 $ US | 75 151 924 636 $ US | −58 207 054 945 $ US |
| 1995 | 9 254 810 973 $ US | 68 204 058 845 $ US | −58 455 943 805 $ US |
| 1994 | 2 562 371 942 $ US | 52 197 968 937 $ US | −49 492 571 612 $ US |
| 1993 | 179 817 816 $ US | 42 022 622 078 $ US | −41 415 996 601 $ US |
| 1992 | −10 812 773 951 $ US | 30 685 306 861 $ US | −41 104 975 319 $ US |
| 1991 | −9 442 545 669 $ US | 21 637 818 525 $ US | −30 256 342 823 $ US |
| 1990 | −3 700 909 091 $ US | 71 929 019 946 $ US | −26 093 437 849 $ US |
| 1989 | −8 860 353 688 $ US | 76 952 148 277 $ US | −17 407 271 714 $ US |
| 1988 | −5 073 354 494 $ US | 78 646 645 300 $ US | −18 553 605 444 $ US |
| 1987 | −4 398 411 317 $ US | 69 869 401 193 $ US | −14 679 551 860 $ US |
| 1986 | −4 040 852 923 $ US | 56 952 949 074 $ US | −10 809 034 452 $ US |
| 1985 | −15 052 044 247 $ US | 29 901 372 196 $ US | −6 993 394 764 $ US |
| 1984 | −20 362 746 203 $ US | 22 792 126 647 $ US | −7 804 220 064 $ US |
| 1983 | −23 185 607 813 $ US | 21 425 883 965 $ US | −10 084 487 224 $ US |
| 1982 | −20 687 120 174 $ US | 26 186 535 114 $ US | −10 740 693 012 $ US |
| 1981 | −31 452 268 282 $ US | 17 232 260 580 $ US | −12 052 891 873 $ US |
| 1980 | −43 964 356 574 $ US | 9 719 209 284 $ US | −14 600 678 437 $ US |
| 1979 | −31 634 161 776 $ US | 16 515 089 758 $ US | −10 766 108 630 $ US |
| 1978 | −14 221 404 090 $ US | 24 863 255 933 $ US | −7 510 746 049 $ US |
| 1977 | −12 957 768 887 $ US | 19 227 240 726 $ US | −6 053 009 959 $ US |
| 1976 | −11 645 608 203 $ US | 16 242 129 657 $ US | −5 179 369 061 $ US |
| 1975 | −8 334 008 268 $ US | 14 912 535 989 $ US | −5 553 501 734 $ US |
| 1974 | −2 193 463 835 $ US | 19 626 181 873 $ US | −4 543 948 141 $ US |
| 1973 | −4 000 794 731 $ US | 12 809 670 197 $ US | −3 478 184 866 $ US |
| 1972 | −4 909 821 505 $ US | 6 261 345 944 $ US | −2 088 535 449 $ US |
| 1971 | −4 336 130 597 $ US | 4 790 856 397 $ US | −1 661 556 577 $ US |
| 1970 | −3 162 513 226 $ US | - | - |
En 2025, la balance commerciale de l'Allemagne affichait un excédent de 119 milliards de dollars, contre un déficit de 3,16 milliards de dollars en 1970. Le plus grand déficit a été de 44 milliards de dollars, en 1980, et le plus grand excédent de 262 milliards de dollars, en 2017. La balance commerciale de l'Allemagne est excédentaire chaque année depuis 1993. Le commerce de biens affichait un excédent de 209 milliards de dollars et celui de services un déficit de 86,6 milliards de dollars.
En 2025, le solde commercial de l'Allemagne était le 3e plus élevé de 41 pays situés en Europe, où les soldes allaient d'un déficit de 56,8 milliards de dollars en Ukraine à un excédent de 290 milliards de dollars en Irlande. De 2016 à 2025, les soldes commerciaux de l'Allemagne ont totalisé un excédent de 1,99 billion de dollars, contre un excédent de 2,08 billions de dollars de 2006 à 2015. En 2025, les transactions courantes de l'Allemagne affichaient un excédent de 4,4 % du PIB.
Commerce de biens de l'Allemagne avec ses 10 principaux partenaires commerciaux, selon l'Allemagne, 2025
| Pays | Exportations vers | Importations depuis | Solde | |
|---|---|---|---|---|
 Chine |
91,8 Md $US | 194 Md $US | −102 Md $US | vs Chine |
 États-Unis |
166 Md $US | 103 Md $US | +62,9 Md $US | vs USA |
 Pays-Bas |
126 Md $US | 99,4 Md $US | +27,0 Md $US | vs Pays-Bas |
 France |
132 Md $US | 78,0 Md $US | +54,4 Md $US | vs France |
 Pologne |
113 Md $US | 90,9 Md $US | +22,3 Md $US | vs Pologne |
 Italie |
94,1 Md $US | 81,9 Md $US | +12,3 Md $US | vs Italie |
 Suisse |
84,1 Md $US | 63,6 Md $US | +20,5 Md $US | vs Suisse |
 Autriche |
86,7 Md $US | 58,8 Md $US | +27,9 Md $US | vs Autriche |
 Royaume-Uni |
90,2 Md $US | 43,4 Md $US | +46,8 Md $US | vs R.-U. |
 Tchéquie |
60,0 Md $US | 69,8 Md $US | −9,76 Md $US | vs Tchéquie |
Balance commerciale de l'Allemagne : excédent (+) ou déficit (−)
| Biens et services, $ US, 2025 | +119 Md $US |
|---|---|
| % du PIB, 2025 | +2,4 % |
| Années d'excédent, 2000–2025 | 26 |
| Biens, $ US, 2025 | +209 Md $US |
| Services, $ US, 2025 | −86,6 Md $US |
| Premier excédent en biens, 2025 | États-Unis +62,9 Md $US |
| Premier déficit en biens, 2025 | Chine −102 Md $US |
Comparer la balance commerciale de l'Allemagne avec celle d'autres pays
Sources :
- TradeMap (2025, mis à jour en octobre 2026)
- Banque mondiale | Économie et croissance (1970–2025, mis à jour en octobre 2026)
Creative Commons Attribution (CC BY) : vous pouvez copier, partager, adapter et réutiliser ce contenu, y compris à des fins commerciales, à condition de citer statistics.wiki et d’indiquer les modifications apportées. Les sources citées ci-dessus peuvent avoir leurs propres conditions de licence.