
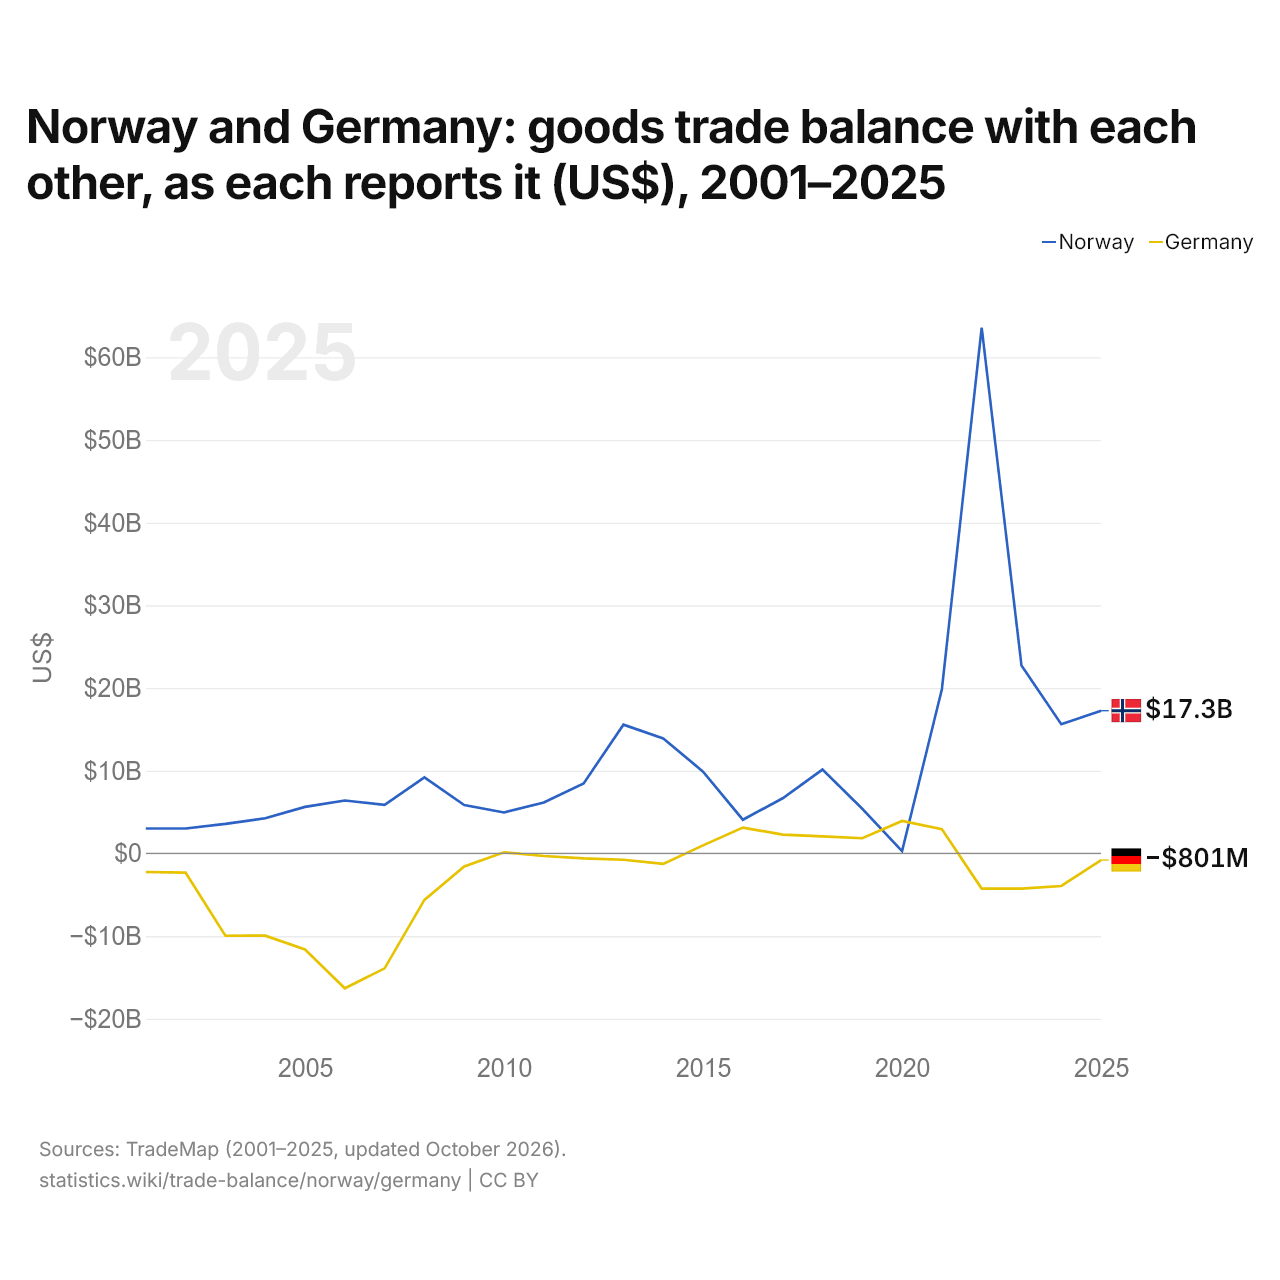
La Norvège et l'Allemagne : solde de leur commerce de biens bilatéral, selon chacun ($ US), 2001–2025
| Année | $ US | |
|---|---|---|
| Norvège | Allemagne | |
| 2025 | 17 259 550 000 $ US | −801 042 000 $ US |
| 2024 | 15 629 601 000 $ US | −3 938 747 000 $ US |
| 2023 | 22 710 557 000 $ US | −4 262 052 000 $ US |
| 2022 | 63 576 585 000 $ US | −4 256 312 000 $ US |
| 2021 | 19 842 904 000 $ US | 2 931 729 000 $ US |
| 2020 | 277 535 000 $ US | 3 922 143 000 $ US |
| 2019 | 5 393 487 000 $ US | 1 828 102 000 $ US |
| 2018 | 10 140 027 000 $ US | 2 052 316 000 $ US |
| 2017 | 6 662 703 000 $ US | 2 274 976 000 $ US |
| 2016 | 4 068 922 000 $ US | 3 121 624 000 $ US |
| 2015 | 9 887 388 000 $ US | 970 447 000 $ US |
| 2014 | 13 910 552 000 $ US | −1 271 354 000 $ US |
| 2013 | 15 572 922 000 $ US | −770 450 000 $ US |
| 2012 | 8 462 873 000 $ US | −612 366 000 $ US |
| 2011 | 6 160 253 000 $ US | −313 993 000 $ US |
| 2010 | 4 947 075 000 $ US | 131 104 000 $ US |
| 2009 | 5 852 102 000 $ US | −1 587 571 000 $ US |
| 2008 | 9 197 384 000 $ US | −5 624 220 000 $ US |
| 2007 | 5 861 755 000 $ US | −13 900 597 000 $ US |
| 2006 | 6 394 644 000 $ US | −16 316 356 000 $ US |
| 2005 | 5 628 432 000 $ US | −11 620 472 000 $ US |
| 2004 | 4 250 691 000 $ US | −9 950 361 000 $ US |
| 2003 | 3 561 464 000 $ US | −9 955 884 000 $ US |
| 2002 | 3 010 539 000 $ US | −2 333 008 000 $ US |
| 2001 | 3 009 891 000 $ US | −2 251 007 000 $ US |
En 2025, selon la Norvège, son commerce de biens avec l'Allemagne affichait un excédent de 17,3 milliards de dollars ; selon l'Allemagne, son commerce de biens avec la Norvège affichait un déficit de 801 millions de dollars. En 2001, les chiffres étaient un excédent de 3,01 milliards de dollars pour la Norvège et un déficit de 2,25 milliards de dollars pour l'Allemagne.
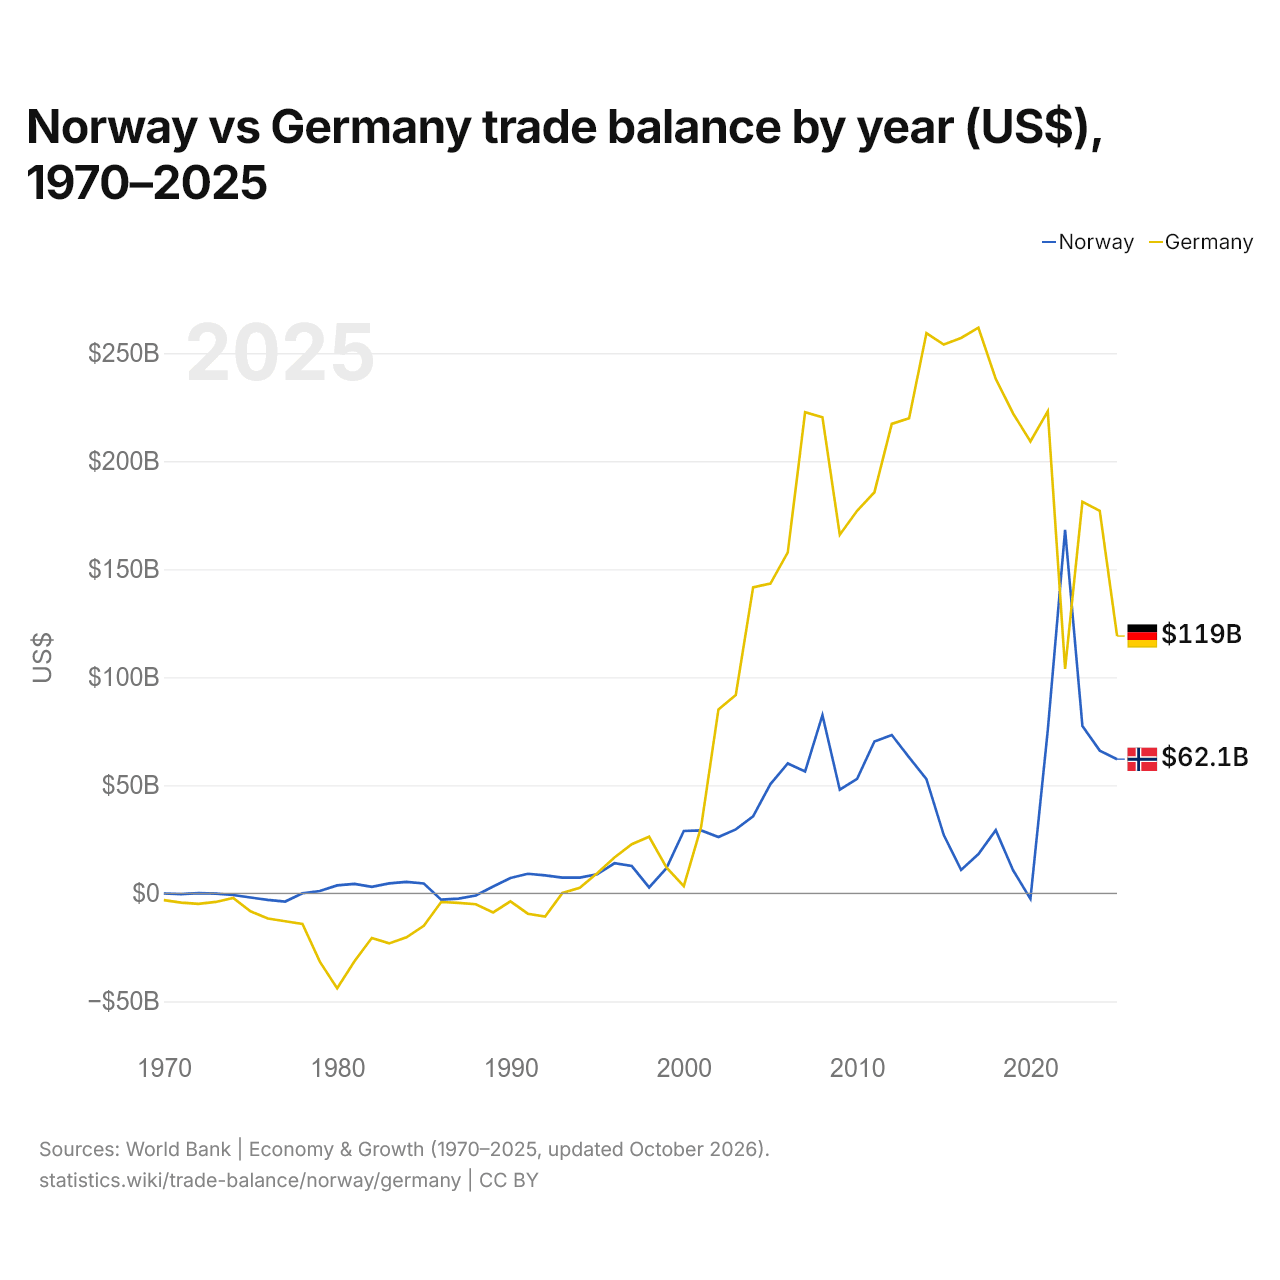
Norvège vs Allemagne : balance commerciale par année ($ US), 1970–2025
| Année | $ US | |
|---|---|---|
 Norvège |
 Allemagne |
|
| 2025 | 62 061 691 383 $ US | 119 036 943 611 $ US |
| 2024 | 66 013 586 661 $ US | 176 993 019 011 $ US |
| 2023 | 77 382 297 255 $ US | 181 209 809 275 $ US |
| 2022 | 168 143 018 116 $ US | 103 809 534 747 $ US |
| 2021 | 75 439 464 494 $ US | 222 995 040 802 $ US |
| 2020 | −2 578 741 482 $ US | 209 133 823 156 $ US |
| 2019 | 10 647 954 545 $ US | 222 041 052 173 $ US |
| 2018 | 29 218 444 513 $ US | 237 995 400 452 $ US |
| 2017 | 18 141 084 022 $ US | 261 732 442 733 $ US |
| 2016 | 10 825 238 095 $ US | 256 950 954 099 $ US |
| 2015 | 26 940 911 439 $ US | 253 944 200 893 $ US |
| 2014 | 52 830 150 754 $ US | 259 262 242 062 $ US |
| 2013 | 62 911 659 574 $ US | 219 838 066 559 $ US |
| 2012 | 73 268 414 267 $ US | 217 210 227 233 $ US |
| 2011 | 70 243 279 940 $ US | 185 606 097 335 $ US |
| 2010 | 52 975 375 707 $ US | 177 011 015 050 $ US |
| 2009 | 47 919 469 491 $ US | 165 923 316 906 $ US |
| 2008 | 82 461 347 518 $ US | 220 288 283 354 $ US |
| 2007 | 56 360 441 510 $ US | 222 623 193 646 $ US |
| 2006 | 60 084 200 022 $ US | 157 789 848 554 $ US |
| 2005 | 50 560 962 359 $ US | 143 315 467 107 $ US |
| 2004 | 35 586 725 611 $ US | 141 587 181 187 $ US |
| 2003 | 29 572 328 465 $ US | 91 785 747 701 $ US |
| 2002 | 26 020 691 901 $ US | 85 110 145 458 $ US |
| 2001 | 29 081 152 619 $ US | 30 705 762 723 $ US |
| 2000 | 28 816 037 629 $ US | 3 259 428 685 $ US |
| 1999 | 11 622 217 663 $ US | 11 966 537 957 $ US |
| 1998 | 2 735 020 079 $ US | 26 183 172 169 $ US |
| 1997 | 12 625 045 947 $ US | 22 686 668 171 $ US |
| 1996 | 13 902 136 500 $ US | 16 562 256 304 $ US |
| 1995 | 8 768 468 241 $ US | 9 254 810 973 $ US |
| 1994 | 7 225 260 712 $ US | 2 562 371 942 $ US |
| 1993 | 7 246 303 266 $ US | 179 817 816 $ US |
| 1992 | 8 279 990 345 $ US | −10 812 773 951 $ US |
| 1991 | 9 038 701 816 $ US | −9 442 545 669 $ US |
| 1990 | 7 042 669 777 $ US | −3 700 909 091 $ US |
| 1989 | 3 130 277 355 $ US | −8 860 353 688 $ US |
| 1988 | −1 028 080 405 $ US | −5 073 354 494 $ US |
| 1987 | −2 431 762 523 $ US | −4 398 411 317 $ US |
| 1986 | −2 930 747 698 $ US | −4 040 852 923 $ US |
| 1985 | 4 513 097 287 $ US | −15 052 044 247 $ US |
| 1984 | 5 246 707 100 $ US | −20 362 746 203 $ US |
| 1983 | 4 617 345 540 $ US | −23 185 607 813 $ US |
| 1982 | 2 993 027 580 $ US | −20 687 120 174 $ US |
| 1981 | 4 377 559 021 $ US | −31 452 268 282 $ US |
| 1980 | 3 645 124 717 $ US | −43 964 356 574 $ US |
| 1979 | 1 063 565 095 $ US | −31 634 161 776 $ US |
| 1978 | 16 595 769 $ US | −14 221 404 090 $ US |
| 1977 | −3 826 993 519 $ US | −12 957 768 887 $ US |
| 1976 | −3 050 673 509 $ US | −11 645 608 203 $ US |
| 1975 | −1 950 869 540 $ US | −8 334 008 268 $ US |
| 1974 | −773 327 075 $ US | −2 193 463 835 $ US |
| 1973 | −118 457 109 $ US | −4 000 794 731 $ US |
| 1972 | 111 107 738 $ US | −4 909 821 505 $ US |
| 1971 | −387 902 323 $ US | −4 336 130 597 $ US |
| 1970 | −92 959 442 $ US | −3 162 513 226 $ US |
En 2025, la balance commerciale de la Norvège affichait un excédent de 62,1 milliards de dollars et celle de l'Allemagne un excédent de 119 milliards de dollars ; l'excédent de l'Allemagne était 1,9 fois plus grand. En 1970, la balance commerciale de la Norvège affichait un déficit de 93 millions de dollars et celle de l'Allemagne un déficit de 3,16 milliards de dollars.
De 1970 à 2025, la balance commerciale de la Norvège a été excédentaire pendant 45 des 56 années, et celle de l'Allemagne pendant 33. Les balances commerciales de la Norvège et de l'Allemagne ont été déficitaires en même temps pendant 10 de ces années, la dernière fois en 1988.
Norvège vs Allemagne : chiffres de la balance commerciale
|
Norvège
|
Allemagne
|
|
|---|---|---|
| Biens et services, $ US | +62,1 Md $US (2025) | +119 Md $US (2025) |
| % du PIB | +11,7 % (2025) | +2,4 % (2025) |
| Années d'excédent depuis 2000 | 25 sur 26 | 26 sur 26 |
| Solde des biens entre les deux, chiffres propres | +17,3 Md $US (2025) | −801 M $US (2025) |
| Premier excédent en biens avec | Royaume-Uni (+25,7 Md $US, 2025) | États-Unis (+62,9 Md $US, 2025) |
| Premier déficit en biens avec | Chine (−8,09 Md $US, 2025) | Chine (−102 Md $US, 2025) |
Comparer la balance commerciale de 2 pays au choix
Sources :
- Banque mondiale | Économie et croissance (1970–2025, mis à jour en octobre 2026)
- TradeMap (2001–2025, mis à jour en octobre 2026)
Creative Commons Attribution (CC BY) : vous pouvez copier, partager, adapter et réutiliser ce contenu, y compris à des fins commerciales, à condition de citer statistics.wiki et d’indiquer les modifications apportées. Les sources citées ci-dessus peuvent avoir leurs propres conditions de licence.