
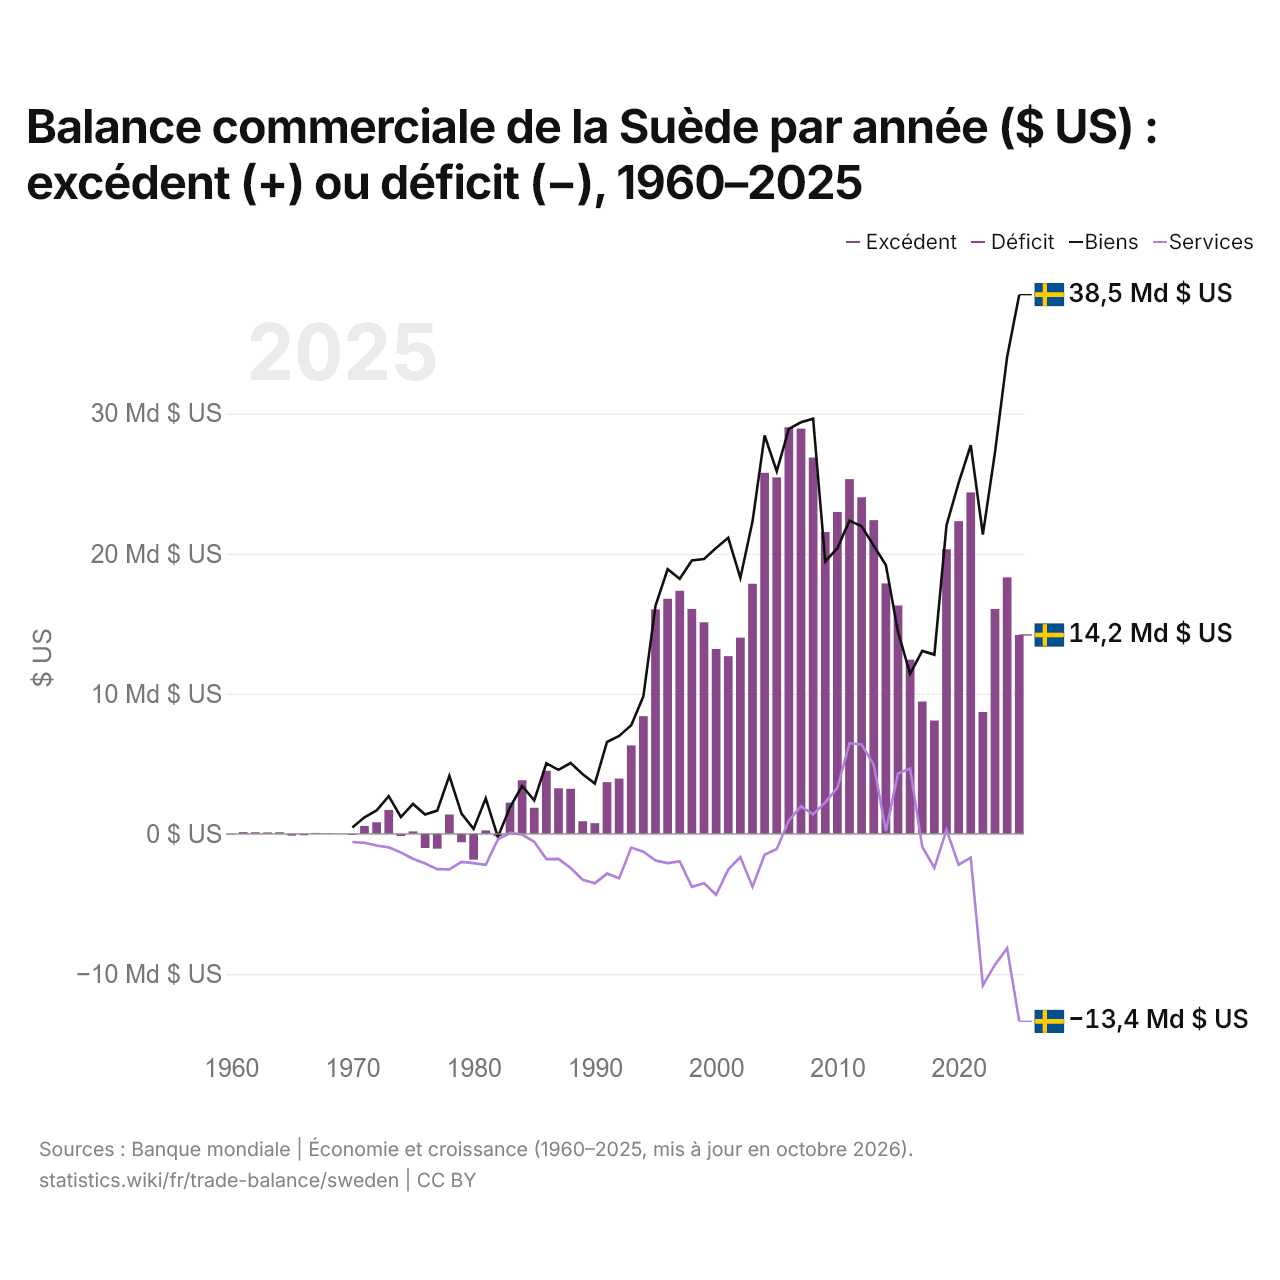
Balance commerciale de la Suède par année ($ US) : excédent (+) ou déficit (−), 1960–2025
| Année | $ US | ||
|---|---|---|---|
| Biens et services | Biens | Services | |
| 2025 | 14 196 128 478 $ US | 38 479 643 431 $ US | −13 373 373 720 $ US |
| 2024 | 18 306 837 219 $ US | 34 040 250 071 $ US | −8 150 980 583 $ US |
| 2023 | 16 049 897 380 $ US | 27 223 731 042 $ US | −9 327 348 387 $ US |
| 2022 | 8 697 233 002 $ US | 21 365 143 794 $ US | −10 804 928 667 $ US |
| 2021 | 24 372 223 399 $ US | 27 731 014 124 $ US | −1 694 408 252 $ US |
| 2020 | 22 315 755 027 $ US | 25 054 351 447 $ US | −2 198 590 111 $ US |
| 2019 | 20 312 952 780 $ US | 22 018 429 001 $ US | 291 871 302 $ US |
| 2018 | 8 096 272 829 $ US | 12 792 002 539 $ US | −2 417 462 880 $ US |
| 2017 | 9 452 136 557 $ US | 13 056 712 502 $ US | −910 655 195 $ US |
| 2016 | 12 432 154 123 $ US | 11 424 899 629 $ US | 4 669 897 290 $ US |
| 2015 | 16 301 315 308 $ US | 14 413 535 435 $ US | 4 319 353 393 $ US |
| 2014 | 17 877 691 838 $ US | 19 181 672 292 $ US | 202 131 385 $ US |
| 2013 | 22 385 421 285 $ US | 20 569 804 677 $ US | 4 927 486 481 $ US |
| 2012 | 24 018 541 654 $ US | 21 948 418 496 $ US | 6 376 412 537 $ US |
| 2011 | 25 317 610 365 $ US | 22 353 499 115 $ US | 6 471 650 574 $ US |
| 2010 | 22 974 879 608 $ US | 20 391 197 783 $ US | 3 281 181 996 $ US |
| 2009 | 21 541 587 185 $ US | 19 440 469 866 $ US | 2 255 262 085 $ US |
| 2008 | 26 861 980 550 $ US | 29 628 422 562 $ US | 1 398 811 005 $ US |
| 2007 | 28 918 299 106 $ US | 29 370 329 556 $ US | 1 972 552 173 $ US |
| 2006 | 29 012 631 807 $ US | 28 898 065 449 $ US | 962 221 943 $ US |
| 2005 | 25 441 383 094 $ US | 25 879 453 215 $ US | −1 080 613 591 $ US |
| 2004 | 25 772 156 377 $ US | 28 427 333 650 $ US | −1 486 830 596 $ US |
| 2003 | 17 852 664 383 $ US | 22 284 096 377 $ US | −3 772 534 566 $ US |
| 2002 | 14 004 991 219 $ US | 18 262 637 854 $ US | −1 652 008 824 $ US |
| 2001 | 12 682 227 880 $ US | 21 134 859 188 $ US | −2 543 508 846 $ US |
| 2000 | 13 194 320 141 $ US | 20 402 554 737 $ US | −4 340 894 911 $ US |
| 1999 | 15 103 238 768 $ US | 19 616 328 237 $ US | −3 525 039 224 $ US |
| 1998 | 16 052 151 599 $ US | 19 506 877 258 $ US | −3 778 567 619 $ US |
| 1997 | 17 351 373 299 $ US | 18 203 303 648 $ US | −1 958 754 903 $ US |
| 1996 | 16 777 214 435 $ US | 18 889 522 995 $ US | −2 078 217 427 $ US |
| 1995 | 16 019 373 922 $ US | 16 277 810 547 $ US | −1 894 200 079 $ US |
| 1994 | 8 403 317 781 $ US | 9 815 681 499 $ US | −1 273 624 357 $ US |
| 1993 | 6 320 502 608 $ US | 7 757 570 830 $ US | −975 628 769 $ US |
| 1992 | 3 951 423 126 $ US | 6 990 098 141 $ US | −3 164 586 494 $ US |
| 1991 | 3 696 628 193 $ US | 6 562 038 341 $ US | −2 832 285 227 $ US |
| 1990 | 765 436 406 $ US | 3 587 387 373 $ US | −3 517 234 180 $ US |
| 1989 | 900 996 913 $ US | 4 253 027 240 $ US | −3 269 883 171 $ US |
| 1988 | 3 219 573 867 $ US | 5 063 830 467 $ US | −2 426 347 919 $ US |
| 1987 | 3 256 319 475 $ US | 4 573 522 616 $ US | −1 775 707 669 $ US |
| 1986 | 4 508 620 922 $ US | 5 034 743 724 $ US | −1 798 934 694 $ US |
| 1985 | 1 866 005 300 $ US | 2 384 780 316 $ US | −560 403 355 $ US |
| 1984 | 3 828 967 697 $ US | 3 421 671 318 $ US | −40 668 561 $ US |
| 1983 | 2 235 418 607 $ US | 1 900 567 269 $ US | 67 261 909 $ US |
| 1982 | −162 813 007 $ US | −221 886 192 $ US | −387 734 131 $ US |
| 1981 | 249 949 836 $ US | 2 544 403 594 $ US | −2 208 899 782 $ US |
| 1980 | −1 835 547 570 $ US | 355 608 124 $ US | −2 082 516 903 $ US |
| 1979 | −592 112 384 $ US | 1 453 592 930 $ US | −1 999 661 341 $ US |
| 1978 | 1 384 036 517 $ US | 4 151 158 448 $ US | −2 532 483 007 $ US |
| 1977 | −1 053 723 001 $ US | 1 661 500 241 $ US | −2 513 899 628 $ US |
| 1976 | −1 007 174 637 $ US | 1 384 312 846 $ US | −2 114 234 644 $ US |
| 1975 | 181 173 595 $ US | 2 139 546 433 $ US | −1 774 646 691 $ US |
| 1974 | −154 147 182 $ US | 1 202 858 479 $ US | −1 324 495 853 $ US |
| 1973 | 1 709 666 842 $ US | 2 695 059 821 $ US | −957 124 049 $ US |
| 1972 | 834 119 352 $ US | 1 679 819 420 $ US | −829 410 839 $ US |
| 1971 | 572 532 043 $ US | 1 186 131 953 $ US | −634 034 350 $ US |
| 1970 | −66 959 136 $ US | 458 129 478 $ US | −577 977 696 $ US |
| 1969 | −7 331 231 $ US | - | - |
| 1968 | 38 934 046 $ US | - | - |
| 1967 | 72 387 548 $ US | - | - |
| 1966 | −88 089 598 $ US | - | - |
| 1965 | −120 298 999 $ US | - | - |
| 1964 | 120 311 370 $ US | - | - |
| 1963 | 107 403 524 $ US | - | - |
| 1962 | 114 250 337 $ US | - | - |
| 1961 | 127 693 054 $ US | - | - |
| 1960 | −37 486 009 $ US | - | - |
En 2025, la balance commerciale de la Suède affichait un excédent de 14,2 milliards de dollars, contre un déficit de 37,5 millions de dollars en 1960. Le plus grand déficit a été de 1,84 milliard de dollars, en 1980, et le plus grand excédent de 29 milliards de dollars, en 2006. La balance commerciale de la Suède est excédentaire chaque année depuis 1983.
En 2025, le solde commercial de la Suède était le 13e plus élevé de 41 pays situés en Europe, où les soldes allaient d'un déficit de 56,8 milliards de dollars en Ukraine à un excédent de 290 milliards de dollars en Irlande. De 2016 à 2025, les soldes commerciaux de la Suède ont totalisé un excédent de 154 milliards de dollars, contre un excédent de 235 milliards de dollars de 2006 à 2015. En 2025, les transactions courantes de la Suède affichaient un excédent de 6,8 % du PIB.
Commerce de biens de la Suède avec ses 10 principaux partenaires commerciaux, selon la Suède, 2025
| Pays | Exportations vers | Importations depuis | Solde | |
|---|---|---|---|---|
 Allemagne |
20,5 Md $US | 32,2 Md $US | −11,6 Md $US | vs Allemagne |
 Norvège |
20,5 Md $US | 17,8 Md $US | +2,66 Md $US | vs Norvège |
 Pays-Bas |
10,1 Md $US | 22,1 Md $US | −12,1 Md $US | vs Pays-Bas |
 Danemark |
14,6 Md $US | 13,6 Md $US | +974 M $US | vs Danemark |
 États-Unis |
16,6 Md $US | 8,73 Md $US | +7,89 Md $US | vs USA |
 Finlande |
13,5 Md $US | 9,87 Md $US | +3,67 Md $US | vs Finlande |
 Belgique |
9,82 Md $US | 9,90 Md $US | −80,4 M $US | vs Belgique |
 Chine |
6,63 Md $US | 12,9 Md $US | −6,23 Md $US | |
 Pologne |
8,51 Md $US | 9,66 Md $US | −1,15 Md $US | vs Pologne |
 Royaume-Uni |
10,8 Md $US | 5,57 Md $US | +5,27 Md $US |
Balance commerciale de la Suède : excédent (+) ou déficit (−)
| Biens et services, $ US, 2025 | +14,2 Md $US |
|---|---|
| % du PIB, 2025 | +2,1 % |
| Années d'excédent, 2000–2025 | 26 |
| Biens, $ US, 2025 | +38,5 Md $US |
| Services, $ US, 2025 | −13,4 Md $US |
| Premier excédent en biens, 2025 | États-Unis +7,89 Md $US |
| Premier déficit en biens, 2025 | Pays-Bas −12,1 Md $US |
Comparer la balance commerciale de la Suède avec celle d'autres pays
Sources :
- TradeMap (2025, mis à jour en octobre 2026)
- Banque mondiale | Économie et croissance (1960–2025, mis à jour en octobre 2026)
Creative Commons Attribution (CC BY) : vous pouvez copier, partager, adapter et réutiliser ce contenu, y compris à des fins commerciales, à condition de citer statistics.wiki et d’indiquer les modifications apportées. Les sources citées ci-dessus peuvent avoir leurs propres conditions de licence.