
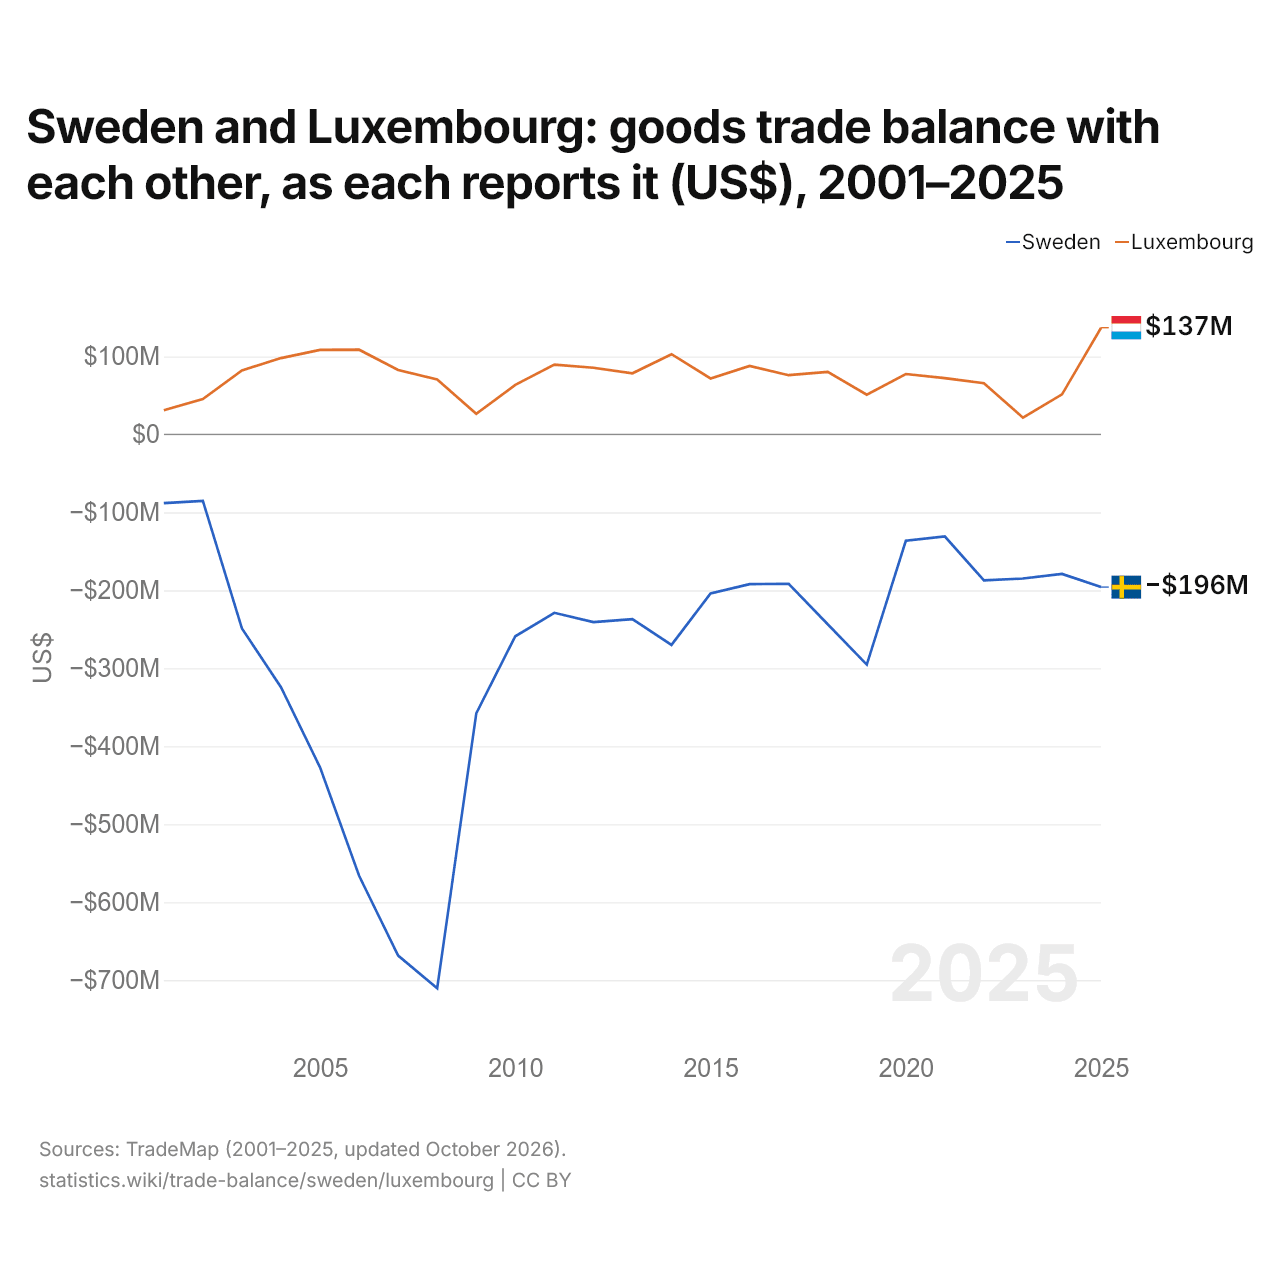
La Suède et le Luxembourg : solde de leur commerce de biens bilatéral, selon chacun ($ US), 2001–2025
| Année | $ US | |
|---|---|---|
| Suède | Luxembourg | |
| 2025 | −195 870 000 $ US | 136 831 000 $ US |
| 2024 | −179 009 000 $ US | 51 346 000 $ US |
| 2023 | −184 832 000 $ US | 21 428 000 $ US |
| 2022 | −187 280 000 $ US | 65 577 000 $ US |
| 2021 | −131 017 000 $ US | 72 142 000 $ US |
| 2020 | −136 480 000 $ US | 77 415 000 $ US |
| 2019 | −295 318 000 $ US | 50 833 000 $ US |
| 2018 | −243 515 000 $ US | 80 130 000 $ US |
| 2017 | −191 591 000 $ US | 75 931 000 $ US |
| 2016 | −192 024 000 $ US | 87 717 000 $ US |
| 2015 | −204 118 000 $ US | 71 744 000 $ US |
| 2014 | −270 082 000 $ US | 102 844 000 $ US |
| 2013 | −237 002 000 $ US | 78 358 000 $ US |
| 2012 | −240 859 000 $ US | 85 474 000 $ US |
| 2011 | −228 880 000 $ US | 89 559 000 $ US |
| 2010 | −258 898 000 $ US | 63 433 000 $ US |
| 2009 | −358 020 000 $ US | 26 391 000 $ US |
| 2008 | −710 500 000 $ US | 70 488 000 $ US |
| 2007 | −668 506 000 $ US | 82 600 000 $ US |
| 2006 | −566 109 000 $ US | 108 605 000 $ US |
| 2005 | −427 132 000 $ US | 108 404 000 $ US |
| 2004 | −324 248 000 $ US | 97 869 000 $ US |
| 2003 | −248 941 000 $ US | 82 087 000 $ US |
| 2002 | −85 321 000 $ US | 45 252 000 $ US |
| 2001 | −88 260 000 $ US | 30 929 000 $ US |
En 2025, selon la Suède, son commerce de biens avec le Luxembourg affichait un déficit de 196 millions de dollars ; selon le Luxembourg, son commerce de biens avec la Suède affichait un excédent de 137 millions de dollars. En 2001, les chiffres étaient un déficit de 88,3 millions de dollars pour la Suède et un excédent de 30,9 millions de dollars pour le Luxembourg.
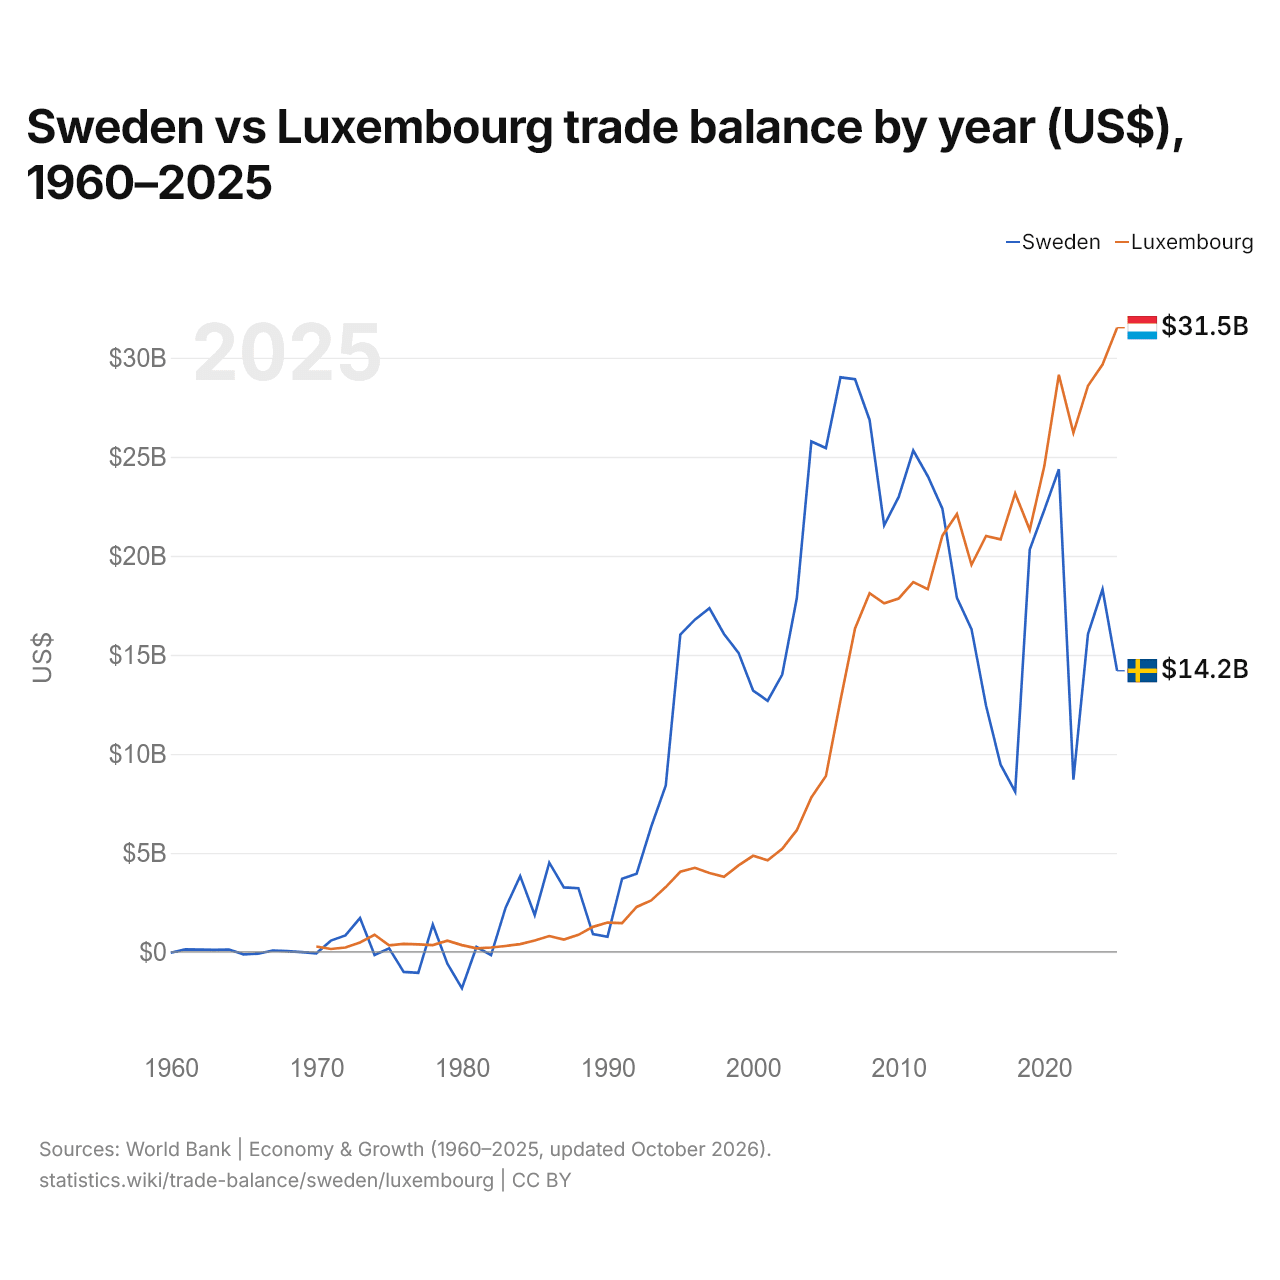
Suède vs Luxembourg : balance commerciale par année ($ US), 1960–2025
| Année | $ US | |
|---|---|---|
 Suède |
 Luxembourg |
|
| 2025 | 14 196 128 478 $ US | 31 518 141 665 $ US |
| 2024 | 18 306 837 219 $ US | 29 661 145 226 $ US |
| 2023 | 16 049 897 380 $ US | 28 583 517 820 $ US |
| 2022 | 8 697 233 002 $ US | 26 211 856 977 $ US |
| 2021 | 24 372 223 399 $ US | 29 138 379 401 $ US |
| 2020 | 22 315 755 027 $ US | 24 526 867 050 $ US |
| 2019 | 20 312 952 780 $ US | 21 310 629 102 $ US |
| 2018 | 8 096 272 829 $ US | 23 153 266 233 $ US |
| 2017 | 9 452 136 557 $ US | 20 831 428 214 $ US |
| 2016 | 12 432 154 123 $ US | 21 004 332 240 $ US |
| 2015 | 16 301 315 308 $ US | 19 546 634 762 $ US |
| 2014 | 17 877 691 838 $ US | 22 111 345 194 $ US |
| 2013 | 22 385 421 285 $ US | 21 017 073 520 $ US |
| 2012 | 24 018 541 654 $ US | 18 313 535 758 $ US |
| 2011 | 25 317 610 365 $ US | 18 671 634 868 $ US |
| 2010 | 22 974 879 608 $ US | 17 846 724 852 $ US |
| 2009 | 21 541 587 185 $ US | 17 602 447 068 $ US |
| 2008 | 26 861 980 550 $ US | 18 109 940 088 $ US |
| 2007 | 28 918 299 106 $ US | 16 336 899 957 $ US |
| 2006 | 29 012 631 807 $ US | 12 701 864 962 $ US |
| 2005 | 25 441 383 094 $ US | 8 879 862 271 $ US |
| 2004 | 25 772 156 377 $ US | 7 799 067 257 $ US |
| 2003 | 17 852 664 383 $ US | 6 146 511 782 $ US |
| 2002 | 14 004 991 219 $ US | 5 211 065 311 $ US |
| 2001 | 12 682 227 880 $ US | 4 627 460 723 $ US |
| 2000 | 13 194 320 141 $ US | 4 856 938 506 $ US |
| 1999 | 15 103 238 768 $ US | 4 369 002 405 $ US |
| 1998 | 16 052 151 599 $ US | 3 793 094 021 $ US |
| 1997 | 17 351 373 299 $ US | 3 981 856 112 $ US |
| 1996 | 16 777 214 435 $ US | 4 247 033 225 $ US |
| 1995 | 16 019 373 922 $ US | 4 048 253 968 $ US |
| 1994 | 8 403 317 781 $ US | 3 273 598 987 $ US |
| 1993 | 6 320 502 608 $ US | 2 600 159 748 $ US |
| 1992 | 3 951 423 126 $ US | 2 273 483 061 $ US |
| 1991 | 3 696 628 193 $ US | 1 459 135 263 $ US |
| 1990 | 765 436 406 $ US | 1 484 205 698 $ US |
| 1989 | 900 996 913 $ US | 1 266 363 636 $ US |
| 1988 | 3 219 573 867 $ US | 862 131 651 $ US |
| 1987 | 3 256 319 475 $ US | 625 157 212 $ US |
| 1986 | 4 508 620 922 $ US | 801 841 250 $ US |
| 1985 | 1 866 005 300 $ US | 574 526 123 $ US |
| 1984 | 3 828 967 697 $ US | 394 617 425 $ US |
| 1983 | 2 235 418 607 $ US | 302 460 750 $ US |
| 1982 | −162 813 007 $ US | 224 778 386 $ US |
| 1981 | 249 949 836 $ US | 179 524 120 $ US |
| 1980 | −1 835 547 570 $ US | 344 654 435 $ US |
| 1979 | −592 112 384 $ US | 572 656 852 $ US |
| 1978 | 1 384 036 517 $ US | 348 275 906 $ US |
| 1977 | −1 053 723 001 $ US | 383 322 454 $ US |
| 1976 | −1 007 174 637 $ US | 405 474 399 $ US |
| 1975 | 181 173 595 $ US | 335 657 563 $ US |
| 1974 | −154 147 182 $ US | 868 957 125 $ US |
| 1973 | 1 709 666 842 $ US | 479 769 199 $ US |
| 1972 | 834 119 352 $ US | 222 945 651 $ US |
| 1971 | 572 532 043 $ US | 149 808 502 $ US |
| 1970 | −66 959 136 $ US | 273 181 121 $ US |
| 1969 | −7 331 231 $ US | - |
| 1968 | 38 934 046 $ US | - |
| 1967 | 72 387 548 $ US | - |
| 1966 | −88 089 598 $ US | - |
| 1965 | −120 298 999 $ US | - |
| 1964 | 120 311 370 $ US | - |
| 1963 | 107 403 524 $ US | - |
| 1962 | 114 250 337 $ US | - |
| 1961 | 127 693 054 $ US | - |
| 1960 | −37 486 009 $ US | - |
En 2025, la balance commerciale de la Suède affichait un excédent de 14,2 milliards de dollars et celle du Luxembourg un excédent de 31,5 milliards de dollars ; l'excédent du Luxembourg était 2,2 fois plus grand. En 1970, la balance commerciale de la Suède affichait un déficit de 67 millions de dollars et celle du Luxembourg un excédent de 273 millions de dollars.
De 1970 à 2025, la balance commerciale de la Suède a été excédentaire pendant 49 des 56 années, et celle du Luxembourg chacune d'elles. Les balances commerciales de la Suède et du Luxembourg n'ont jamais été déficitaires la même année.
Suède vs Luxembourg : chiffres de la balance commerciale
|
Suède
|
Luxembourg
|
|
|---|---|---|
| Biens et services, $ US | +14,2 Md $US (2025) | +31,5 Md $US (2025) |
| % du PIB | +2,1 % (2025) | +31,2 % (2025) |
| Années d'excédent depuis 2000 | 26 sur 26 | 26 sur 26 |
| Solde des biens entre les deux, chiffres propres | −196 M $US (2025) | +137 M $US (2025) |
| Premier excédent en biens avec | États-Unis (+7,89 Md $US, 2025) | Suède (+137 M $US, 2025) |
| Premier déficit en biens avec | Pays-Bas (−12,1 Md $US, 2025) | Belgique (−3,35 Md $US, 2025) |
Comparer la balance commerciale de 2 pays au choix
Sources :
- Banque mondiale | Économie et croissance (1960–2025, mis à jour en octobre 2026)
- TradeMap (2001–2025, mis à jour en octobre 2026)
Creative Commons Attribution (CC BY) : vous pouvez copier, partager, adapter et réutiliser ce contenu, y compris à des fins commerciales, à condition de citer statistics.wiki et d’indiquer les modifications apportées. Les sources citées ci-dessus peuvent avoir leurs propres conditions de licence.