
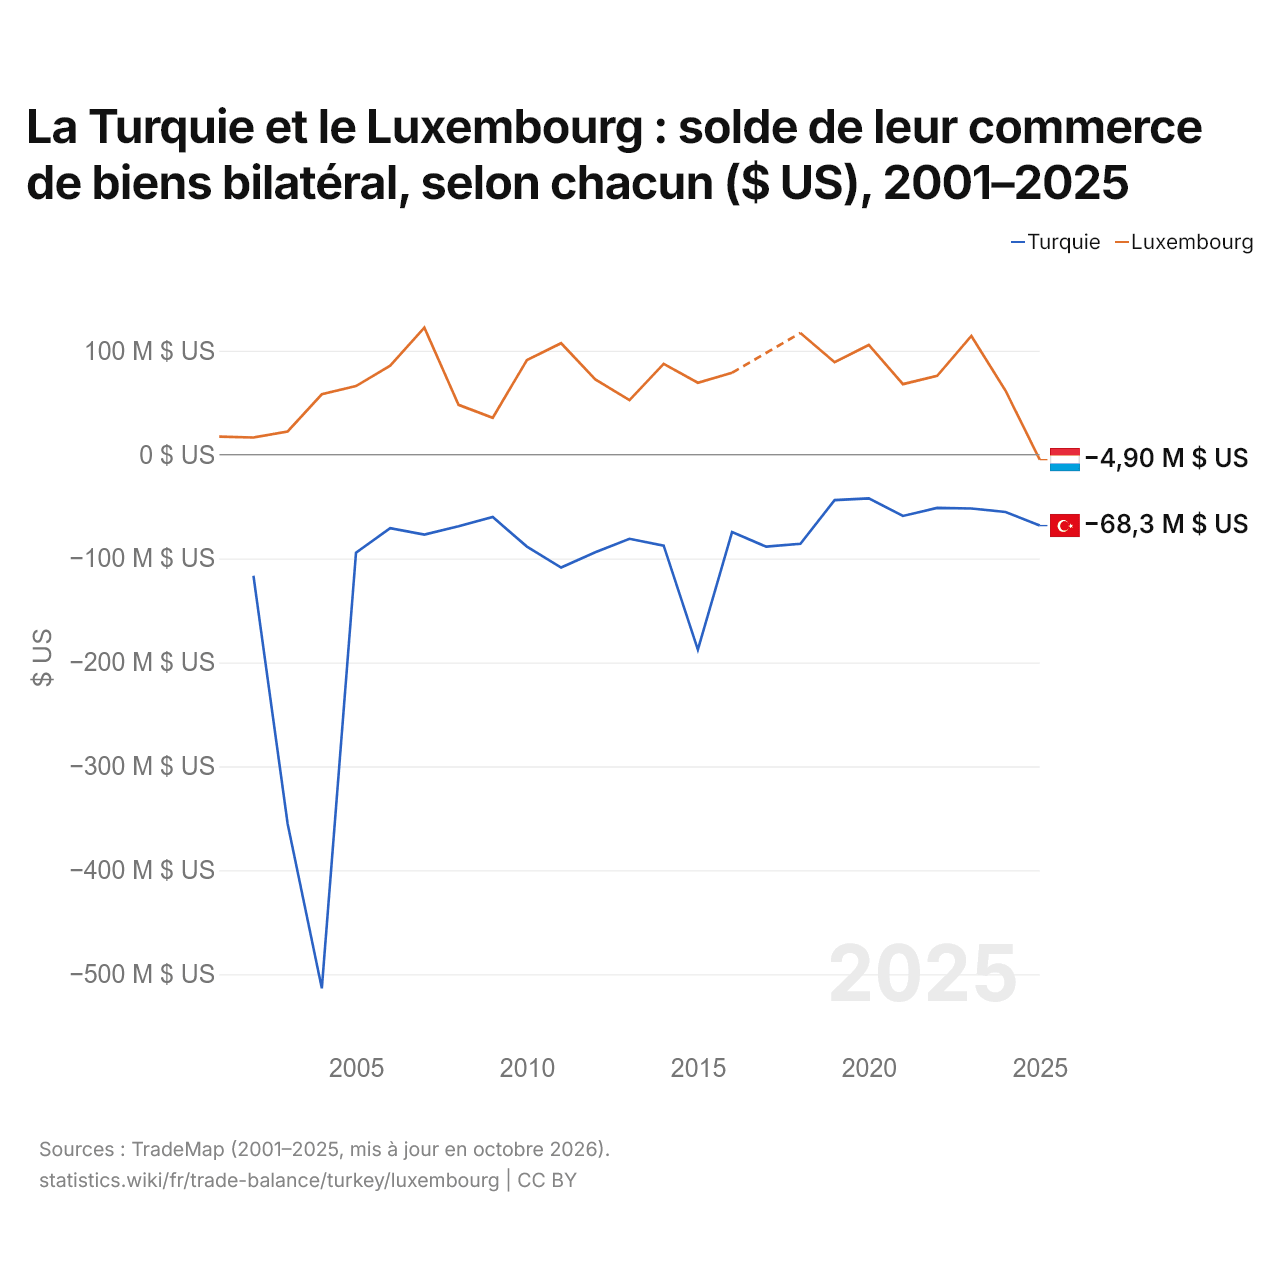
La Turquie et le Luxembourg : solde de leur commerce de biens bilatéral, selon chacun ($ US), 2001–2025
| Année | $ US | |
|---|---|---|
| Turquie | Luxembourg | |
| 2025 | −68 342 000 $ US | −4 902 000 $ US |
| 2024 | −55 224 000 $ US | 61 453 000 $ US |
| 2023 | −51 870 000 $ US | 114 161 000 $ US |
| 2022 | −51 344 000 $ US | 75 807 000 $ US |
| 2021 | −59 085 000 $ US | 67 749 000 $ US |
| 2020 | −42 133 000 $ US | 105 473 000 $ US |
| 2019 | −43 830 000 $ US | 88 815 000 $ US |
| 2018 | −85 827 000 $ US | 117 064 000 $ US |
| 2017 | −88 660 000 $ US | - |
| 2016 | −74 566 000 $ US | 78 734 000 $ US |
| 2015 | −187 759 000 $ US | 69 132 000 $ US |
| 2014 | −87 615 000 $ US | 87 214 000 $ US |
| 2013 | −81 048 000 $ US | 52 345 000 $ US |
| 2012 | −93 988 000 $ US | 72 307 000 $ US |
| 2011 | −108 770 000 $ US | 107 153 000 $ US |
| 2010 | −88 584 000 $ US | 90 947 000 $ US |
| 2009 | −60 002 000 $ US | 35 401 000 $ US |
| 2008 | −68 932 000 $ US | 47 866 000 $ US |
| 2007 | −77 014 000 $ US | 122 078 000 $ US |
| 2006 | −70 756 000 $ US | 85 611 000 $ US |
| 2005 | −94 466 000 $ US | 65 932 000 $ US |
| 2004 | −513 612 000 $ US | 58 010 000 $ US |
| 2003 | −355 183 000 $ US | 22 199 000 $ US |
| 2002 | −116 576 000 $ US | 16 426 000 $ US |
| 2001 | - | 17 220 000 $ US |
En 2025, selon la Turquie, son commerce de biens avec le Luxembourg affichait un déficit de 68,3 millions de dollars ; selon le Luxembourg, son commerce de biens avec la Turquie affichait un déficit de 4,9 millions de dollars. En 2002, les chiffres étaient un déficit de 117 millions de dollars pour la Turquie et un excédent de 16,4 millions de dollars pour le Luxembourg.
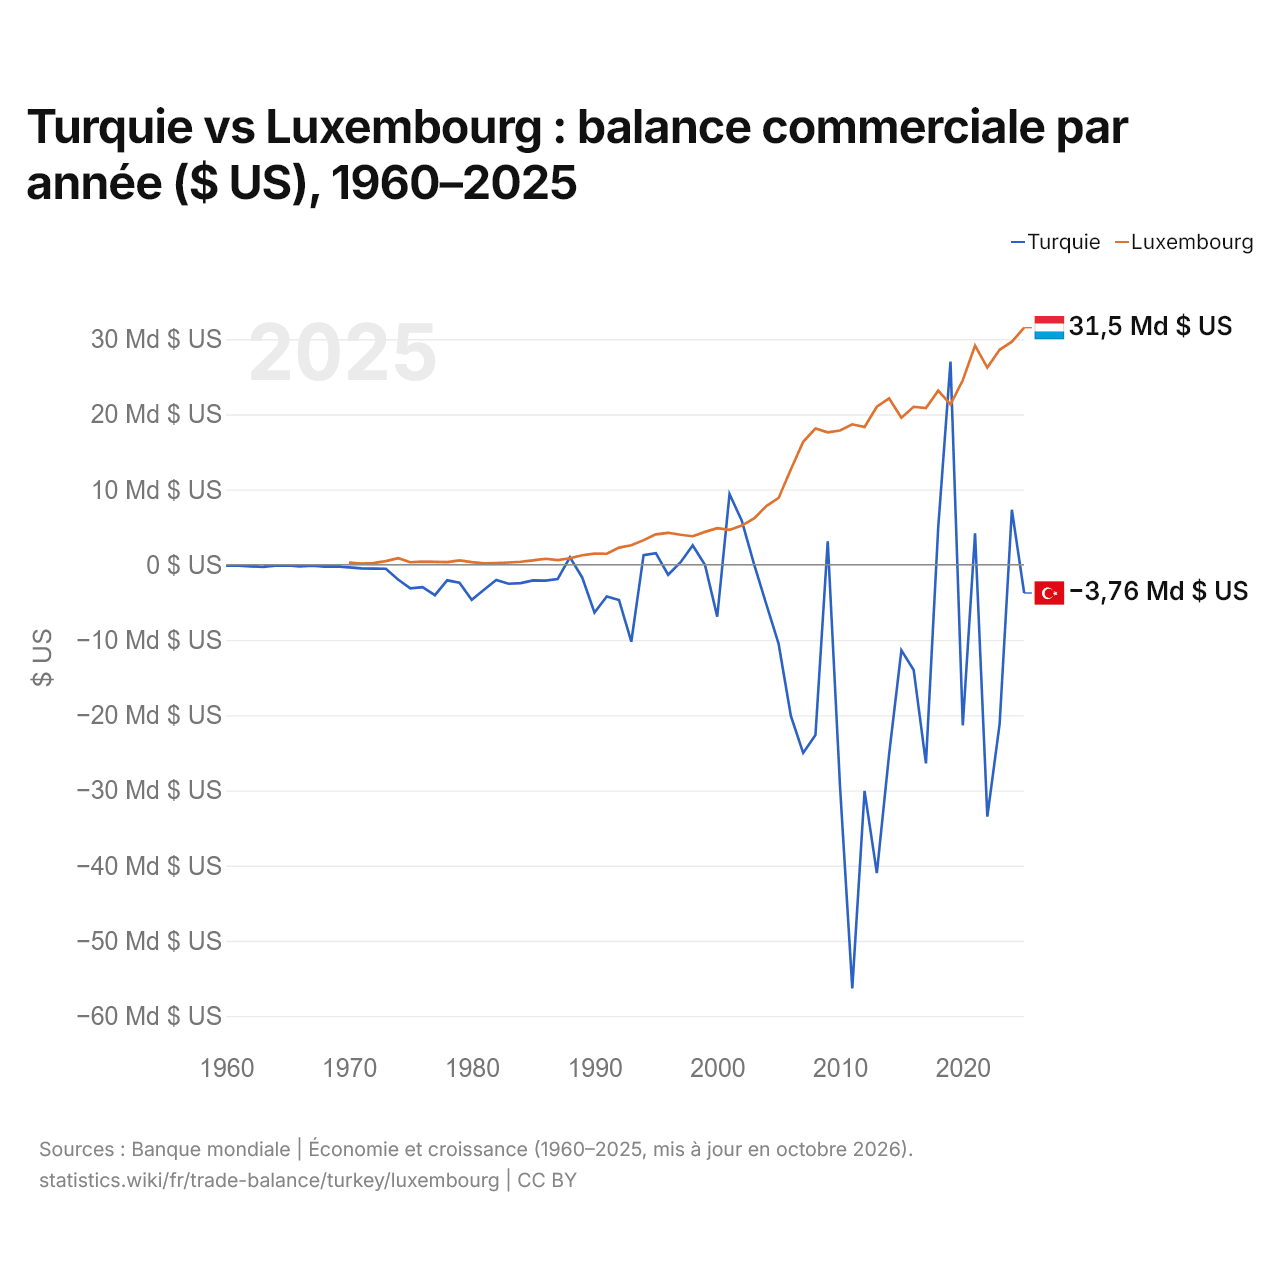
Turquie vs Luxembourg : balance commerciale par année ($ US), 1960–2025
| Année | $ US | |
|---|---|---|
 Turquie |
 Luxembourg |
|
| 2025 | −3 755 785 561 $ US | 31 518 141 665 $ US |
| 2024 | 7 307 197 101 $ US | 29 661 145 226 $ US |
| 2023 | −21 181 731 331 $ US | 28 583 517 820 $ US |
| 2022 | −33 486 302 440 $ US | 26 211 856 977 $ US |
| 2021 | 4 185 993 617 $ US | 29 138 379 401 $ US |
| 2020 | −21 347 440 639 $ US | 24 526 867 050 $ US |
| 2019 | 27 009 801 864 $ US | 21 310 629 102 $ US |
| 2018 | 4 971 181 455 $ US | 23 153 266 233 $ US |
| 2017 | −26 405 711 552 $ US | 20 831 428 214 $ US |
| 2016 | −13 983 412 331 $ US | 21 004 332 240 $ US |
| 2015 | −11 366 572 353 $ US | 19 546 634 762 $ US |
| 2014 | −25 180 591 325 $ US | 22 111 345 194 $ US |
| 2013 | −41 005 981 821 $ US | 21 017 073 520 $ US |
| 2012 | −30 066 833 315 $ US | 18 313 535 758 $ US |
| 2011 | −56 314 976 402 $ US | 18 671 634 868 $ US |
| 2010 | −29 450 676 482 $ US | 17 846 724 852 $ US |
| 2009 | 3 116 333 325 $ US | 17 602 447 068 $ US |
| 2008 | −22 630 468 482 $ US | 18 109 940 088 $ US |
| 2007 | −25 026 651 296 $ US | 16 336 899 957 $ US |
| 2006 | −20 116 184 782 $ US | 12 701 864 962 $ US |
| 2005 | −10 528 378 745 $ US | 8 879 862 271 $ US |
| 2004 | −5 268 792 743 $ US | 7 799 067 257 $ US |
| 2003 | 66 756 414 $ US | 6 146 511 782 $ US |
| 2002 | 5 845 228 386 $ US | 5 211 065 311 $ US |
| 2001 | 9 400 731 322 $ US | 4 627 460 723 $ US |
| 2000 | −6 890 257 814 $ US | 4 856 938 506 $ US |
| 1999 | −12 805 916 $ US | 4 369 002 405 $ US |
| 1998 | 2 572 582 501 $ US | 3 793 094 021 $ US |
| 1997 | 308 677 444 $ US | 3 981 856 112 $ US |
| 1996 | −1 330 688 533 $ US | 4 247 033 225 $ US |
| 1995 | 1 537 801 287 $ US | 4 048 253 968 $ US |
| 1994 | 1 278 297 139 $ US | 3 273 598 987 $ US |
| 1993 | −10 228 639 053 $ US | 2 600 159 748 $ US |
| 1992 | −4 698 195 576 $ US | 2 273 483 061 $ US |
| 1991 | −4 219 534 995 $ US | 1 459 135 263 $ US |
| 1990 | −6 346 799 540 $ US | 1 484 205 698 $ US |
| 1989 | −1 690 292 177 $ US | 1 266 363 636 $ US |
| 1988 | 1 000 632 911 $ US | 862 131 651 $ US |
| 1987 | −1 897 782 964 $ US | 625 157 212 $ US |
| 1986 | −2 110 962 963 $ US | 801 841 250 $ US |
| 1985 | −2 087 931 034 $ US | 574 526 123 $ US |
| 1984 | −2 437 602 180 $ US | 394 617 425 $ US |
| 1983 | −2 524 444 444 $ US | 302 460 750 $ US |
| 1982 | −2 029 447 853 $ US | 224 778 386 $ US |
| 1981 | −3 322 522 523 $ US | 179 524 120 $ US |
| 1980 | −4 656 578 947 $ US | 344 654 435 $ US |
| 1979 | −2 387 096 774 $ US | 572 656 852 $ US |
| 1978 | −2 070 833 333 $ US | 348 275 906 $ US |
| 1977 | −4 044 444 444 $ US | 383 322 454 $ US |
| 1976 | −2 987 500 000 $ US | 405 474 399 $ US |
| 1975 | −3 135 714 286 $ US | 335 657 563 $ US |
| 1974 | −1 964 285 714 $ US | 868 957 125 $ US |
| 1973 | −535 714 286 $ US | 479 769 199 $ US |
| 1972 | −521 428 571 $ US | 222 945 651 $ US |
| 1971 | −473 333 333 $ US | 149 808 502 $ US |
| 1970 | −345 454 545 $ US | 273 181 121 $ US |
| 1969 | −222 222 222 $ US | - |
| 1968 | −244 444 444 $ US | - |
| 1967 | −133 333 333 $ US | - |
| 1966 | −222 222 222 $ US | - |
| 1965 | −100 000 000 $ US | - |
| 1964 | −111 111 111 $ US | - |
| 1963 | −288 888 889 $ US | - |
| 1962 | −211 111 111 $ US | - |
| 1961 | −133 333 333 $ US | - |
| 1960 | −122 222 222 $ US | - |
En 2025, la balance commerciale de la Turquie affichait un déficit de 3,76 milliards de dollars et celle du Luxembourg un excédent de 31,5 milliards de dollars. En 1970, la balance commerciale de la Turquie affichait un déficit de 345 millions de dollars et celle du Luxembourg un excédent de 273 millions de dollars.
De 1970 à 2025, la balance commerciale de la Turquie a été excédentaire pendant 13 des 56 années, et celle du Luxembourg chacune d'elles. Les balances commerciales de la Turquie et du Luxembourg n'ont jamais été déficitaires la même année.
Turquie vs Luxembourg : chiffres de la balance commerciale
|
Turquie
|
Luxembourg
|
|
|---|---|---|
| Biens et services, $ US | −3,76 Md $US (2025) | +31,5 Md $US (2025) |
| % du PIB | −0,2 % (2025) | +31,2 % (2025) |
| Années d'excédent depuis 2000 | 8 sur 26 | 26 sur 26 |
| Solde des biens entre les deux, chiffres propres | −68,3 M $US (2025) | −4,90 M $US (2025) |
| Premier excédent en biens avec | Irak (+10,4 Md $US, 2025) | Suède (+137 M $US, 2025) |
| Premier déficit en biens avec | Chine (−46,3 Md $US, 2025) | Belgique (−3,35 Md $US, 2025) |
Comparer la balance commerciale de 2 pays au choix
Sources :
- Banque mondiale | Économie et croissance (1960–2025, mis à jour en octobre 2026)
- TradeMap (2001–2025, mis à jour en octobre 2026)
Creative Commons Attribution (CC BY) : vous pouvez copier, partager, adapter et réutiliser ce contenu, y compris à des fins commerciales, à condition de citer statistics.wiki et d’indiquer les modifications apportées. Les sources citées ci-dessus peuvent avoir leurs propres conditions de licence.