
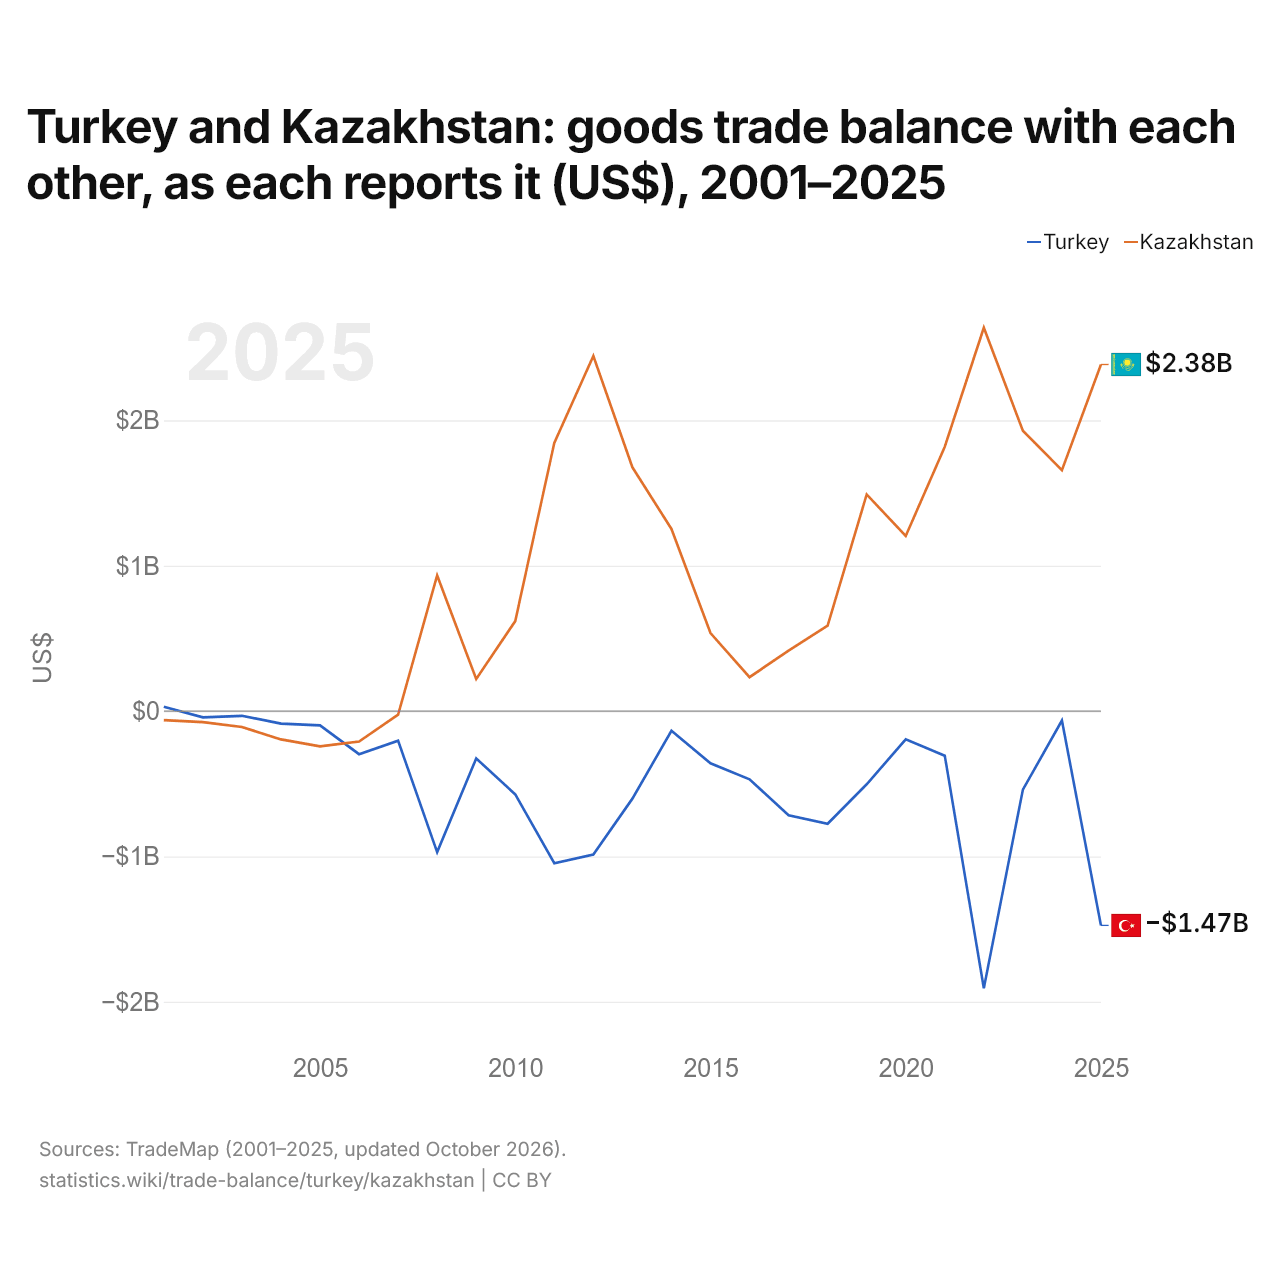
La Turquie et le Kazakhstan : solde de leur commerce de biens bilatéral, selon chacun ($ US), 2001–2025
| Année | $ US | |
|---|---|---|
| Turquie | Kazakhstan | |
| 2025 | −1 474 541 000 $ US | 2 384 276 000 $ US |
| 2024 | −65 411 000 $ US | 1 656 764 000 $ US |
| 2023 | −540 795 000 $ US | 1 928 196 000 $ US |
| 2022 | −1 907 322 000 $ US | 2 637 197 000 $ US |
| 2021 | −307 008 000 $ US | 1 818 284 000 $ US |
| 2020 | −194 864 000 $ US | 1 204 163 000 $ US |
| 2019 | −503 774 000 $ US | 1 490 164 000 $ US |
| 2018 | −774 992 000 $ US | 587 063 000 $ US |
| 2017 | −716 914 000 $ US | 415 729 000 $ US |
| 2016 | −469 397 000 $ US | 232 943 000 $ US |
| 2015 | −359 723 000 $ US | 536 283 000 $ US |
| 2014 | −135 777 000 $ US | 1 253 059 000 $ US |
| 2013 | −602 615 000 $ US | 1 676 935 000 $ US |
| 2012 | −987 461 000 $ US | 2 442 875 000 $ US |
| 2011 | −1 047 293 000 $ US | 1 845 062 000 $ US |
| 2010 | −573 628 000 $ US | 618 565 000 $ US |
| 2009 | −326 038 000 $ US | 220 957 000 $ US |
| 2008 | −970 563 000 $ US | 933 014 000 $ US |
| 2007 | −204 162 000 $ US | −24 438 000 $ US |
| 2006 | −296 905 000 $ US | −210 065 000 $ US |
| 2005 | −98 954 000 $ US | −242 762 000 $ US |
| 2004 | −86 603 000 $ US | −195 290 000 $ US |
| 2003 | −32 644 000 $ US | −109 783 000 $ US |
| 2002 | −43 699 000 $ US | −76 171 000 $ US |
| 2001 | 29 452 000 $ US | −62 658 000 $ US |
En 2025, selon la Turquie, son commerce de biens avec le Kazakhstan affichait un déficit de 1,47 milliard de dollars ; selon le Kazakhstan, son commerce de biens avec la Turquie affichait un excédent de 2,38 milliards de dollars. En 2001, les chiffres étaient un excédent de 29,5 millions de dollars pour la Turquie et un déficit de 62,7 millions de dollars pour le Kazakhstan.
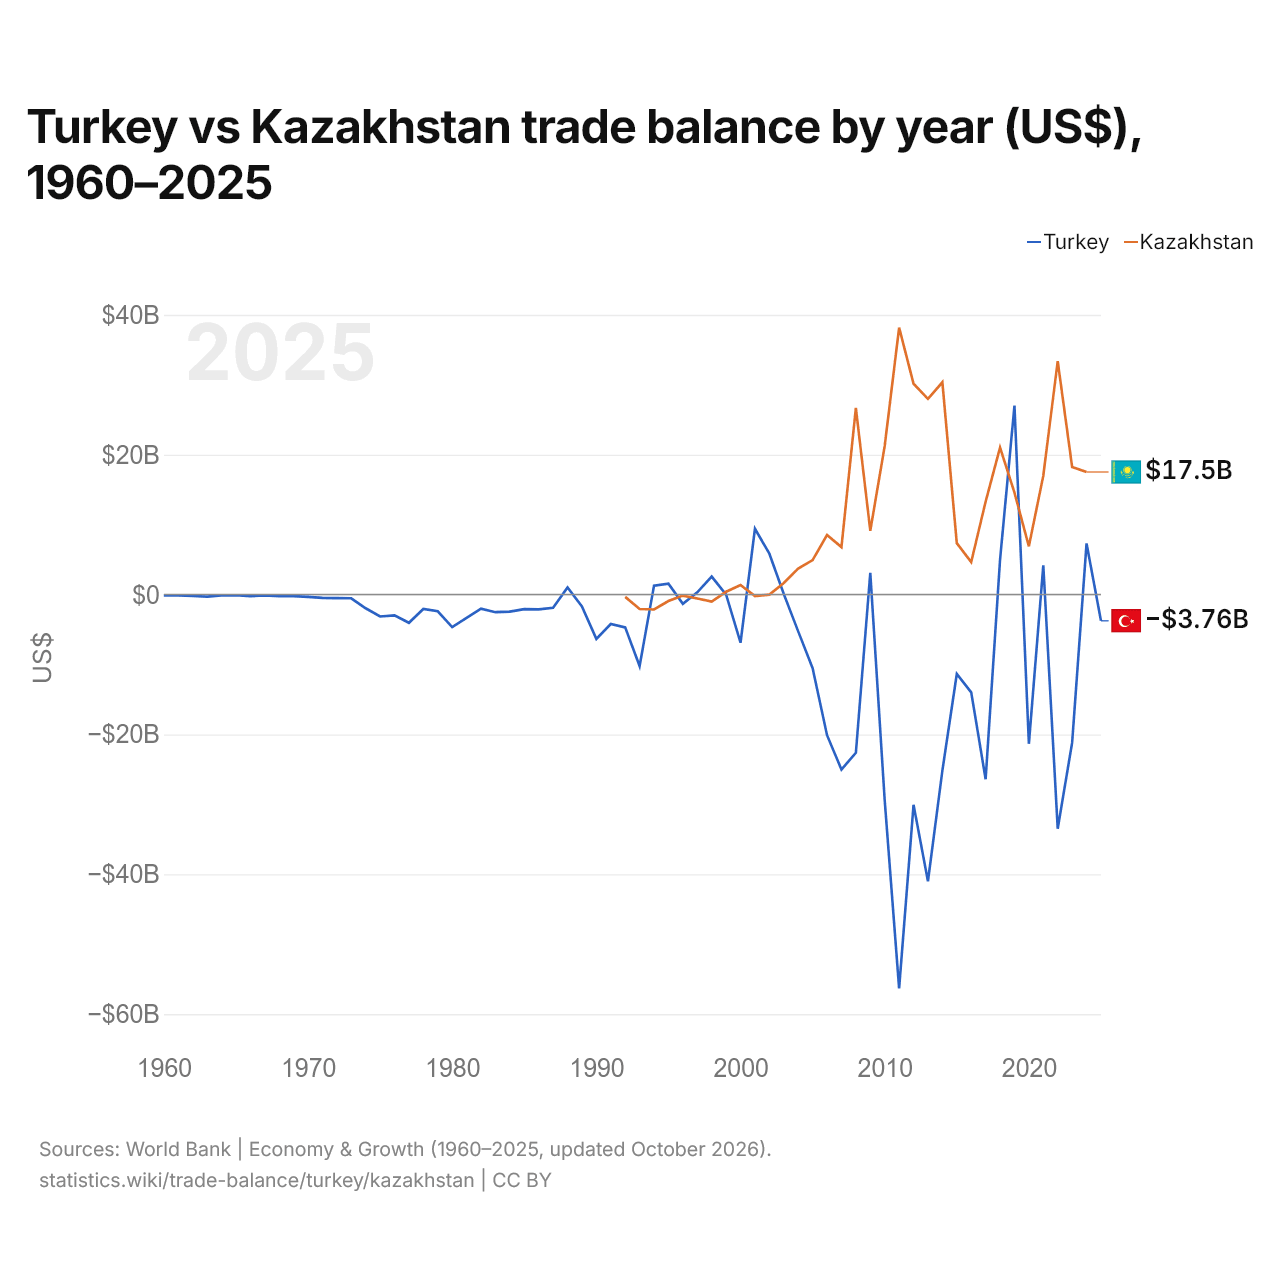
Turquie vs Kazakhstan : balance commerciale par année ($ US), 1960–2025
| Année | $ US | |
|---|---|---|
 Turquie |
 Kazakhstan |
|
| 2025 | −3 755 785 561 $ US | - |
| 2024 | 7 307 197 101 $ US | 17 526 662 793 $ US |
| 2023 | −21 181 731 331 $ US | 18 242 062 412 $ US |
| 2022 | −33 486 302 440 $ US | 33 381 806 961 $ US |
| 2021 | 4 185 993 617 $ US | 16 993 275 535 $ US |
| 2020 | −21 347 440 639 $ US | 6 896 965 280 $ US |
| 2019 | 27 009 801 864 $ US | 14 568 541 280 $ US |
| 2018 | 4 971 181 455 $ US | 21 023 093 624 $ US |
| 2017 | −26 405 711 552 $ US | 13 294 618 097 $ US |
| 2016 | −13 983 412 331 $ US | 4 634 764 145 $ US |
| 2015 | −11 366 572 353 $ US | 7 345 457 290 $ US |
| 2014 | −25 180 591 325 $ US | 30 359 360 963 $ US |
| 2013 | −41 005 981 821 $ US | 27 985 511 154 $ US |
| 2012 | −30 066 833 315 $ US | 30 150 627 211 $ US |
| 2011 | −56 314 976 402 $ US | 38 162 131 435 $ US |
| 2010 | −29 450 676 482 $ US | 21 244 932 306 $ US |
| 2009 | 3 116 333 325 $ US | 9 121 813 580 $ US |
| 2008 | −22 630 468 482 $ US | 26 685 614 540 $ US |
| 2007 | −25 026 651 296 $ US | 6 777 507 614 $ US |
| 2006 | −20 116 184 782 $ US | 8 503 031 471 $ US |
| 2005 | −10 528 378 745 $ US | 4 927 609 874 $ US |
| 2004 | −5 268 792 743 $ US | 3 707 426 030 $ US |
| 2003 | 66 756 414 $ US | 1 655 988 772 $ US |
| 2002 | 5 845 228 386 $ US | −12 417 865 $ US |
| 2001 | 9 400 731 322 $ US | −234 603 909 $ US |
| 2000 | −6 890 257 814 $ US | 1 372 843 343 $ US |
| 1999 | −12 805 916 $ US | 395 627 354 $ US |
| 1998 | 2 572 582 501 $ US | −999 578 141 $ US |
| 1997 | 308 677 444 $ US | −559 875 394 $ US |
| 1996 | −1 330 688 533 $ US | −154 812 541 $ US |
| 1995 | 1 537 801 287 $ US | −932 060 211 $ US |
| 1994 | 1 278 297 139 $ US | −2 136 185 716 $ US |
| 1993 | −10 228 639 053 $ US | −2 070 252 208 $ US |
| 1992 | −4 698 195 576 $ US | −330 578 512 $ US |
| 1991 | −4 219 534 995 $ US | - |
| 1990 | −6 346 799 540 $ US | - |
| 1989 | −1 690 292 177 $ US | - |
| 1988 | 1 000 632 911 $ US | - |
| 1987 | −1 897 782 964 $ US | - |
| 1986 | −2 110 962 963 $ US | - |
| 1985 | −2 087 931 034 $ US | - |
| 1984 | −2 437 602 180 $ US | - |
| 1983 | −2 524 444 444 $ US | - |
| 1982 | −2 029 447 853 $ US | - |
| 1981 | −3 322 522 523 $ US | - |
| 1980 | −4 656 578 947 $ US | - |
| 1979 | −2 387 096 774 $ US | - |
| 1978 | −2 070 833 333 $ US | - |
| 1977 | −4 044 444 444 $ US | - |
| 1976 | −2 987 500 000 $ US | - |
| 1975 | −3 135 714 286 $ US | - |
| 1974 | −1 964 285 714 $ US | - |
| 1973 | −535 714 286 $ US | - |
| 1972 | −521 428 571 $ US | - |
| 1971 | −473 333 333 $ US | - |
| 1970 | −345 454 545 $ US | - |
| 1969 | −222 222 222 $ US | - |
| 1968 | −244 444 444 $ US | - |
| 1967 | −133 333 333 $ US | - |
| 1966 | −222 222 222 $ US | - |
| 1965 | −100 000 000 $ US | - |
| 1964 | −111 111 111 $ US | - |
| 1963 | −288 888 889 $ US | - |
| 1962 | −211 111 111 $ US | - |
| 1961 | −133 333 333 $ US | - |
| 1960 | −122 222 222 $ US | - |
La balance commerciale de la Turquie affichait un excédent de 7,31 milliards de dollars (2024) et celle du Kazakhstan un excédent de 17,5 milliards de dollars (2024) ; l'excédent du Kazakhstan était 2,4 fois plus grand. En 1992, la balance commerciale de la Turquie affichait un déficit de 4,7 milliards de dollars et celle du Kazakhstan un déficit de 331 millions de dollars.
Depuis 1992, la balance commerciale de la Turquie a été excédentaire pendant 12 des 33 années, et celle du Kazakhstan pendant 24. Les balances commerciales de la Turquie et du Kazakhstan ont été déficitaires en même temps pendant 3 de ces années, la dernière fois en 1996.
Turquie vs Kazakhstan : chiffres de la balance commerciale
|
Turquie
|
Kazakhstan
|
|
|---|---|---|
| Biens et services, $ US | −3,76 Md $US (2025) | +17,5 Md $US (2024) |
| % du PIB | −0,2 % (2025) | +6,0 % (2024) |
| Années d'excédent depuis 2000 | 8 sur 26 | 23 sur 25 |
| Solde des biens entre les deux, chiffres propres | −1,47 Md $US (2025) | +2,38 Md $US (2025) |
| Premier excédent en biens avec | Irak (+10,4 Md $US, 2025) | Italie (+14,4 Md $US, 2025) |
| Premier déficit en biens avec | Chine (−46,3 Md $US, 2025) | Russie (−11,3 Md $US, 2025) |
Comparer la balance commerciale de 2 pays au choix
Sources :
- Banque mondiale | Économie et croissance (1960–2025, mis à jour en octobre 2026)
- TradeMap (2001–2025, mis à jour en octobre 2026)
Creative Commons Attribution (CC BY) : vous pouvez copier, partager, adapter et réutiliser ce contenu, y compris à des fins commerciales, à condition de citer statistics.wiki et d’indiquer les modifications apportées. Les sources citées ci-dessus peuvent avoir leurs propres conditions de licence.