
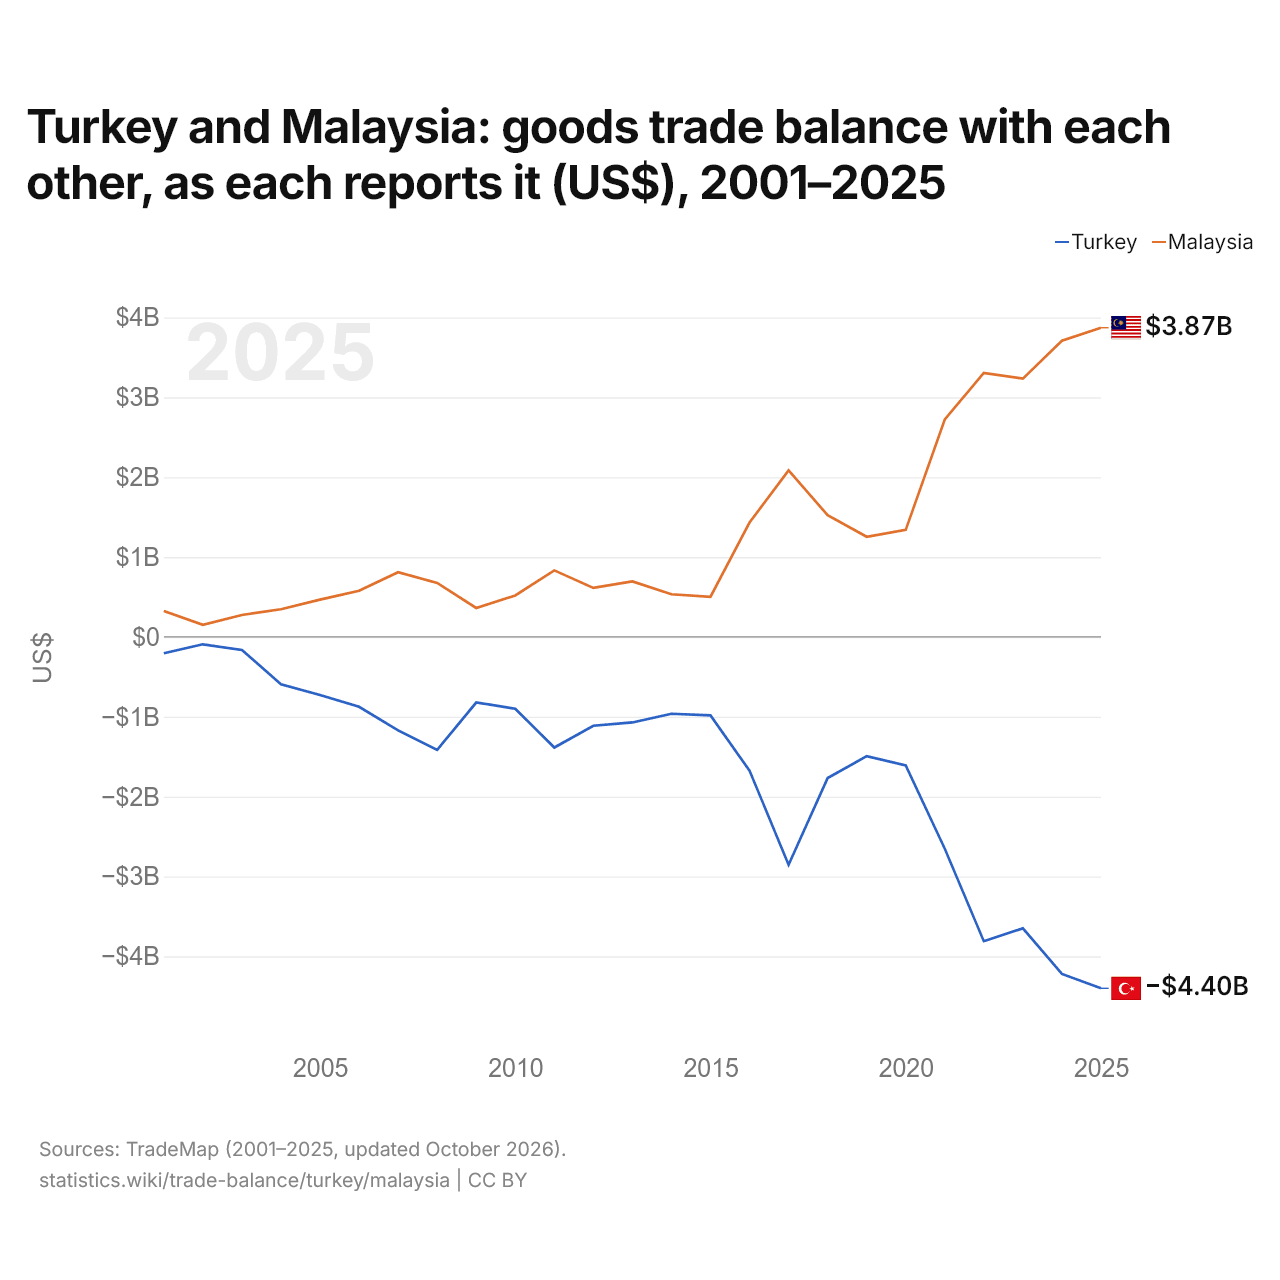
La Turquie et la Malaisie : solde de leur commerce de biens bilatéral, selon chacun ($ US), 2001–2025
| Année | $ US | |
|---|---|---|
| Turquie | Malaisie | |
| 2025 | −4 399 899 000 $ US | 3 871 874 000 $ US |
| 2024 | −4 219 983 000 $ US | 3 707 808 000 $ US |
| 2023 | −3 649 311 000 $ US | 3 233 706 000 $ US |
| 2022 | −3 810 446 000 $ US | 3 306 942 000 $ US |
| 2021 | −2 652 889 000 $ US | 2 723 004 000 $ US |
| 2020 | −1 608 689 000 $ US | 1 339 961 000 $ US |
| 2019 | −1 493 593 000 $ US | 1 254 047 000 $ US |
| 2018 | −1 767 573 000 $ US | 1 523 747 000 $ US |
| 2017 | −2 852 303 000 $ US | 2 085 171 000 $ US |
| 2016 | −1 675 322 000 $ US | 1 432 151 000 $ US |
| 2015 | −982 085 000 $ US | 503 024 000 $ US |
| 2014 | −962 065 000 $ US | 534 316 000 $ US |
| 2013 | −1 071 017 000 $ US | 694 500 000 $ US |
| 2012 | −1 112 773 000 $ US | 613 223 000 $ US |
| 2011 | −1 384 916 000 $ US | 833 122 000 $ US |
| 2010 | −899 193 000 $ US | 518 602 000 $ US |
| 2009 | −821 828 000 $ US | 362 922 000 $ US |
| 2008 | −1 414 137 000 $ US | 676 395 000 $ US |
| 2007 | −1 170 220 000 $ US | 809 659 000 $ US |
| 2006 | −874 298 000 $ US | 577 389 000 $ US |
| 2005 | −728 312 000 $ US | 467 298 000 $ US |
| 2004 | −594 294 000 $ US | 346 650 000 $ US |
| 2003 | −163 384 000 $ US | 274 975 000 $ US |
| 2002 | −92 643 000 $ US | 151 946 000 $ US |
| 2001 | −204 089 000 $ US | 323 948 000 $ US |
En 2025, selon la Turquie, son commerce de biens avec la Malaisie affichait un déficit de 4,4 milliards de dollars ; selon la Malaisie, son commerce de biens avec la Turquie affichait un excédent de 3,87 milliards de dollars. En 2001, les chiffres étaient un déficit de 204 millions de dollars pour la Turquie et un excédent de 324 millions de dollars pour la Malaisie.
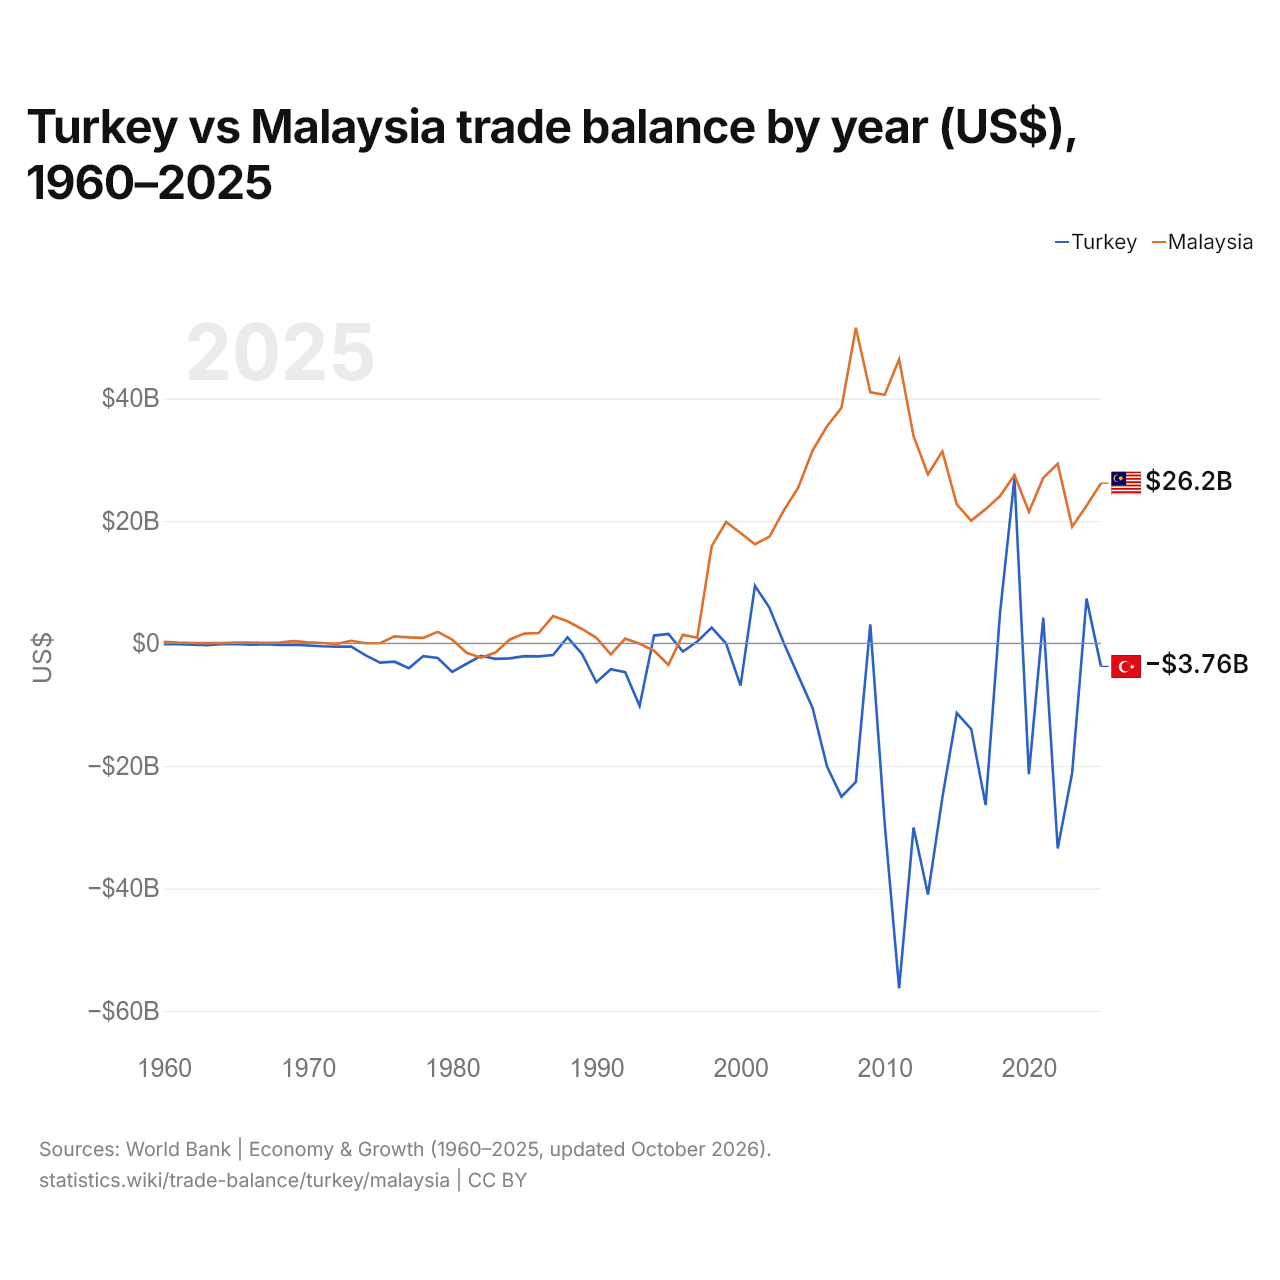
Turquie vs Malaisie : balance commerciale par année ($ US), 1960–2025
| Année | $ US | |
|---|---|---|
 Turquie |
 Malaisie |
|
| 2025 | −3 755 785 561 $ US | 26 155 524 757 $ US |
| 2024 | 7 307 197 101 $ US | 22 460 782 733 $ US |
| 2023 | −21 181 731 331 $ US | 19 055 372 040 $ US |
| 2022 | −33 486 302 440 $ US | 29 327 053 202 $ US |
| 2021 | 4 185 993 617 $ US | 27 025 058 299 $ US |
| 2020 | −21 347 440 639 $ US | 21 488 160 292 $ US |
| 2019 | 27 009 801 864 $ US | 27 486 823 562 $ US |
| 2018 | 4 971 181 455 $ US | 24 065 106 453 $ US |
| 2017 | −26 405 711 552 $ US | 21 917 407 075 $ US |
| 2016 | −13 983 412 331 $ US | 20 039 192 525 $ US |
| 2015 | −11 366 572 353 $ US | 22 683 943 184 $ US |
| 2014 | −25 180 591 325 $ US | 31 354 839 498 $ US |
| 2013 | −41 005 981 821 $ US | 27 598 385 101 $ US |
| 2012 | −30 066 833 315 $ US | 33 828 012 876 $ US |
| 2011 | −56 314 976 402 $ US | 46 400 608 104 $ US |
| 2010 | −29 450 676 482 $ US | 40 588 161 698 $ US |
| 2009 | 3 116 333 325 $ US | 41 006 916 436 $ US |
| 2008 | −22 630 468 482 $ US | 51 542 148 543 $ US |
| 2007 | −25 026 651 296 $ US | 38 460 318 906 $ US |
| 2006 | −20 116 184 782 $ US | 35 456 849 547 $ US |
| 2005 | −10 528 378 745 $ US | 31 496 198 138 $ US |
| 2004 | −5 268 792 743 $ US | 25 414 473 684 $ US |
| 2003 | 66 756 414 $ US | 21 700 789 474 $ US |
| 2002 | 5 845 228 386 $ US | 17 400 263 158 $ US |
| 2001 | 9 400 731 322 $ US | 16 181 842 105 $ US |
| 2000 | −6 890 257 814 $ US | 18 019 473 684 $ US |
| 1999 | −12 805 916 $ US | 19 828 157 895 $ US |
| 1998 | 2 572 582 501 $ US | 15 873 420 302 $ US |
| 1997 | 308 677 444 $ US | 913 833 487 $ US |
| 1996 | −1 330 688 533 $ US | 1 397 169 886 $ US |
| 1995 | 1 537 801 287 $ US | −3 490 430 622 $ US |
| 1994 | 1 278 297 139 $ US | −1 194 177 717 $ US |
| 1993 | −10 228 639 053 $ US | −66 819 601 $ US |
| 1992 | −4 698 195 576 $ US | 802 607 296 $ US |
| 1991 | −4 219 534 995 $ US | −1 798 807 099 $ US |
| 1990 | −6 346 799 540 $ US | 899 856 740 $ US |
| 1989 | −1 690 292 177 $ US | 2 355 988 278 $ US |
| 1988 | 1 000 632 911 $ US | 3 600 145 564 $ US |
| 1987 | −1 897 782 964 $ US | 4 463 339 575 $ US |
| 1986 | −2 110 962 963 $ US | 1 690 528 007 $ US |
| 1985 | −2 087 931 034 $ US | 1 601 261 678 $ US |
| 1984 | −2 437 602 180 $ US | 647 709 846 $ US |
| 1983 | −2 524 444 444 $ US | −1 505 654 281 $ US |
| 1982 | −2 029 447 853 $ US | −2 335 368 110 $ US |
| 1981 | −3 322 522 523 $ US | −1 546 357 077 $ US |
| 1980 | −4 656 578 947 $ US | 612 802 801 $ US |
| 1979 | −2 387 096 774 $ US | 1 882 617 862 $ US |
| 1978 | −2 070 833 333 $ US | 910 173 477 $ US |
| 1977 | −4 044 444 444 $ US | 986 477 378 $ US |
| 1976 | −2 987 500 000 $ US | 1 154 402 290 $ US |
| 1975 | −3 135 714 286 $ US | 42 055 296 $ US |
| 1974 | −1 964 285 714 $ US | 22 433 941 $ US |
| 1973 | −535 714 286 $ US | 431 787 765 $ US |
| 1972 | −521 428 571 $ US | −68 095 828 $ US |
| 1971 | −473 333 333 $ US | 60 938 452 $ US |
| 1970 | −345 454 545 $ US | 163 660 240 $ US |
| 1969 | −222 222 222 $ US | 373 707 215 $ US |
| 1968 | −244 444 444 $ US | 117 273 505 $ US |
| 1967 | −133 333 333 $ US | 77 746 781 $ US |
| 1966 | −222 222 222 $ US | 124 133 515 $ US |
| 1965 | −100 000 000 $ US | 132 300 194 $ US |
| 1964 | −111 111 111 $ US | 46 386 735 $ US |
| 1963 | −288 888 889 $ US | 43 446 730 $ US |
| 1962 | −211 111 111 $ US | 58 146 752 $ US |
| 1961 | −133 333 333 $ US | 130 993 525 $ US |
| 1960 | −122 222 222 $ US | 264 600 388 $ US |
En 2025, la balance commerciale de la Turquie affichait un déficit de 3,76 milliards de dollars et celle de la Malaisie un excédent de 26,2 milliards de dollars. En 1960, la balance commerciale de la Turquie affichait un déficit de 122 millions de dollars et celle de la Malaisie un excédent de 265 millions de dollars.
De 1960 à 2025, la balance commerciale de la Turquie a été excédentaire pendant 13 des 66 années, et celle de la Malaisie pendant 58. Les balances commerciales de la Turquie et de la Malaisie ont été déficitaires en même temps pendant 6 de ces années, la dernière fois en 1993.
Turquie vs Malaisie : chiffres de la balance commerciale
|
Turquie
|
Malaisie
|
|
|---|---|---|
| Biens et services, $ US | −3,76 Md $US (2025) | +26,2 Md $US (2025) |
| % du PIB | −0,2 % (2025) | +5,5 % (2025) |
| Années d'excédent depuis 2000 | 8 sur 26 | 26 sur 26 |
| Solde des biens entre les deux, chiffres propres | −4,40 Md $US (2025) | +3,87 Md $US (2025) |
| Premier excédent en biens avec | Irak (+10,4 Md $US, 2025) | États-Unis (+23,5 Md $US, 2025) |
| Premier déficit en biens avec | Chine (−46,3 Md $US, 2025) | Chine (−38,3 Md $US, 2025) |
Comparer la balance commerciale de 2 pays au choix
Sources :
- Banque mondiale | Économie et croissance (1960–2025, mis à jour en octobre 2026)
- TradeMap (2001–2025, mis à jour en octobre 2026)
Creative Commons Attribution (CC BY) : vous pouvez copier, partager, adapter et réutiliser ce contenu, y compris à des fins commerciales, à condition de citer statistics.wiki et d’indiquer les modifications apportées. Les sources citées ci-dessus peuvent avoir leurs propres conditions de licence.