
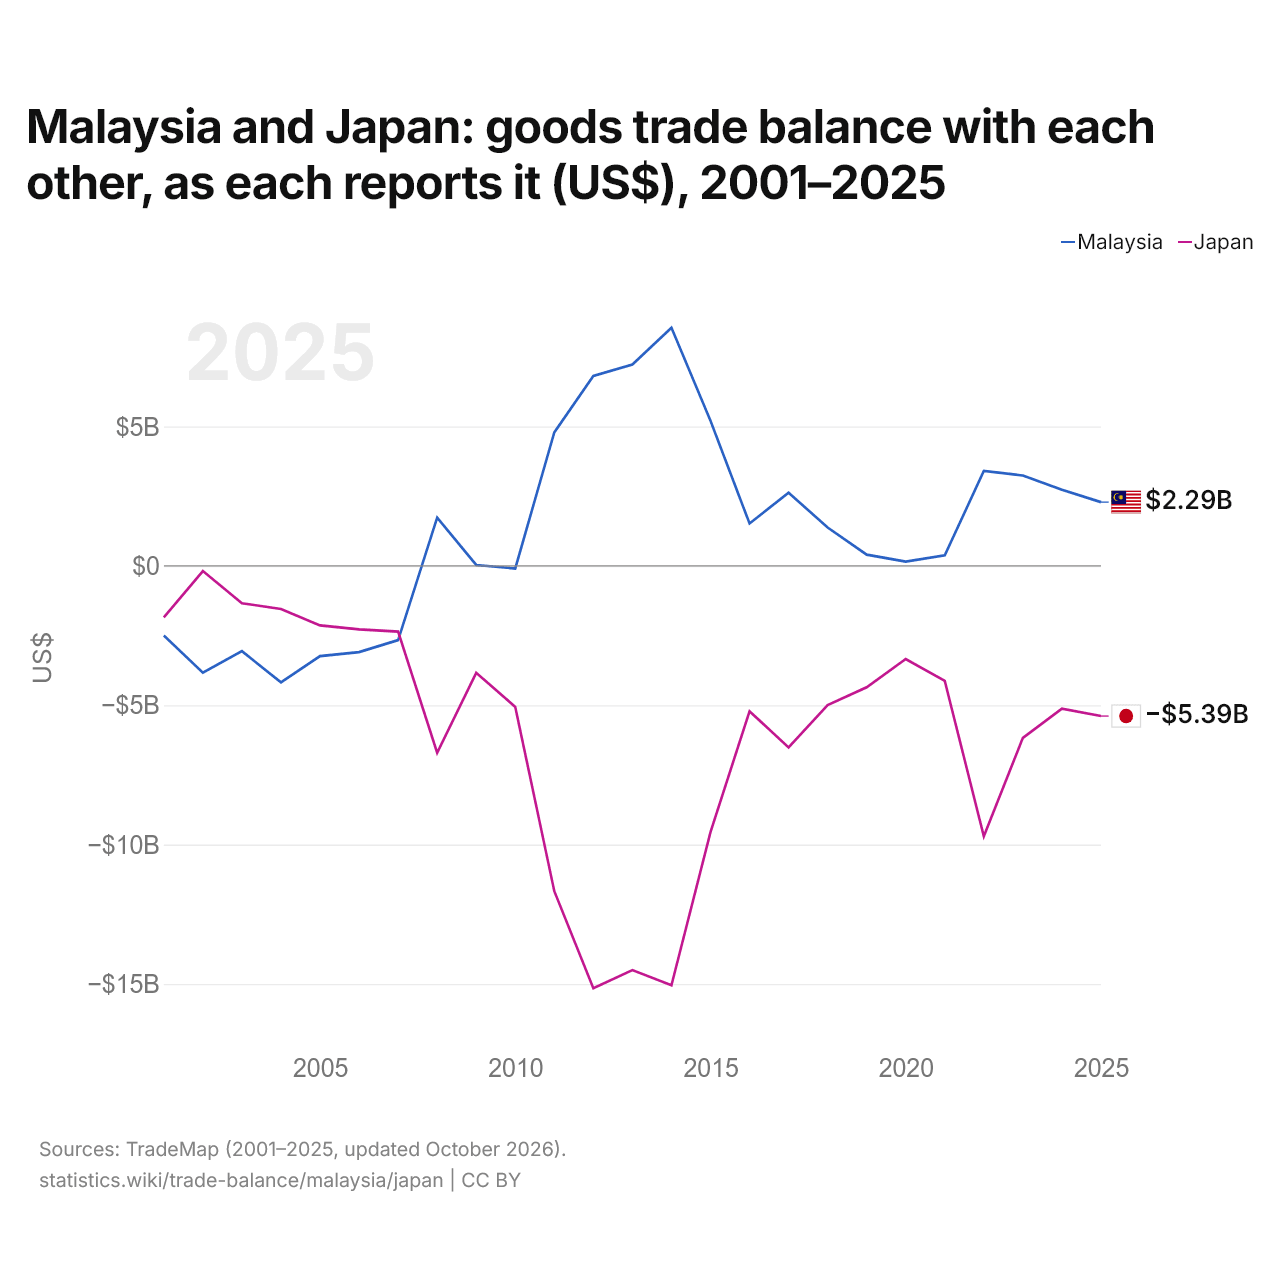
La Malaisie et le Japon : solde de leur commerce de biens bilatéral, selon chacun ($ US), 2001–2025
| Année | $ US | |
|---|---|---|
| Malaisie | Japon | |
| 2025 | 2 287 131 000 $ US | −5 388 797 000 $ US |
| 2024 | 2 730 614 000 $ US | −5 126 351 000 $ US |
| 2023 | 3 241 140 000 $ US | −6 170 202 000 $ US |
| 2022 | 3 406 789 000 $ US | −9 704 754 000 $ US |
| 2021 | 376 140 000 $ US | −4 126 870 000 $ US |
| 2020 | 154 419 000 $ US | −3 342 577 000 $ US |
| 2019 | 401 622 000 $ US | −4 357 671 000 $ US |
| 2018 | 1 375 982 000 $ US | −4 995 896 000 $ US |
| 2017 | 2 625 859 000 $ US | −6 514 706 000 $ US |
| 2016 | 1 520 829 000 $ US | −5 215 457 000 $ US |
| 2015 | 5 208 885 000 $ US | −9 552 729 000 $ US |
| 2014 | 8 545 601 000 $ US | −15 048 296 000 $ US |
| 2013 | 7 227 132 000 $ US | −14 504 961 000 $ US |
| 2012 | 6 816 363 000 $ US | −15 157 777 000 $ US |
| 2011 | 4 788 405 000 $ US | −11 673 218 000 $ US |
| 2010 | −93 284 000 $ US | −5 059 403 000 $ US |
| 2009 | 32 008 000 $ US | −3 837 464 000 $ US |
| 2008 | 1 732 756 000 $ US | −6 707 351 000 $ US |
| 2007 | −2 662 827 000 $ US | −2 359 052 000 $ US |
| 2006 | −3 096 266 000 $ US | −2 277 122 000 $ US |
| 2005 | −3 238 727 000 $ US | −2 138 220 000 $ US |
| 2004 | −4 181 598 000 $ US | −1 545 834 000 $ US |
| 2003 | −3 060 538 000 $ US | −1 339 730 000 $ US |
| 2002 | −3 832 724 000 $ US | −186 819 000 $ US |
| 2001 | −2 499 825 000 $ US | −1 845 522 000 $ US |
En 2025, selon la Malaisie, son commerce de biens avec le Japon affichait un excédent de 2,29 milliards de dollars ; selon le Japon, son commerce de biens avec la Malaisie affichait un déficit de 5,39 milliards de dollars. En 2001, les chiffres étaient un déficit de 2,5 milliards de dollars pour la Malaisie et un déficit de 1,85 milliard de dollars pour le Japon.
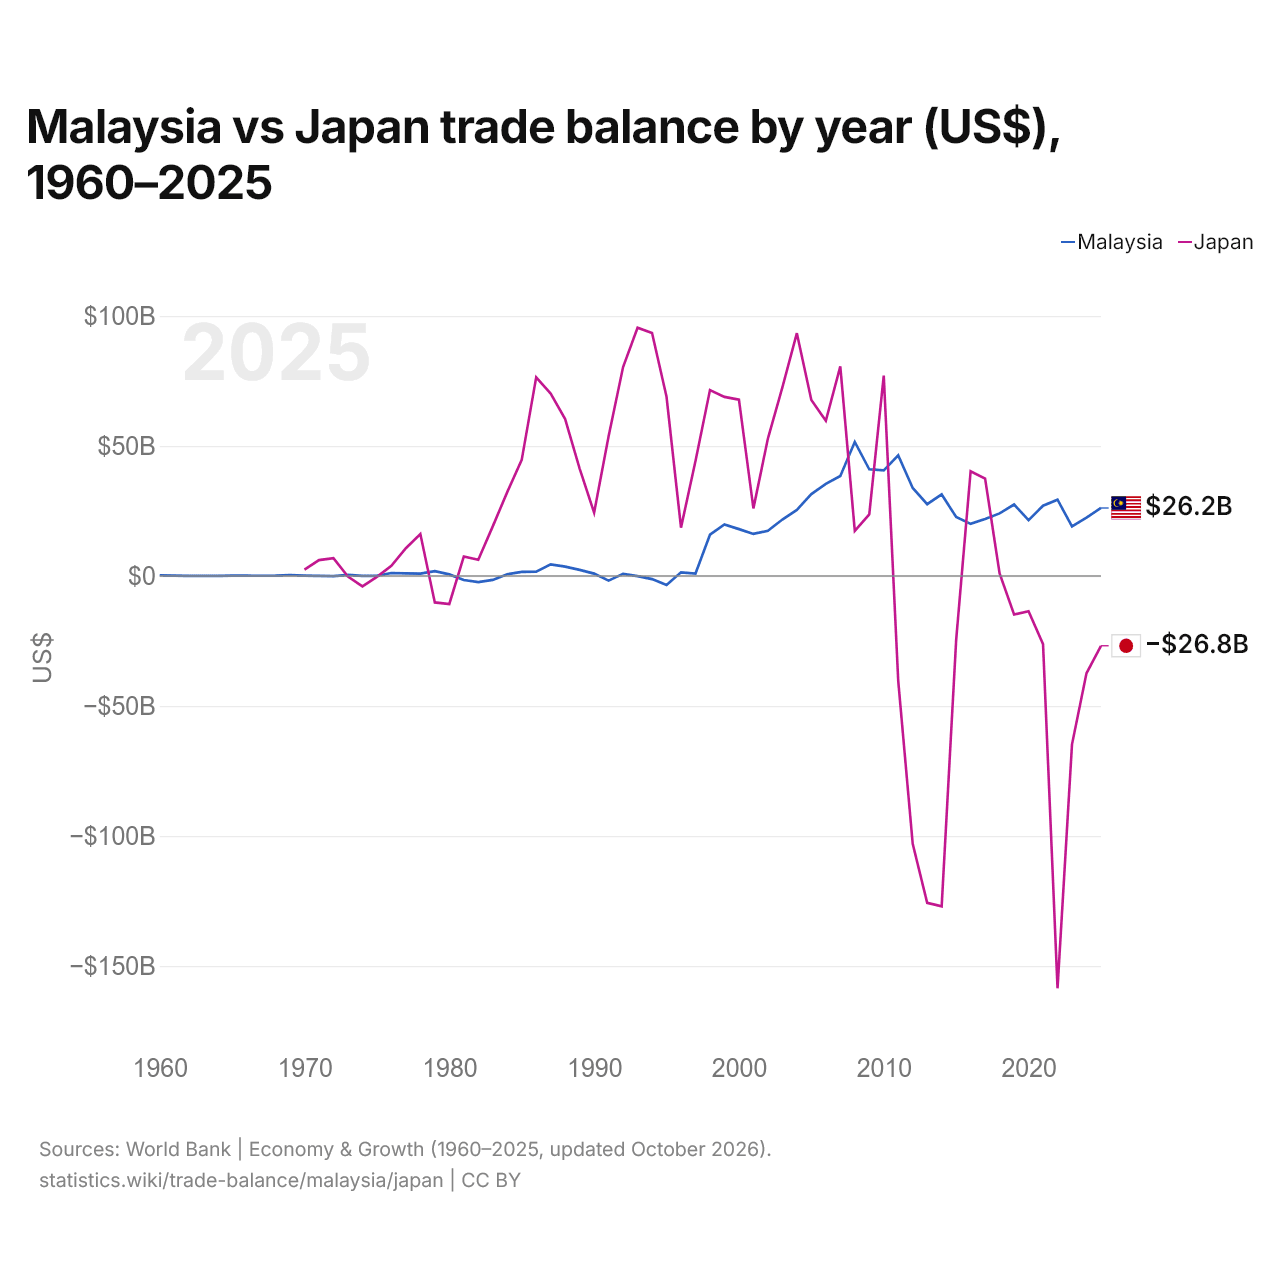
Malaisie vs Japon : balance commerciale par année ($ US), 1960–2025
| Année | $ US | |
|---|---|---|
 Malaisie |
 Japon |
|
| 2025 | 26 155 524 757 $ US | −26 840 701 298 $ US |
| 2024 | 22 460 782 733 $ US | −37 421 806 079 $ US |
| 2023 | 19 055 372 040 $ US | −64 740 755 791 $ US |
| 2022 | 29 327 053 202 $ US | −158 565 740 395 $ US |
| 2021 | 27 025 058 299 $ US | −26 203 979 027 $ US |
| 2020 | 21 488 160 292 $ US | −13 587 503 404 $ US |
| 2019 | 27 486 823 562 $ US | −14 829 877 577 $ US |
| 2018 | 24 065 106 453 $ US | 964 471 415 $ US |
| 2017 | 21 917 407 075 $ US | 37 424 841 039 $ US |
| 2016 | 20 039 192 525 $ US | 40 295 828 111 $ US |
| 2015 | 22 683 943 184 $ US | −24 640 621 321 $ US |
| 2014 | 31 354 839 498 $ US | −127 067 136 943 $ US |
| 2013 | 27 598 385 101 $ US | −125 688 992 897 $ US |
| 2012 | 33 828 012 876 $ US | −103 017 334 054 $ US |
| 2011 | 46 400 608 104 $ US | −40 334 797 700 $ US |
| 2010 | 40 588 161 698 $ US | 77 030 184 880 $ US |
| 2009 | 41 006 916 436 $ US | 23 690 260 030 $ US |
| 2008 | 51 542 148 543 $ US | 17 356 895 109 $ US |
| 2007 | 38 460 318 906 $ US | 80 582 742 763 $ US |
| 2006 | 35 456 849 547 $ US | 59 659 000 527 $ US |
| 2005 | 31 496 198 138 $ US | 67 663 961 124 $ US |
| 2004 | 25 414 473 684 $ US | 93 354 468 404 $ US |
| 2003 | 21 700 789 474 $ US | 72 560 562 736 $ US |
| 2002 | 17 400 263 158 $ US | 52 861 517 849 $ US |
| 2001 | 16 181 842 105 $ US | 25 985 588 613 $ US |
| 2000 | 18 019 473 684 $ US | 67 799 063 708 $ US |
| 1999 | 19 828 157 895 $ US | 68 865 072 147 $ US |
| 1998 | 15 873 420 302 $ US | 71 492 903 649 $ US |
| 1997 | 913 833 487 $ US | 44 200 018 348 $ US |
| 1996 | 1 397 169 886 $ US | 18 591 806 698 $ US |
| 1995 | −3 490 430 622 $ US | 68 922 257 802 $ US |
| 1994 | −1 194 177 717 $ US | 93 444 922 990 $ US |
| 1993 | −66 819 601 $ US | 95 479 406 967 $ US |
| 1992 | 802 607 296 $ US | 80 350 537 263 $ US |
| 1991 | −1 798 807 099 $ US | 53 732 293 939 $ US |
| 1990 | 899 856 740 $ US | 24 355 543 277 $ US |
| 1989 | 2 355 988 278 $ US | 41 293 261 160 $ US |
| 1988 | 3 600 145 564 $ US | 60 323 819 348 $ US |
| 1987 | 4 463 339 575 $ US | 70 124 276 208 $ US |
| 1986 | 1 690 528 007 $ US | 76 375 001 632 $ US |
| 1985 | 1 601 261 678 $ US | 44 629 778 842 $ US |
| 1984 | 647 709 846 $ US | 32 246 208 254 $ US |
| 1983 | −1 505 654 281 $ US | 19 079 902 169 $ US |
| 1982 | −2 335 368 110 $ US | 6 219 770 858 $ US |
| 1981 | −1 546 357 077 $ US | 7 475 883 734 $ US |
| 1980 | 612 802 801 $ US | −10 762 068 406 $ US |
| 1979 | 1 882 617 862 $ US | −10 178 503 568 $ US |
| 1978 | 910 173 477 $ US | 16 145 734 415 $ US |
| 1977 | 986 477 378 $ US | 10 673 368 053 $ US |
| 1976 | 1 154 402 290 $ US | 3 911 996 800 $ US |
| 1975 | 42 055 296 $ US | −316 462 115 $ US |
| 1974 | 22 433 941 $ US | −3 967 665 540 $ US |
| 1973 | 431 787 765 $ US | −231 313 286 $ US |
| 1972 | −68 095 828 $ US | 6 834 642 809 $ US |
| 1971 | 60 938 452 $ US | 6 099 709 614 $ US |
| 1970 | 163 660 240 $ US | 2 454 150 061 $ US |
| 1969 | 373 707 215 $ US | - |
| 1968 | 117 273 505 $ US | - |
| 1967 | 77 746 781 $ US | - |
| 1966 | 124 133 515 $ US | - |
| 1965 | 132 300 194 $ US | - |
| 1964 | 46 386 735 $ US | - |
| 1963 | 43 446 730 $ US | - |
| 1962 | 58 146 752 $ US | - |
| 1961 | 130 993 525 $ US | - |
| 1960 | 264 600 388 $ US | - |
En 2025, la balance commerciale de la Malaisie affichait un excédent de 26,2 milliards de dollars et celle du Japon un déficit de 26,8 milliards de dollars. En 1970, la balance commerciale de la Malaisie affichait un excédent de 164 millions de dollars et celle du Japon un excédent de 2,45 milliards de dollars.
De 1970 à 2025, la balance commerciale de la Malaisie a été excédentaire pendant 48 des 56 années, et celle du Japon pendant 39. Les balances commerciales de la Malaisie et du Japon n'ont jamais été déficitaires la même année.
Malaisie vs Japon : chiffres de la balance commerciale
|
Malaisie
|
Japon
|
|
|---|---|---|
| Biens et services, $ US | +26,2 Md $US (2025) | −26,8 Md $US (2025) |
| % du PIB | +5,5 % (2025) | −0,6 % (2025) |
| Années d'excédent depuis 2000 | 26 sur 26 | 14 sur 26 |
| Solde des biens entre les deux, chiffres propres | +2,29 Md $US (2025) | −5,39 Md $US (2025) |
| Premier excédent en biens avec | États-Unis (+23,5 Md $US, 2025) | États-Unis (+49,5 Md $US, 2025) |
| Premier déficit en biens avec | Chine (−38,3 Md $US, 2025) | Chine (−53,0 Md $US, 2025) |
Comparer la balance commerciale de 2 pays au choix
Sources :
- Banque mondiale | Économie et croissance (1960–2025, mis à jour en octobre 2026)
- TradeMap (2001–2025, mis à jour en octobre 2026)
Creative Commons Attribution (CC BY) : vous pouvez copier, partager, adapter et réutiliser ce contenu, y compris à des fins commerciales, à condition de citer statistics.wiki et d’indiquer les modifications apportées. Les sources citées ci-dessus peuvent avoir leurs propres conditions de licence.