
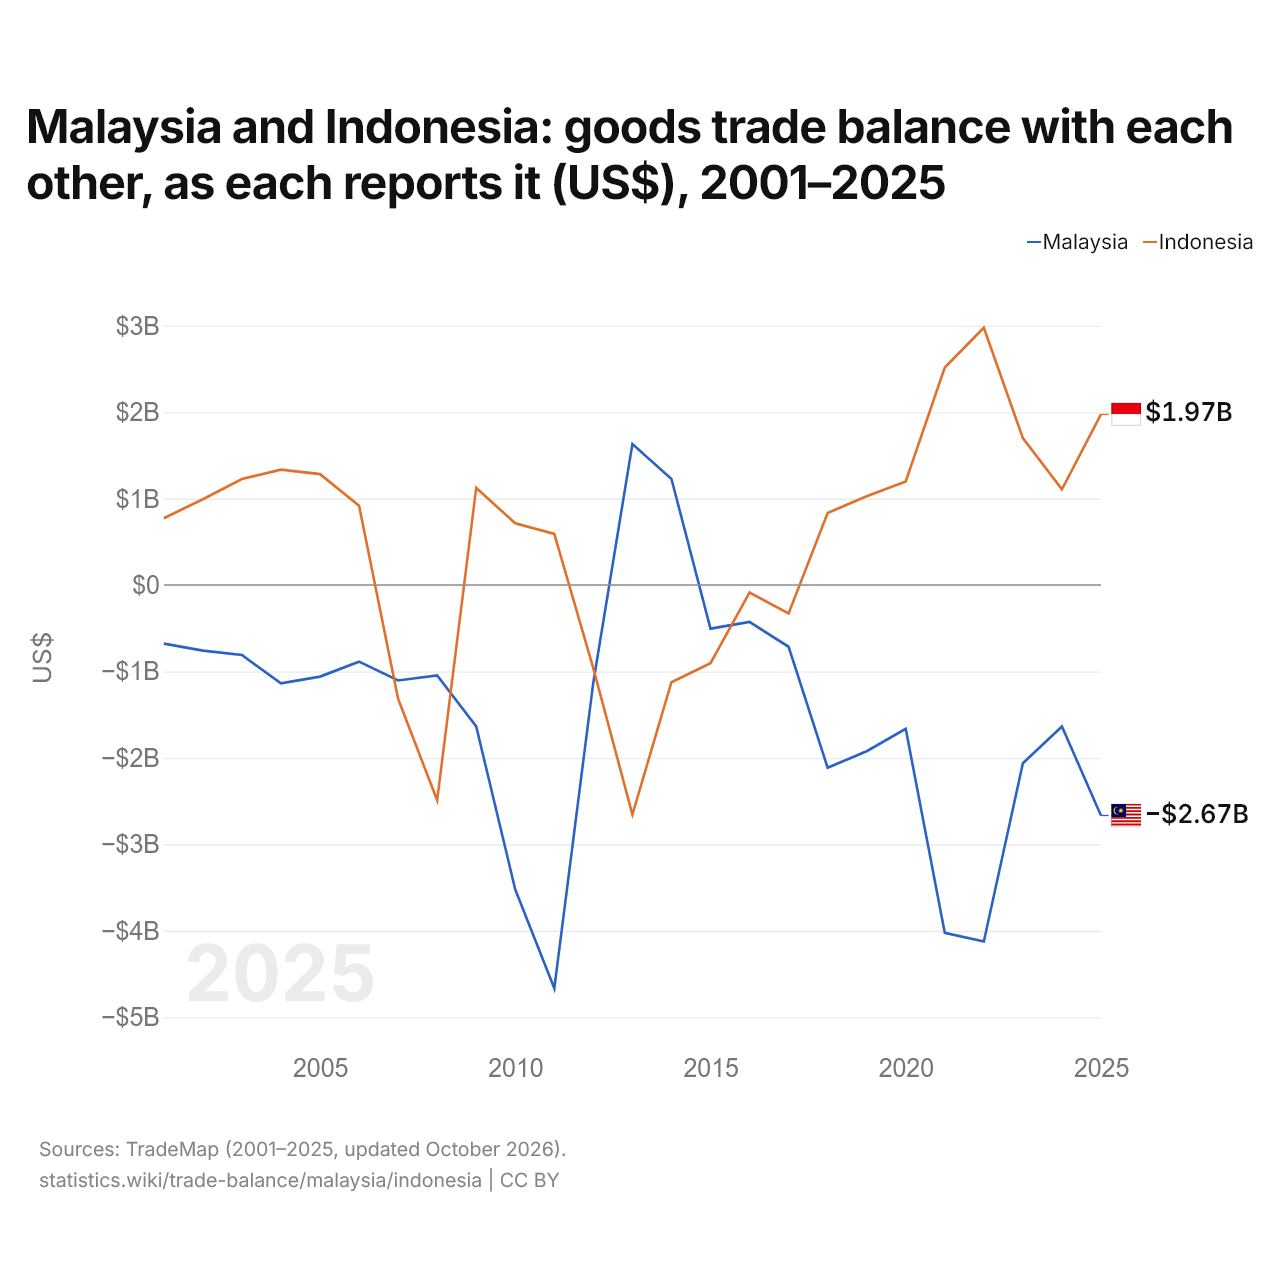
La Malaisie et l'Indonésie : solde de leur commerce de biens bilatéral, selon chacun ($ US), 2001–2025
| Année | $ US | |
|---|---|---|
| Malaisie | Indonésie | |
| 2025 | −2 665 862 000 $ US | 1 974 601 000 $ US |
| 2024 | −1 636 852 000 $ US | 1 105 645 000 $ US |
| 2023 | −2 062 460 000 $ US | 1 699 712 000 $ US |
| 2022 | −4 123 970 000 $ US | 2 976 796 000 $ US |
| 2021 | −4 023 595 000 $ US | 2 517 037 000 $ US |
| 2020 | −1 663 977 000 $ US | 1 197 603 000 $ US |
| 2019 | −1 923 299 000 $ US | 1 026 541 000 $ US |
| 2018 | −2 113 650 000 $ US | 833 882 000 $ US |
| 2017 | −714 199 000 $ US | −329 207 000 $ US |
| 2016 | −427 321 000 $ US | −87 840 000 $ US |
| 2015 | −504 560 000 $ US | −903 725 000 $ US |
| 2014 | 1 227 907 000 $ US | −1 123 853 000 $ US |
| 2013 | 1 630 806 000 $ US | −2 655 924 000 $ US |
| 2012 | −1 123 713 000 $ US | −963 288 000 $ US |
| 2011 | −4 665 294 000 $ US | 590 980 000 $ US |
| 2010 | −3 522 285 000 $ US | 713 611 000 $ US |
| 2009 | −1 635 382 000 $ US | 1 123 393 000 $ US |
| 2008 | −1 044 606 000 $ US | −2 490 593 000 $ US |
| 2007 | −1 104 172 000 $ US | −1 315 863 000 $ US |
| 2006 | −886 277 000 $ US | 917 423 000 $ US |
| 2005 | −1 059 553 000 $ US | 1 282 774 000 $ US |
| 2004 | −1 138 256 000 $ US | 1 334 102 000 $ US |
| 2003 | −809 856 000 $ US | 1 225 661 000 $ US |
| 2002 | −759 042 000 $ US | 992 547 000 $ US |
| 2001 | −678 266 000 $ US | 773 162 000 $ US |
En 2025, selon la Malaisie, son commerce de biens avec l'Indonésie affichait un déficit de 2,67 milliards de dollars ; selon l'Indonésie, son commerce de biens avec la Malaisie affichait un excédent de 1,97 milliard de dollars. En 2001, les chiffres étaient un déficit de 678 millions de dollars pour la Malaisie et un excédent de 773 millions de dollars pour l'Indonésie.
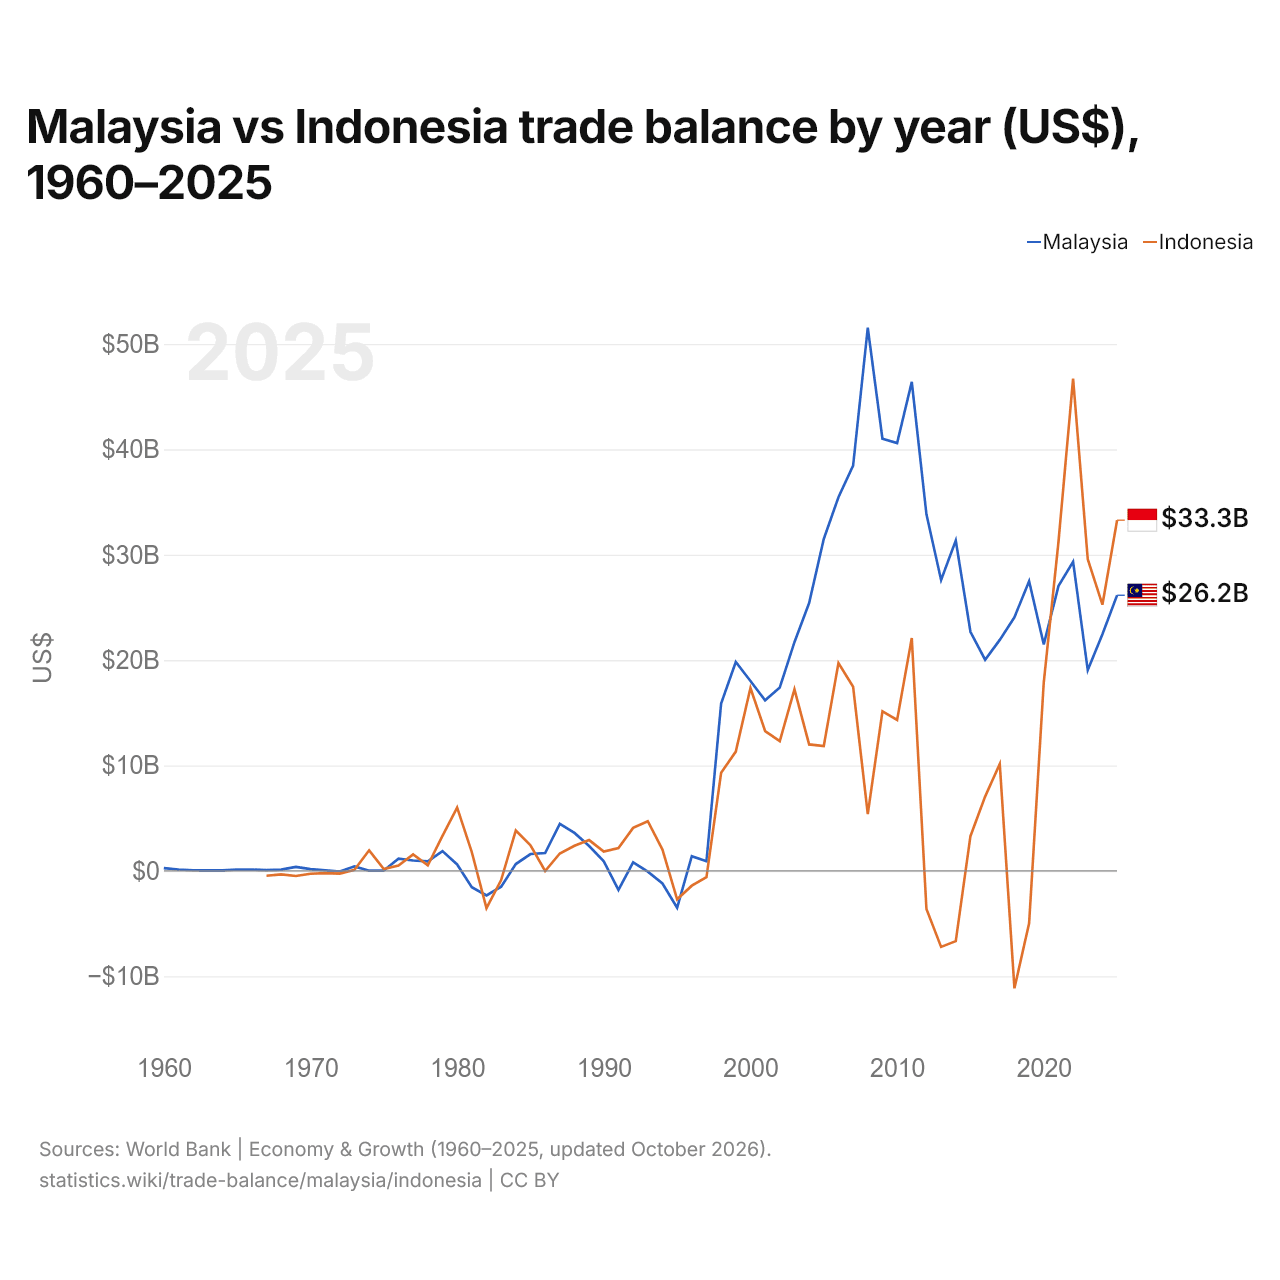
Malaisie vs Indonésie : balance commerciale par année ($ US), 1960–2025
| Année | $ US | |
|---|---|---|
 Malaisie |
 Indonésie |
|
| 2025 | 26 155 524 757 $ US | 33 277 095 524 $ US |
| 2024 | 22 460 782 733 $ US | 25 264 121 428 $ US |
| 2023 | 19 055 372 040 $ US | 29 571 270 062 $ US |
| 2022 | 29 327 053 202 $ US | 46 711 393 458 $ US |
| 2021 | 27 025 058 299 $ US | 31 185 663 099 $ US |
| 2020 | 21 488 160 292 $ US | 17 899 733 715 $ US |
| 2019 | 27 486 823 562 $ US | −4 976 882 676 $ US |
| 2018 | 24 065 106 453 $ US | −11 139 964 499 $ US |
| 2017 | 21 917 407 075 $ US | 10 147 166 713 $ US |
| 2016 | 20 039 192 525 $ US | 7 051 011 915 $ US |
| 2015 | 22 683 943 184 $ US | 3 294 646 496 $ US |
| 2014 | 31 354 839 498 $ US | −6 665 132 939 $ US |
| 2013 | 27 598 385 101 $ US | −7 210 947 472 $ US |
| 2012 | 33 828 012 876 $ US | −3 617 699 112 $ US |
| 2011 | 46 400 608 104 $ US | 22 098 243 866 $ US |
| 2010 | 40 588 161 698 $ US | 14 322 535 351 $ US |
| 2009 | 41 006 916 436 $ US | 15 141 253 737 $ US |
| 2008 | 51 542 148 543 $ US | 5 383 772 872 $ US |
| 2007 | 38 460 318 906 $ US | 17 471 008 752 $ US |
| 2006 | 35 456 849 547 $ US | 19 731 671 212 $ US |
| 2005 | 31 496 198 138 $ US | 11 853 826 412 $ US |
| 2004 | 25 414 473 684 $ US | 11 999 661 267 $ US |
| 2003 | 21 700 789 474 $ US | 17 229 518 703 $ US |
| 2002 | 17 400 263 158 $ US | 12 318 361 644 $ US |
| 2001 | 16 181 842 105 $ US | 13 270 680 432 $ US |
| 2000 | 18 019 473 684 $ US | 17 356 482 696 $ US |
| 1999 | 19 828 157 895 $ US | 11 318 192 667 $ US |
| 1998 | 15 873 420 302 $ US | 9 306 014 193 $ US |
| 1997 | 913 833 487 $ US | −594 112 855 $ US |
| 1996 | 1 397 169 886 $ US | −1 399 777 996 $ US |
| 1995 | −3 490 430 622 $ US | −2 696 966 882 $ US |
| 1994 | −1 194 177 717 $ US | 2 026 749 971 $ US |
| 1993 | −66 819 601 $ US | 4 718 460 796 $ US |
| 1992 | 802 607 296 $ US | 4 080 850 477 $ US |
| 1991 | −1 798 807 099 $ US | 2 172 617 938 $ US |
| 1990 | 899 856 740 $ US | 1 825 255 936 $ US |
| 1989 | 2 355 988 278 $ US | 2 921 595 781 $ US |
| 1988 | 3 600 145 564 $ US | 2 384 647 397 $ US |
| 1987 | 4 463 339 575 $ US | 1 654 773 878 $ US |
| 1986 | 1 690 528 007 $ US | −14 658 183 $ US |
| 1985 | 1 601 261 678 $ US | 2 419 636 586 $ US |
| 1984 | 647 709 846 $ US | 3 834 824 869 $ US |
| 1983 | −1 505 654 281 $ US | −865 978 918 $ US |
| 1982 | −2 335 368 110 $ US | −3 532 551 269 $ US |
| 1981 | −1 546 357 077 $ US | 1 781 847 509 $ US |
| 1980 | 612 802 801 $ US | 6 011 898 212 $ US |
| 1979 | 1 882 617 862 $ US | 3 328 732 396 $ US |
| 1978 | 910 173 477 $ US | 524 601 304 $ US |
| 1977 | 986 477 378 $ US | 1 562 891 566 $ US |
| 1976 | 1 154 402 290 $ US | 500 000 000 $ US |
| 1975 | 42 055 296 $ US | 174 939 759 $ US |
| 1974 | 22 433 941 $ US | 1 955 180 723 $ US |
| 1973 | 431 787 765 $ US | 93 253 012 $ US |
| 1972 | −68 095 828 $ US | −261 686 747 $ US |
| 1971 | 60 938 452 $ US | −207 411 919 $ US |
| 1970 | 163 660 240 $ US | −273 972 603 $ US |
| 1969 | 373 707 215 $ US | −484 662 577 $ US |
| 1968 | 117 273 505 $ US | −333 117 339 $ US |
| 1967 | 77 746 781 $ US | −458 608 286 $ US |
| 1966 | 124 133 515 $ US | - |
| 1965 | 132 300 194 $ US | - |
| 1964 | 46 386 735 $ US | - |
| 1963 | 43 446 730 $ US | - |
| 1962 | 58 146 752 $ US | - |
| 1961 | 130 993 525 $ US | - |
| 1960 | 264 600 388 $ US | - |
En 2025, la balance commerciale de la Malaisie affichait un excédent de 26,2 milliards de dollars et celle de l'Indonésie un excédent de 33,3 milliards de dollars ; l'excédent de l'Indonésie était plus grand de 27 %. En 1967, la balance commerciale de la Malaisie affichait un excédent de 77,7 millions de dollars et celle de l'Indonésie un déficit de 459 millions de dollars.
De 1967 à 2025, la balance commerciale de la Malaisie a été excédentaire pendant 51 des 59 années, et celle de l'Indonésie pendant 42. Les balances commerciales de la Malaisie et de l'Indonésie ont été déficitaires en même temps pendant 4 de ces années, la dernière fois en 1995.
Malaisie vs Indonésie : chiffres de la balance commerciale
|
Malaisie
|
Indonésie
|
|
|---|---|---|
| Biens et services, $ US | +26,2 Md $US (2025) | +33,3 Md $US (2025) |
| % du PIB | +5,5 % (2025) | +2,3 % (2025) |
| Années d'excédent depuis 2000 | 26 sur 26 | 21 sur 26 |
| Solde des biens entre les deux, chiffres propres | −2,67 Md $US (2025) | +1,97 Md $US (2025) |
| Premier excédent en biens avec | États-Unis (+23,5 Md $US, 2025) | États-Unis (+18,1 Md $US, 2025) |
| Premier déficit en biens avec | Chine (−38,3 Md $US, 2025) | Chine (−20,5 Md $US, 2025) |
Comparer la balance commerciale de 2 pays au choix
Sources :
- Banque mondiale | Économie et croissance (1960–2025, mis à jour en octobre 2026)
- TradeMap (2001–2025, mis à jour en octobre 2026)
Creative Commons Attribution (CC BY) : vous pouvez copier, partager, adapter et réutiliser ce contenu, y compris à des fins commerciales, à condition de citer statistics.wiki et d’indiquer les modifications apportées. Les sources citées ci-dessus peuvent avoir leurs propres conditions de licence.