
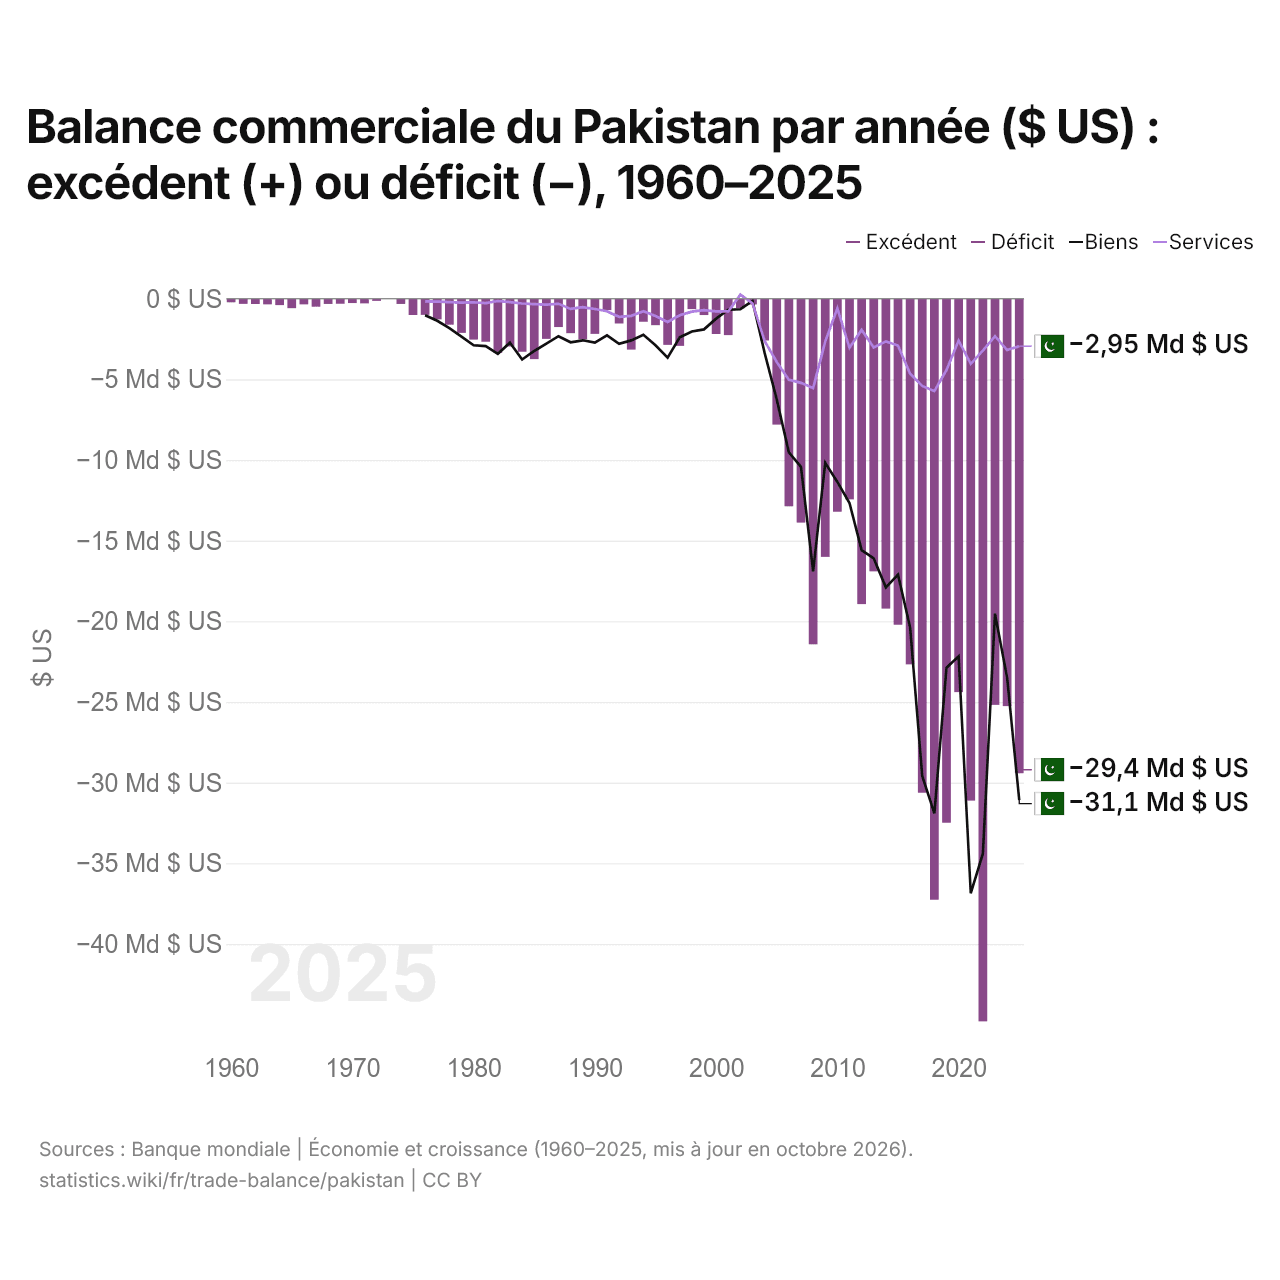
Balance commerciale du Pakistan par année ($ US) : excédent (+) ou déficit (−), 1960–2025
| Année | $ US | ||
|---|---|---|---|
| Biens et services | Biens | Services | |
| 2025 | −29 420 304 991 $ US | −31 085 000 000 $ US | −2 949 083 800 $ US |
| 2024 | −25 257 703 998 $ US | −23 501 000 000 $ US | −3 188 816 958 $ US |
| 2023 | −25 183 381 482 $ US | −19 528 000 000 $ US | −2 326 115 537 $ US |
| 2022 | −44 800 038 644 $ US | −34 407 000 000 $ US | −3 220 107 000 $ US |
| 2021 | −31 112 850 067 $ US | −36 859 000 000 $ US | −4 043 106 000 $ US |
| 2020 | −24 392 041 495 $ US | −22 172 000 000 $ US | −2 592 874 000 $ US |
| 2019 | −32 488 393 369 $ US | −22 881 000 000 $ US | −4 424 928 000 $ US |
| 2018 | −37 259 759 399 $ US | −31 911 000 000 $ US | −5 736 987 000 $ US |
| 2017 | −30 626 231 103 $ US | −29 594 000 000 $ US | −5 412 621 000 $ US |
| 2016 | −22 669 632 006 $ US | −20 380 000 000 $ US | −4 656 898 000 $ US |
| 2015 | −20 214 678 694 $ US | −17 108 000 000 $ US | −2 910 000 000 $ US |
| 2014 | −19 214 125 936 $ US | −17 898 000 000 $ US | −2 649 000 000 $ US |
| 2013 | −16 903 963 808 $ US | −16 099 000 000 $ US | −3 025 000 000 $ US |
| 2012 | −18 935 710 905 $ US | −15 593 000 000 $ US | −1 935 000 000 $ US |
| 2011 | −12 445 976 549 $ US | −12 667 000 000 $ US | −3 051 000 000 $ US |
| 2010 | −13 208 171 673 $ US | −11 362 000 000 $ US | −598 000 000 $ US |
| 2009 | −16 007 846 667 $ US | −10 180 000 000 $ US | −2 658 430 000 $ US |
| 2008 | −21 428 199 020 $ US | −16 908 500 000 $ US | −5 548 000 000 $ US |
| 2007 | −13 880 038 493 $ US | −10 421 000 000 $ US | −5 219 000 000 $ US |
| 2006 | −12 871 731 104 $ US | −9 532 000 000 $ US | −5 026 000 000 $ US |
| 2005 | −7 804 685 162 $ US | −6 242 200 000 $ US | −3 928 000 000 $ US |
| 2004 | −2 594 600 000 $ US | −3 362 000 000 $ US | −2 617 990 000 $ US |
| 2003 | −360 568 550 $ US | −142 000 000 $ US | −293 000 000 $ US |
| 2002 | −590 557 973 $ US | −655 000 000 $ US | 247 000 000 $ US |
| 2001 | −2 258 502 233 $ US | −688 000 000 $ US | −793 000 000 $ US |
| 2000 | −2 189 374 438 $ US | −1 239 000 000 $ US | −790 000 000 $ US |
| 1999 | −1 015 745 741 $ US | −1 905 000 000 $ US | −715 000 000 $ US |
| 1998 | −648 129 008 $ US | −2 038 000 000 $ US | −803 000 000 $ US |
| 1997 | −2 927 099 543 $ US | −2 399 446 676 $ US | −1 033 108 926 $ US |
| 1996 | −2 864 555 918 $ US | −3 656 463 561 $ US | −1 442 580 793 $ US |
| 1995 | −1 644 944 061 $ US | −2 891 413 940 $ US | −1 080 278 955 $ US |
| 1994 | −1 433 344 463 $ US | −2 238 523 331 $ US | −776 780 353 $ US |
| 1993 | −3 157 885 591 $ US | −2 586 483 902 $ US | −1 065 808 921 $ US |
| 1992 | −1 541 375 310 $ US | −2 803 438 059 $ US | −1 123 949 341 $ US |
| 1991 | −709 414 528 $ US | −2 272 444 702 $ US | −783 277 669 $ US |
| 1990 | −2 183 424 485 $ US | −2 727 067 960 $ US | −643 572 540 $ US |
| 1989 | −2 521 859 017 $ US | −2 582 699 599 $ US | −524 590 801 $ US |
| 1988 | −2 141 612 076 $ US | −2 705 261 206 $ US | −636 214 390 $ US |
| 1987 | −1 760 384 503 $ US | −2 326 965 764 $ US | −315 978 646 $ US |
| 1986 | −2 492 684 439 $ US | −2 793 269 602 $ US | −371 076 962 $ US |
| 1985 | −3 749 340 369 $ US | −3 245 323 625 $ US | −335 701 744 $ US |
| 1984 | −3 293 781 538 $ US | −3 771 256 588 $ US | −297 957 031 $ US |
| 1983 | −2 962 440 945 $ US | −2 728 063 122 $ US | −217 010 374 $ US |
| 1982 | −3 361 895 735 $ US | −3 419 080 126 $ US | −148 030 100 $ US |
| 1981 | −2 668 888 889 $ US | −2 939 397 719 $ US | −273 002 792 $ US |
| 1980 | −2 534 646 465 $ US | −2 889 465 610 $ US | −225 506 395 $ US |
| 1979 | −2 121 212 121 $ US | −2 352 289 484 $ US | −244 687 633 $ US |
| 1978 | −1 613 232 323 $ US | −1 832 569 299 $ US | −217 488 841 $ US |
| 1977 | −1 287 878 788 $ US | −1 372 727 050 $ US | −182 475 472 $ US |
| 1976 | −1 007 373 737 $ US | −1 030 001 984 $ US | −164 106 139 $ US |
| 1975 | −1 012 323 232 $ US | - | - |
| 1974 | −327 474 747 $ US | - | - |
| 1973 | 34 332 734 $ US | - | - |
| 1972 | −138 453 590 $ US | - | - |
| 1971 | −294 204 116 $ US | - | - |
| 1970 | −274 044 519 $ US | - | - |
| 1969 | −315 833 683 $ US | - | - |
| 1968 | −326 963 461 $ US | - | - |
| 1967 | −496 640 067 $ US | - | - |
| 1966 | −353 002 940 $ US | - | - |
| 1965 | −588 828 223 $ US | - | - |
| 1964 | −399 832 003 $ US | - | - |
| 1963 | −353 632 927 $ US | - | - |
| 1962 | −331 583 368 $ US | - | - |
| 1961 | −321 293 574 $ US | - | - |
| 1960 | −226 585 468 $ US | - | - |
En 2025, la balance commerciale du Pakistan affichait un déficit de 29,4 milliards de dollars, contre un déficit de 227 millions de dollars en 1960. Le plus grand déficit a été de 44,8 milliards de dollars, en 2022, et le plus grand excédent de 34,3 millions de dollars, en 1973. La balance commerciale du Pakistan est déficitaire chaque année depuis 1974.
En 2025, le solde commercial du Pakistan était le 41e plus élevé de 44 pays situés en Asie, où les soldes allaient d'un déficit de 68,9 milliards de dollars en Inde à un excédent de 816 milliards de dollars en Chine. De 2016 à 2025, les soldes commerciaux du Pakistan ont totalisé un déficit de 303 milliards de dollars, contre un déficit de 165 milliards de dollars de 2006 à 2015. En 2025, les transactions courantes du Pakistan affichaient un déficit de 0,1 % du PIB.
Commerce de biens du Pakistan avec ses 10 principaux partenaires commerciaux, selon le Pakistan, 2025
| Pays | Exportations vers | Importations depuis | Solde | |
|---|---|---|---|---|
 Chine |
2,28 Md $US | 20,4 Md $US | −18,2 Md $US | |
 EAU |
1,92 Md $US | 6,94 Md $US | −5,02 Md $US | vs EAU |
 États-Unis |
5,92 Md $US | 2,75 Md $US | +3,17 Md $US | vs USA |
 Arabie saoudite |
690 M $US | 4,14 Md $US | −3,45 Md $US | vs Arabie saoudite |
 Indonésie |
108 M $US | 4,33 Md $US | −4,22 Md $US | vs Indonésie |
 Qatar |
105 M $US | 3,16 Md $US | −3,05 Md $US | vs Qatar |
 Royaume-Uni |
2,08 Md $US | 660 M $US | +1,42 Md $US | vs R.-U. |
 Allemagne |
1,68 Md $US | 847 M $US | +834 M $US | |
 Japon |
202 M $US | 1,74 Md $US | −1,53 Md $US | vs Japon |
 Pays-Bas |
1,55 Md $US | 296 M $US | +1,25 Md $US |
Balance commerciale du Pakistan : excédent (+) ou déficit (−)
| Biens et services, $ US, 2025 | −29,4 Md $US |
|---|---|
| % du PIB, 2025 | −7,2 % |
| Années d'excédent, 2000–2025 | 0 |
| Biens, $ US, 2025 | −31,1 Md $US |
| Services, $ US, 2025 | −2,95 Md $US |
| Premier excédent en biens, 2025 | États-Unis +3,17 Md $US |
| Premier déficit en biens, 2025 | Chine −18,2 Md $US |
Comparer la balance commerciale du Pakistan avec celle d'autres pays
Sources :
- TradeMap (2025, mis à jour en octobre 2026)
- Banque mondiale | Économie et croissance (1960–2025, mis à jour en octobre 2026)
Creative Commons Attribution (CC BY) : vous pouvez copier, partager, adapter et réutiliser ce contenu, y compris à des fins commerciales, à condition de citer statistics.wiki et d’indiquer les modifications apportées. Les sources citées ci-dessus peuvent avoir leurs propres conditions de licence.