
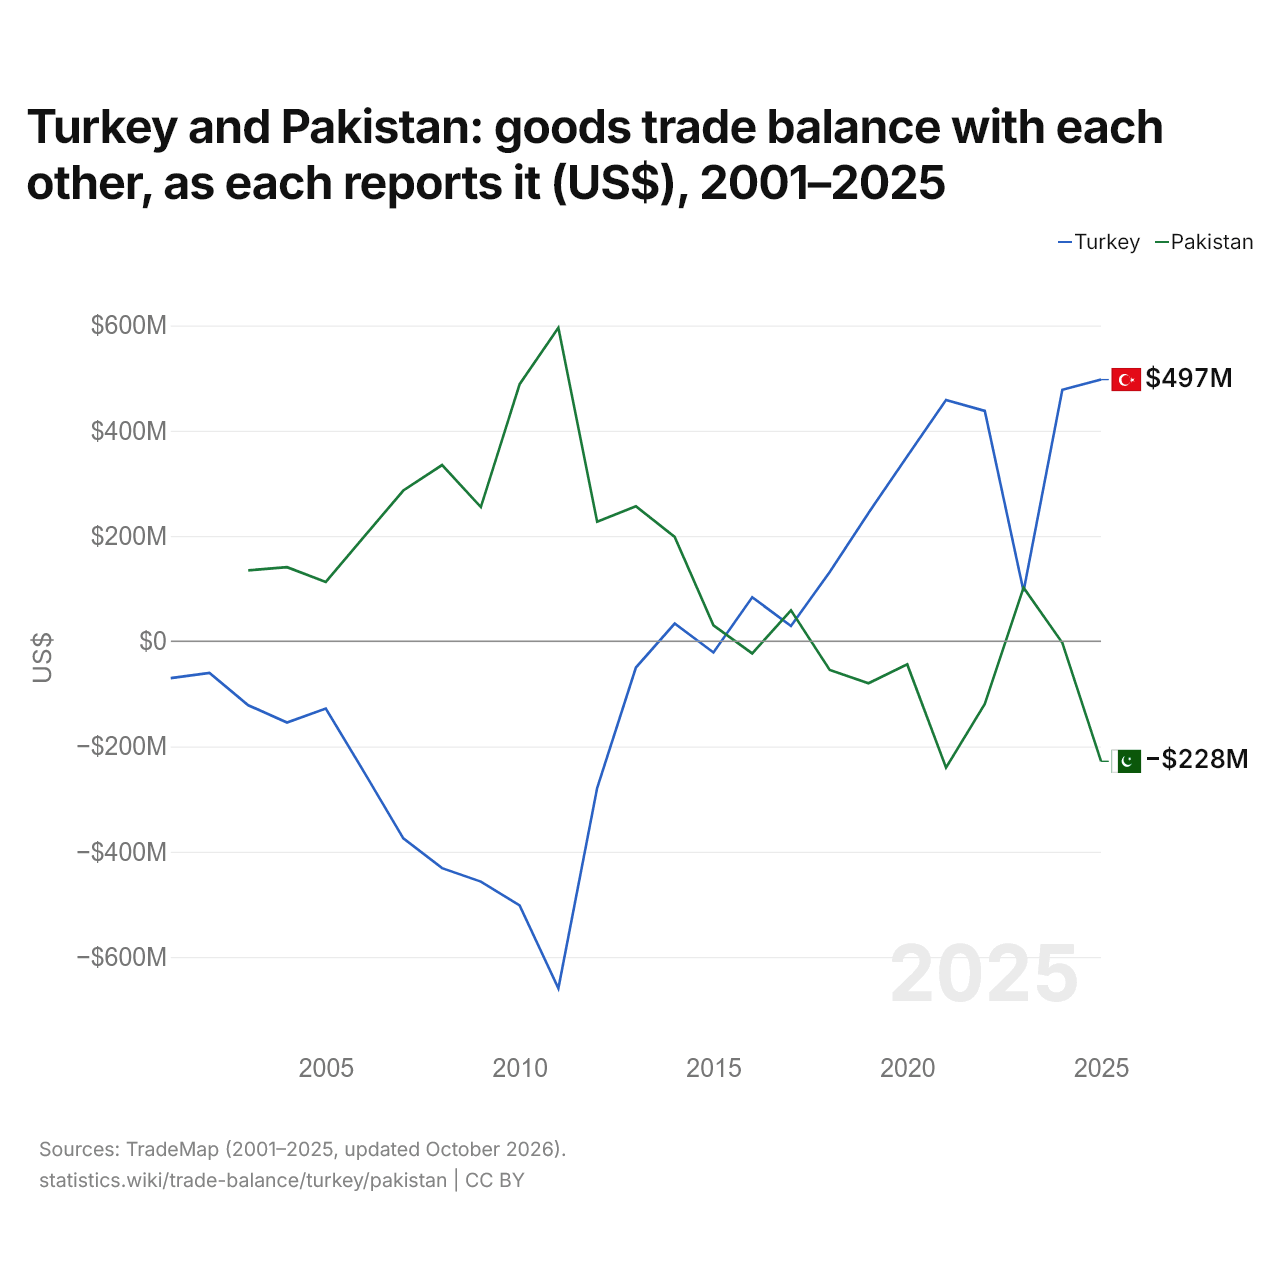
La Turquie et le Pakistan : solde de leur commerce de biens bilatéral, selon chacun ($ US), 2001–2025
| Année | $ US | |
|---|---|---|
| Turquie | Pakistan | |
| 2025 | 497 214 000 $ US | −228 127 000 $ US |
| 2024 | 477 907 000 $ US | −2 923 000 $ US |
| 2023 | 94 962 000 $ US | 101 962 000 $ US |
| 2022 | 437 725 000 $ US | −119 013 000 $ US |
| 2021 | 458 250 000 $ US | −240 232 000 $ US |
| 2020 | 351 411 000 $ US | −43 980 000 $ US |
| 2019 | 243 904 000 $ US | −79 925 000 $ US |
| 2018 | 131 459 000 $ US | −54 568 000 $ US |
| 2017 | 29 049 000 $ US | 58 754 000 $ US |
| 2016 | 83 604 000 $ US | −23 205 000 $ US |
| 2015 | −21 390 000 $ US | 30 210 000 $ US |
| 2014 | 33 690 000 $ US | 198 215 000 $ US |
| 2013 | −49 975 000 $ US | 256 500 000 $ US |
| 2012 | −278 885 000 $ US | 226 994 000 $ US |
| 2011 | −659 459 000 $ US | 595 803 000 $ US |
| 2010 | −501 784 000 $ US | 488 415 000 $ US |
| 2009 | −456 705 000 $ US | 254 967 000 $ US |
| 2008 | −431 170 000 $ US | 334 867 000 $ US |
| 2007 | −374 580 000 $ US | 286 457 000 $ US |
| 2006 | −250 044 000 $ US | 199 700 000 $ US |
| 2005 | −127 909 000 $ US | 112 656 000 $ US |
| 2004 | −154 320 000 $ US | 140 732 000 $ US |
| 2003 | −121 674 000 $ US | 134 692 000 $ US |
| 2002 | −60 198 000 $ US | - |
| 2001 | −70 094 000 $ US | - |
En 2025, selon la Turquie, son commerce de biens avec le Pakistan affichait un excédent de 497 millions de dollars ; selon le Pakistan, son commerce de biens avec la Turquie affichait un déficit de 228 millions de dollars. En 2003, les chiffres étaient un déficit de 122 millions de dollars pour la Turquie et un excédent de 135 millions de dollars pour le Pakistan.
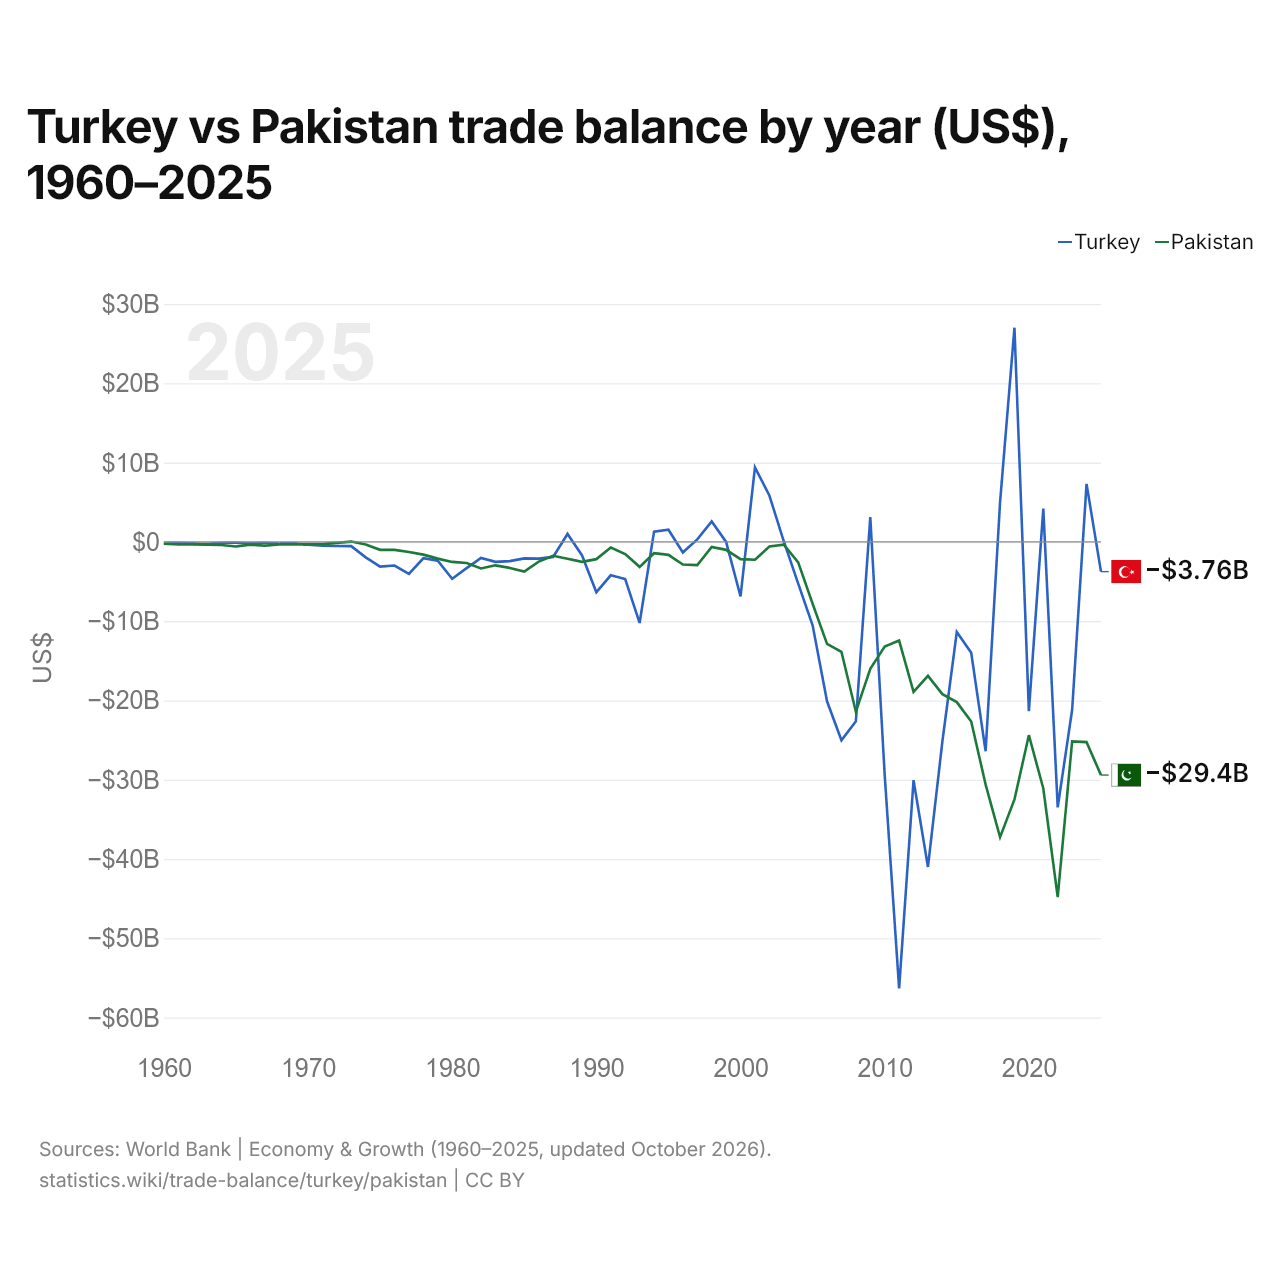
Turquie vs Pakistan : balance commerciale par année ($ US), 1960–2025
| Année | $ US | |
|---|---|---|
 Turquie |
 Pakistan |
|
| 2025 | −3 755 785 561 $ US | −29 420 304 991 $ US |
| 2024 | 7 307 197 101 $ US | −25 257 703 998 $ US |
| 2023 | −21 181 731 331 $ US | −25 183 381 482 $ US |
| 2022 | −33 486 302 440 $ US | −44 800 038 644 $ US |
| 2021 | 4 185 993 617 $ US | −31 112 850 067 $ US |
| 2020 | −21 347 440 639 $ US | −24 392 041 495 $ US |
| 2019 | 27 009 801 864 $ US | −32 488 393 369 $ US |
| 2018 | 4 971 181 455 $ US | −37 259 759 399 $ US |
| 2017 | −26 405 711 552 $ US | −30 626 231 103 $ US |
| 2016 | −13 983 412 331 $ US | −22 669 632 006 $ US |
| 2015 | −11 366 572 353 $ US | −20 214 678 694 $ US |
| 2014 | −25 180 591 325 $ US | −19 214 125 936 $ US |
| 2013 | −41 005 981 821 $ US | −16 903 963 808 $ US |
| 2012 | −30 066 833 315 $ US | −18 935 710 905 $ US |
| 2011 | −56 314 976 402 $ US | −12 445 976 549 $ US |
| 2010 | −29 450 676 482 $ US | −13 208 171 673 $ US |
| 2009 | 3 116 333 325 $ US | −16 007 846 667 $ US |
| 2008 | −22 630 468 482 $ US | −21 428 199 020 $ US |
| 2007 | −25 026 651 296 $ US | −13 880 038 493 $ US |
| 2006 | −20 116 184 782 $ US | −12 871 731 104 $ US |
| 2005 | −10 528 378 745 $ US | −7 804 685 162 $ US |
| 2004 | −5 268 792 743 $ US | −2 594 600 000 $ US |
| 2003 | 66 756 414 $ US | −360 568 550 $ US |
| 2002 | 5 845 228 386 $ US | −590 557 973 $ US |
| 2001 | 9 400 731 322 $ US | −2 258 502 233 $ US |
| 2000 | −6 890 257 814 $ US | −2 189 374 438 $ US |
| 1999 | −12 805 916 $ US | −1 015 745 741 $ US |
| 1998 | 2 572 582 501 $ US | −648 129 008 $ US |
| 1997 | 308 677 444 $ US | −2 927 099 543 $ US |
| 1996 | −1 330 688 533 $ US | −2 864 555 918 $ US |
| 1995 | 1 537 801 287 $ US | −1 644 944 061 $ US |
| 1994 | 1 278 297 139 $ US | −1 433 344 463 $ US |
| 1993 | −10 228 639 053 $ US | −3 157 885 591 $ US |
| 1992 | −4 698 195 576 $ US | −1 541 375 310 $ US |
| 1991 | −4 219 534 995 $ US | −709 414 528 $ US |
| 1990 | −6 346 799 540 $ US | −2 183 424 485 $ US |
| 1989 | −1 690 292 177 $ US | −2 521 859 017 $ US |
| 1988 | 1 000 632 911 $ US | −2 141 612 076 $ US |
| 1987 | −1 897 782 964 $ US | −1 760 384 503 $ US |
| 1986 | −2 110 962 963 $ US | −2 492 684 439 $ US |
| 1985 | −2 087 931 034 $ US | −3 749 340 369 $ US |
| 1984 | −2 437 602 180 $ US | −3 293 781 538 $ US |
| 1983 | −2 524 444 444 $ US | −2 962 440 945 $ US |
| 1982 | −2 029 447 853 $ US | −3 361 895 735 $ US |
| 1981 | −3 322 522 523 $ US | −2 668 888 889 $ US |
| 1980 | −4 656 578 947 $ US | −2 534 646 465 $ US |
| 1979 | −2 387 096 774 $ US | −2 121 212 121 $ US |
| 1978 | −2 070 833 333 $ US | −1 613 232 323 $ US |
| 1977 | −4 044 444 444 $ US | −1 287 878 788 $ US |
| 1976 | −2 987 500 000 $ US | −1 007 373 737 $ US |
| 1975 | −3 135 714 286 $ US | −1 012 323 232 $ US |
| 1974 | −1 964 285 714 $ US | −327 474 747 $ US |
| 1973 | −535 714 286 $ US | 34 332 734 $ US |
| 1972 | −521 428 571 $ US | −138 453 590 $ US |
| 1971 | −473 333 333 $ US | −294 204 116 $ US |
| 1970 | −345 454 545 $ US | −274 044 519 $ US |
| 1969 | −222 222 222 $ US | −315 833 683 $ US |
| 1968 | −244 444 444 $ US | −326 963 461 $ US |
| 1967 | −133 333 333 $ US | −496 640 067 $ US |
| 1966 | −222 222 222 $ US | −353 002 940 $ US |
| 1965 | −100 000 000 $ US | −588 828 223 $ US |
| 1964 | −111 111 111 $ US | −399 832 003 $ US |
| 1963 | −288 888 889 $ US | −353 632 927 $ US |
| 1962 | −211 111 111 $ US | −331 583 368 $ US |
| 1961 | −133 333 333 $ US | −321 293 574 $ US |
| 1960 | −122 222 222 $ US | −226 585 468 $ US |
En 2025, la balance commerciale de la Turquie affichait un déficit de 3,76 milliards de dollars et celle du Pakistan un déficit de 29,4 milliards de dollars ; le déficit du Pakistan était 7,8 fois plus grand. En 1960, la balance commerciale de la Turquie affichait un déficit de 122 millions de dollars et celle du Pakistan un déficit de 227 millions de dollars.
De 1960 à 2025, la balance commerciale de la Turquie a été excédentaire pendant 13 des 66 années, et celle du Pakistan pendant une. Les balances commerciales de la Turquie et du Pakistan ont été déficitaires en même temps pendant 52 de ces années, la dernière fois en 2025.
Turquie vs Pakistan : chiffres de la balance commerciale
|
Turquie
|
Pakistan
|
|
|---|---|---|
| Biens et services, $ US | −3,76 Md $US (2025) | −29,4 Md $US (2025) |
| % du PIB | −0,2 % (2025) | −7,2 % (2025) |
| Années d'excédent depuis 2000 | 8 sur 26 | 0 sur 26 |
| Solde des biens entre les deux, chiffres propres | +497 M $US (2025) | −228 M $US (2025) |
| Premier excédent en biens avec | Irak (+10,4 Md $US, 2025) | États-Unis (+3,17 Md $US, 2025) |
| Premier déficit en biens avec | Chine (−46,3 Md $US, 2025) | Chine (−18,2 Md $US, 2025) |
Comparer la balance commerciale de 2 pays au choix
Sources :
- Banque mondiale | Économie et croissance (1960–2025, mis à jour en octobre 2026)
- TradeMap (2001–2025, mis à jour en octobre 2026)
Creative Commons Attribution (CC BY) : vous pouvez copier, partager, adapter et réutiliser ce contenu, y compris à des fins commerciales, à condition de citer statistics.wiki et d’indiquer les modifications apportées. Les sources citées ci-dessus peuvent avoir leurs propres conditions de licence.