
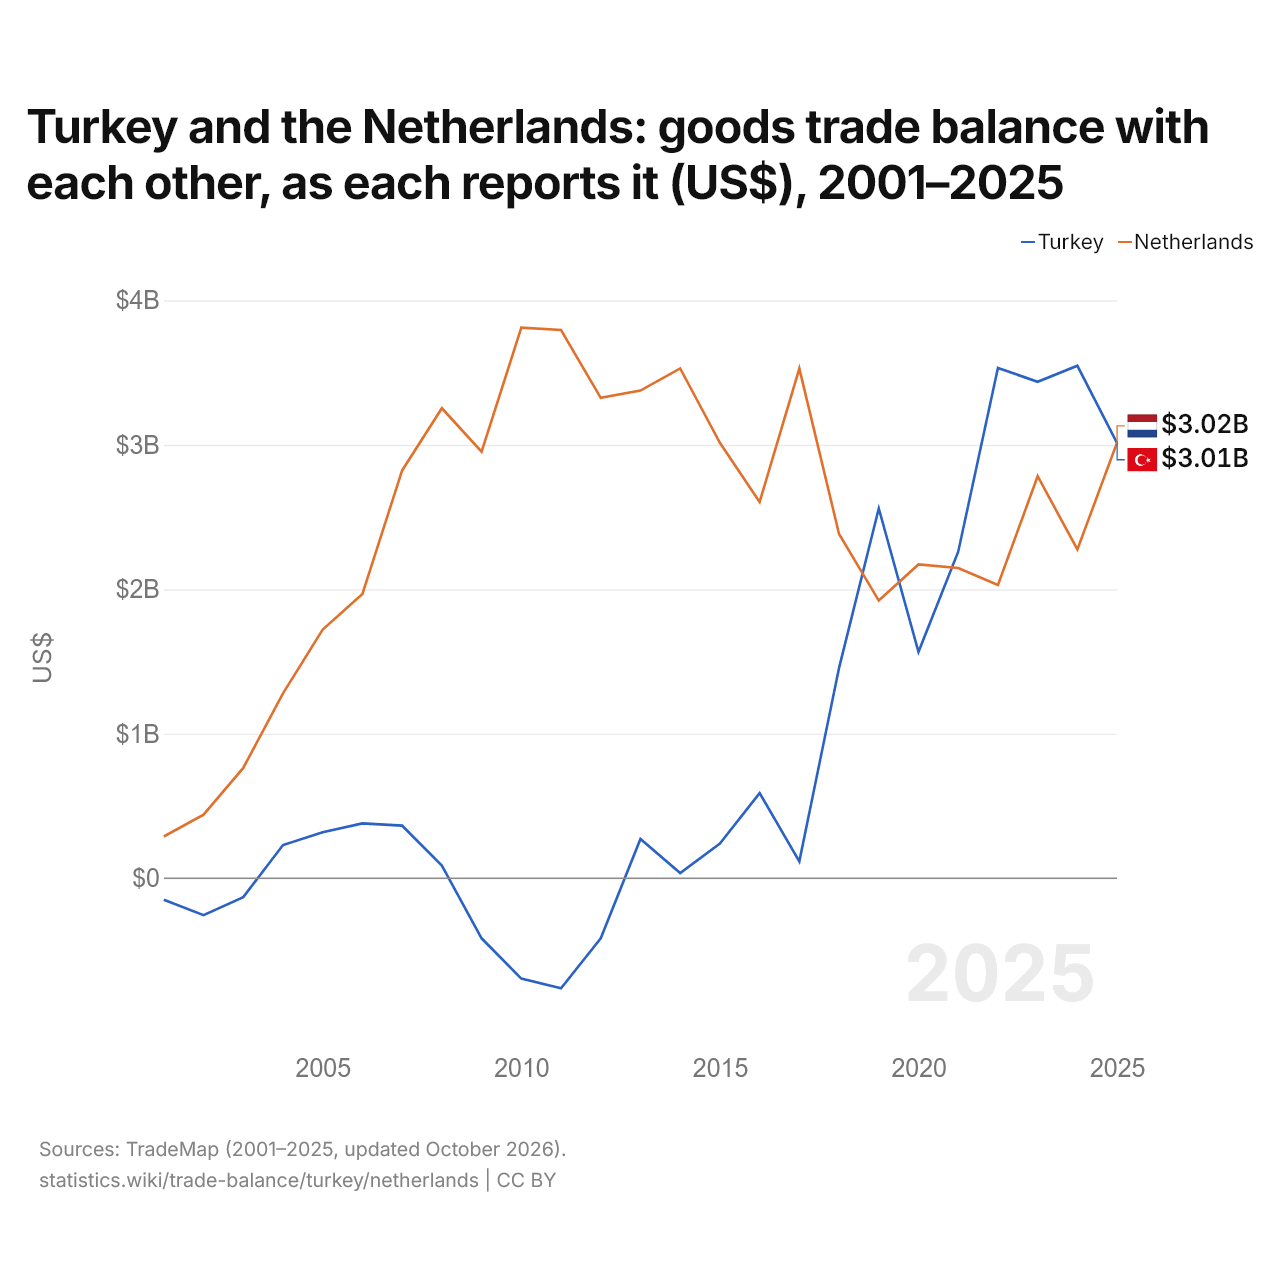
La Turquie et les Pays-Bas : solde de leur commerce de biens bilatéral, selon chacun ($ US), 2001–2025
| Année | $ US | |
|---|---|---|
| Turquie | Pays-Bas | |
| 2025 | 3 011 510 000 $ US | 3 016 341 000 $ US |
| 2024 | 3 547 444 000 $ US | 2 275 473 000 $ US |
| 2023 | 3 436 920 000 $ US | 2 783 080 000 $ US |
| 2022 | 3 531 553 000 $ US | 2 030 425 000 $ US |
| 2021 | 2 260 407 000 $ US | 2 147 627 000 $ US |
| 2020 | 1 566 825 000 $ US | 2 171 771 000 $ US |
| 2019 | 2 559 630 000 $ US | 1 921 954 000 $ US |
| 2018 | 1 456 245 000 $ US | 2 382 934 000 $ US |
| 2017 | 116 867 000 $ US | 3 528 020 000 $ US |
| 2016 | 589 358 000 $ US | 2 604 633 000 $ US |
| 2015 | 240 180 000 $ US | 3 013 765 000 $ US |
| 2014 | 35 884 000 $ US | 3 528 788 000 $ US |
| 2013 | 271 573 000 $ US | 3 375 622 000 $ US |
| 2012 | −416 205 000 $ US | 3 325 035 000 $ US |
| 2011 | −761 875 000 $ US | 3 795 264 000 $ US |
| 2010 | −694 629 000 $ US | 3 810 853 000 $ US |
| 2009 | −415 776 000 $ US | 2 951 891 000 $ US |
| 2008 | 87 495 000 $ US | 3 253 479 000 $ US |
| 2007 | 363 839 000 $ US | 2 823 145 000 $ US |
| 2006 | 379 137 000 $ US | 1 968 198 000 $ US |
| 2005 | 318 001 000 $ US | 1 721 109 000 $ US |
| 2004 | 229 859 000 $ US | 1 279 628 000 $ US |
| 2003 | −130 741 000 $ US | 763 629 000 $ US |
| 2002 | −255 615 000 $ US | 439 492 000 $ US |
| 2001 | −149 171 000 $ US | 289 015 000 $ US |
En 2025, selon la Turquie, son commerce de biens avec les Pays-Bas affichait un excédent de 3,01 milliards de dollars ; selon les Pays-Bas, leur commerce de biens avec la Turquie affichait un excédent de 3,02 milliards de dollars. En 2001, les chiffres étaient un déficit de 149 millions de dollars pour la Turquie et un excédent de 289 millions de dollars pour les Pays-Bas.
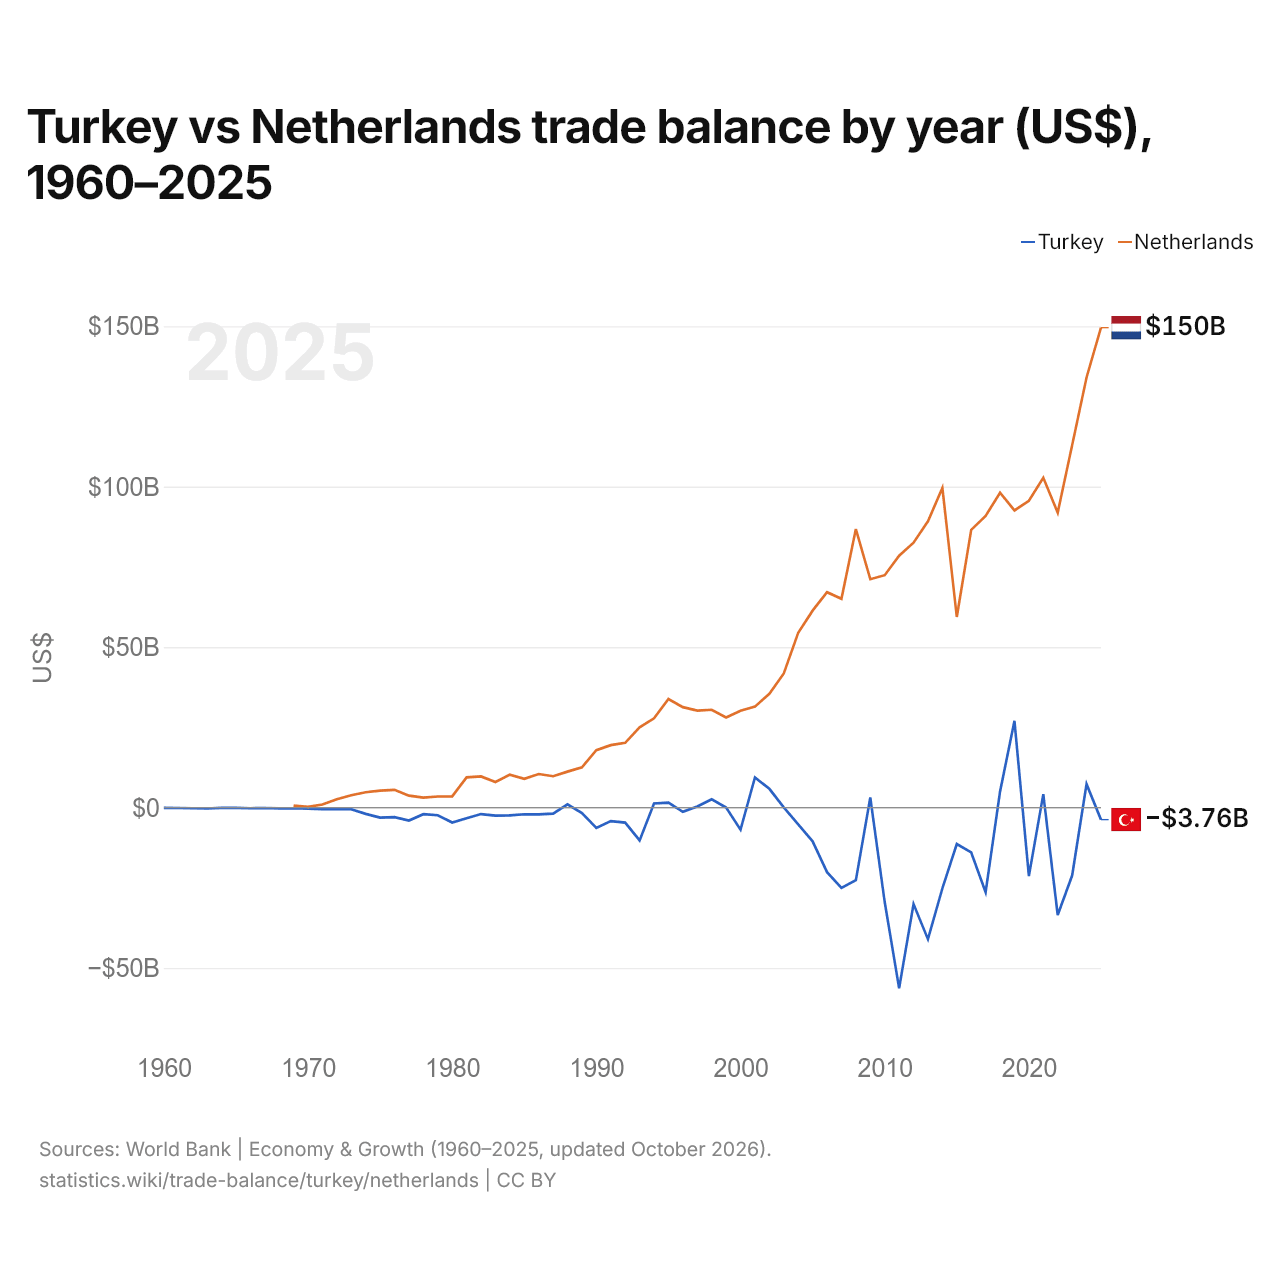
Turquie vs Pays-Bas : balance commerciale par année ($ US), 1960–2025
| Année | $ US | |
|---|---|---|
 Turquie |
 Pays-Bas |
|
| 2025 | −3 755 785 561 $ US | 149 519 368 722 $ US |
| 2024 | 7 307 197 101 $ US | 134 007 361 075 $ US |
| 2023 | −21 181 731 331 $ US | 112 885 525 975 $ US |
| 2022 | −33 486 302 440 $ US | 91 883 758 920 $ US |
| 2021 | 4 185 993 617 $ US | 102 760 026 360 $ US |
| 2020 | −21 347 440 639 $ US | 95 585 823 574 $ US |
| 2019 | 27 009 801 864 $ US | 92 567 108 267 $ US |
| 2018 | 4 971 181 455 $ US | 98 121 967 356 $ US |
| 2017 | −26 405 711 552 $ US | 90 871 553 835 $ US |
| 2016 | −13 983 412 331 $ US | 86 519 974 912 $ US |
| 2015 | −11 366 572 353 $ US | 59 405 539 190 $ US |
| 2014 | −25 180 591 325 $ US | 99 609 660 307 $ US |
| 2013 | −41 005 981 821 $ US | 89 195 079 396 $ US |
| 2012 | −30 066 833 315 $ US | 82 521 976 395 $ US |
| 2011 | −56 314 976 402 $ US | 78 468 693 473 $ US |
| 2010 | −29 450 676 482 $ US | 72 400 038 600 $ US |
| 2009 | 3 116 333 325 $ US | 71 142 272 210 $ US |
| 2008 | −22 630 468 482 $ US | 86 778 984 923 $ US |
| 2007 | −25 026 651 296 $ US | 65 052 481 087 $ US |
| 2006 | −20 116 184 782 $ US | 67 090 411 938 $ US |
| 2005 | −10 528 378 745 $ US | 61 353 555 872 $ US |
| 2004 | −5 268 792 743 $ US | 54 443 116 593 $ US |
| 2003 | 66 756 414 $ US | 41 785 064 886 $ US |
| 2002 | 5 845 228 386 $ US | 35 473 198 312 $ US |
| 2001 | 9 400 731 322 $ US | 31 443 761 454 $ US |
| 2000 | −6 890 257 814 $ US | 30 149 484 438 $ US |
| 1999 | −12 805 916 $ US | 28 049 104 555 $ US |
| 1998 | 2 572 582 501 $ US | 30 467 673 850 $ US |
| 1997 | 308 677 444 $ US | 30 213 462 842 $ US |
| 1996 | −1 330 688 533 $ US | 31 287 581 699 $ US |
| 1995 | 1 537 801 287 $ US | 33 823 771 617 $ US |
| 1994 | 1 278 297 139 $ US | 27 817 382 250 $ US |
| 1993 | −10 228 639 053 $ US | 24 988 427 860 $ US |
| 1992 | −4 698 195 576 $ US | 20 174 407 268 $ US |
| 1991 | −4 219 534 995 $ US | 19 451 513 437 $ US |
| 1990 | −6 346 799 540 $ US | 17 883 441 849 $ US |
| 1989 | −1 690 292 177 $ US | 12 556 469 916 $ US |
| 1988 | 1 000 632 911 $ US | 11 195 472 182 $ US |
| 1987 | −1 897 782 964 $ US | 9 754 287 424 $ US |
| 1986 | −2 110 962 963 $ US | 10 457 692 031 $ US |
| 1985 | −2 087 931 034 $ US | 8 962 418 392 $ US |
| 1984 | −2 437 602 180 $ US | 10 259 458 104 $ US |
| 1983 | −2 524 444 444 $ US | 7 966 659 717 $ US |
| 1982 | −2 029 447 853 $ US | 9 708 016 011 $ US |
| 1981 | −3 322 522 523 $ US | 9 423 038 947 $ US |
| 1980 | −4 656 578 947 $ US | 3 500 606 296 $ US |
| 1979 | −2 387 096 774 $ US | 3 439 706 690 $ US |
| 1978 | −2 070 833 333 $ US | 3 075 533 714 $ US |
| 1977 | −4 044 444 444 $ US | 3 708 195 205 $ US |
| 1976 | −2 987 500 000 $ US | 5 533 782 297 $ US |
| 1975 | −3 135 714 286 $ US | 5 259 495 469 $ US |
| 1974 | −1 964 285 714 $ US | 4 786 280 843 $ US |
| 1973 | −535 714 286 $ US | 3 843 968 154 $ US |
| 1972 | −521 428 571 $ US | 2 565 120 846 $ US |
| 1971 | −473 333 333 $ US | 940 433 584 $ US |
| 1970 | −345 454 545 $ US | 195 855 604 $ US |
| 1969 | −222 222 222 $ US | 611 798 612 $ US |
| 1968 | −244 444 444 $ US | - |
| 1967 | −133 333 333 $ US | - |
| 1966 | −222 222 222 $ US | - |
| 1965 | −100 000 000 $ US | - |
| 1964 | −111 111 111 $ US | - |
| 1963 | −288 888 889 $ US | - |
| 1962 | −211 111 111 $ US | - |
| 1961 | −133 333 333 $ US | - |
| 1960 | −122 222 222 $ US | - |
En 2025, la balance commerciale de la Turquie affichait un déficit de 3,76 milliards de dollars et celle des Pays-Bas un excédent de 150 milliards de dollars. En 1969, la balance commerciale de la Turquie affichait un déficit de 222 millions de dollars et celle des Pays-Bas un excédent de 612 millions de dollars.
De 1969 à 2025, la balance commerciale de la Turquie a été excédentaire pendant 13 des 57 années, et celle des Pays-Bas chacune d'elles. Les balances commerciales de la Turquie et des Pays-Bas n'ont jamais été déficitaires la même année.
Turquie vs Pays-Bas : chiffres de la balance commerciale
|
Turquie
|
Pays-Bas
|
|
|---|---|---|
| Biens et services, $ US | −3,76 Md $US (2025) | +150 Md $US (2025) |
| % du PIB | −0,2 % (2025) | +11,2 % (2025) |
| Années d'excédent depuis 2000 | 8 sur 26 | 26 sur 26 |
| Solde des biens entre les deux, chiffres propres | +3,01 Md $US (2025) | +3,02 Md $US (2025) |
| Premier excédent en biens avec | Irak (+10,4 Md $US, 2025) | Allemagne (+52,4 Md $US, 2025) |
| Premier déficit en biens avec | Chine (−46,3 Md $US, 2025) | Chine (−33,7 Md $US, 2025) |
Comparer la balance commerciale de 2 pays au choix
Sources :
- Banque mondiale | Économie et croissance (1960–2025, mis à jour en octobre 2026)
- TradeMap (2001–2025, mis à jour en octobre 2026)
Creative Commons Attribution (CC BY) : vous pouvez copier, partager, adapter et réutiliser ce contenu, y compris à des fins commerciales, à condition de citer statistics.wiki et d’indiquer les modifications apportées. Les sources citées ci-dessus peuvent avoir leurs propres conditions de licence.