
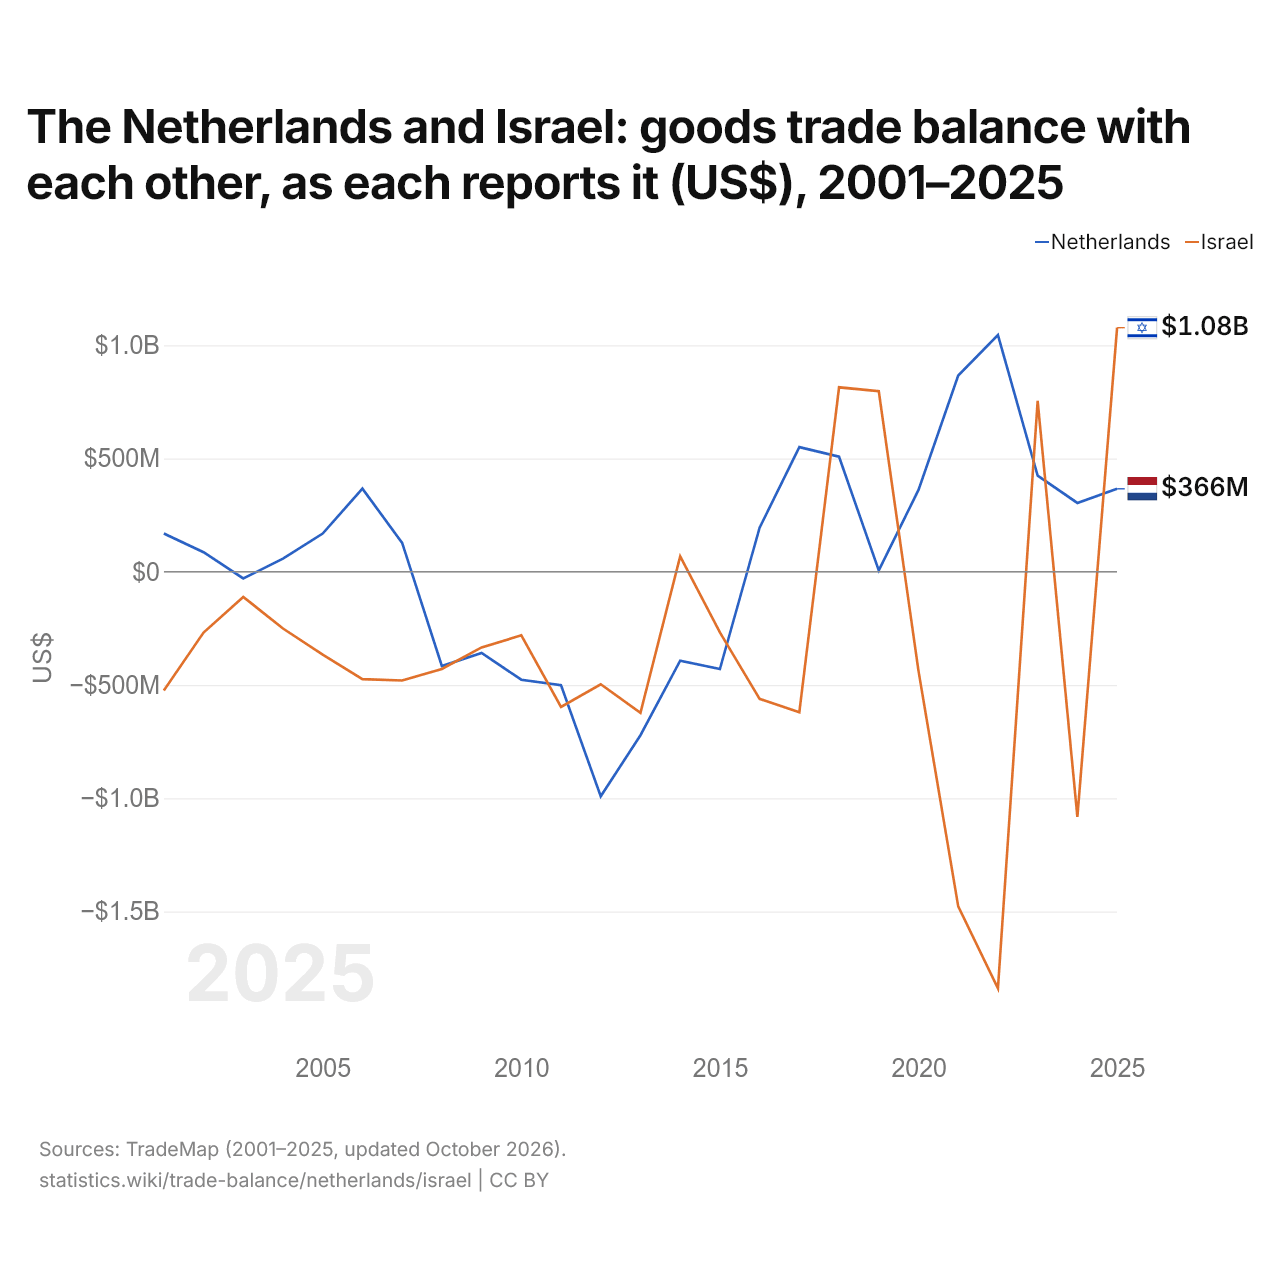
Les Pays-Bas et Israël : solde de leur commerce de biens bilatéral, selon chacun ($ US), 2001–2025
| Année | $ US | |
|---|---|---|
| Pays-Bas | Israël | |
| 2025 | 366 298 000 $ US | 1 077 529 000 $ US |
| 2024 | 303 899 000 $ US | −1 082 598 000 $ US |
| 2023 | 424 245 000 $ US | 754 215 000 $ US |
| 2022 | 1 045 266 000 $ US | −1 839 147 000 $ US |
| 2021 | 866 037 000 $ US | −1 477 655 000 $ US |
| 2020 | 361 173 000 $ US | −437 599 000 $ US |
| 2019 | 5 736 000 $ US | 796 838 000 $ US |
| 2018 | 508 077 000 $ US | 814 342 000 $ US |
| 2017 | 550 447 000 $ US | −620 439 000 $ US |
| 2016 | 194 537 000 $ US | −561 224 000 $ US |
| 2015 | −429 625 000 $ US | −267 531 000 $ US |
| 2014 | −392 409 000 $ US | 67 965 000 $ US |
| 2013 | −721 902 000 $ US | −622 627 000 $ US |
| 2012 | −991 476 000 $ US | −496 758 000 $ US |
| 2011 | −501 138 000 $ US | −597 245 000 $ US |
| 2010 | −476 662 000 $ US | −280 772 000 $ US |
| 2009 | −358 485 000 $ US | −334 018 000 $ US |
| 2008 | −416 278 000 $ US | −429 198 000 $ US |
| 2007 | 127 216 000 $ US | −480 122 000 $ US |
| 2006 | 367 253 000 $ US | −473 960 000 $ US |
| 2005 | 168 583 000 $ US | −365 794 000 $ US |
| 2004 | 57 713 000 $ US | −250 633 000 $ US |
| 2003 | −29 562 000 $ US | −111 137 000 $ US |
| 2002 | 86 433 000 $ US | −268 464 000 $ US |
| 2001 | 169 140 000 $ US | −523 886 000 $ US |
En 2025, selon les Pays-Bas, leur commerce de biens avec Israël affichait un excédent de 366 millions de dollars ; selon Israël, son commerce de biens avec les Pays-Bas affichait un excédent de 1,08 milliard de dollars. En 2001, les chiffres étaient un excédent de 169 millions de dollars pour les Pays-Bas et un déficit de 524 millions de dollars pour Israël.
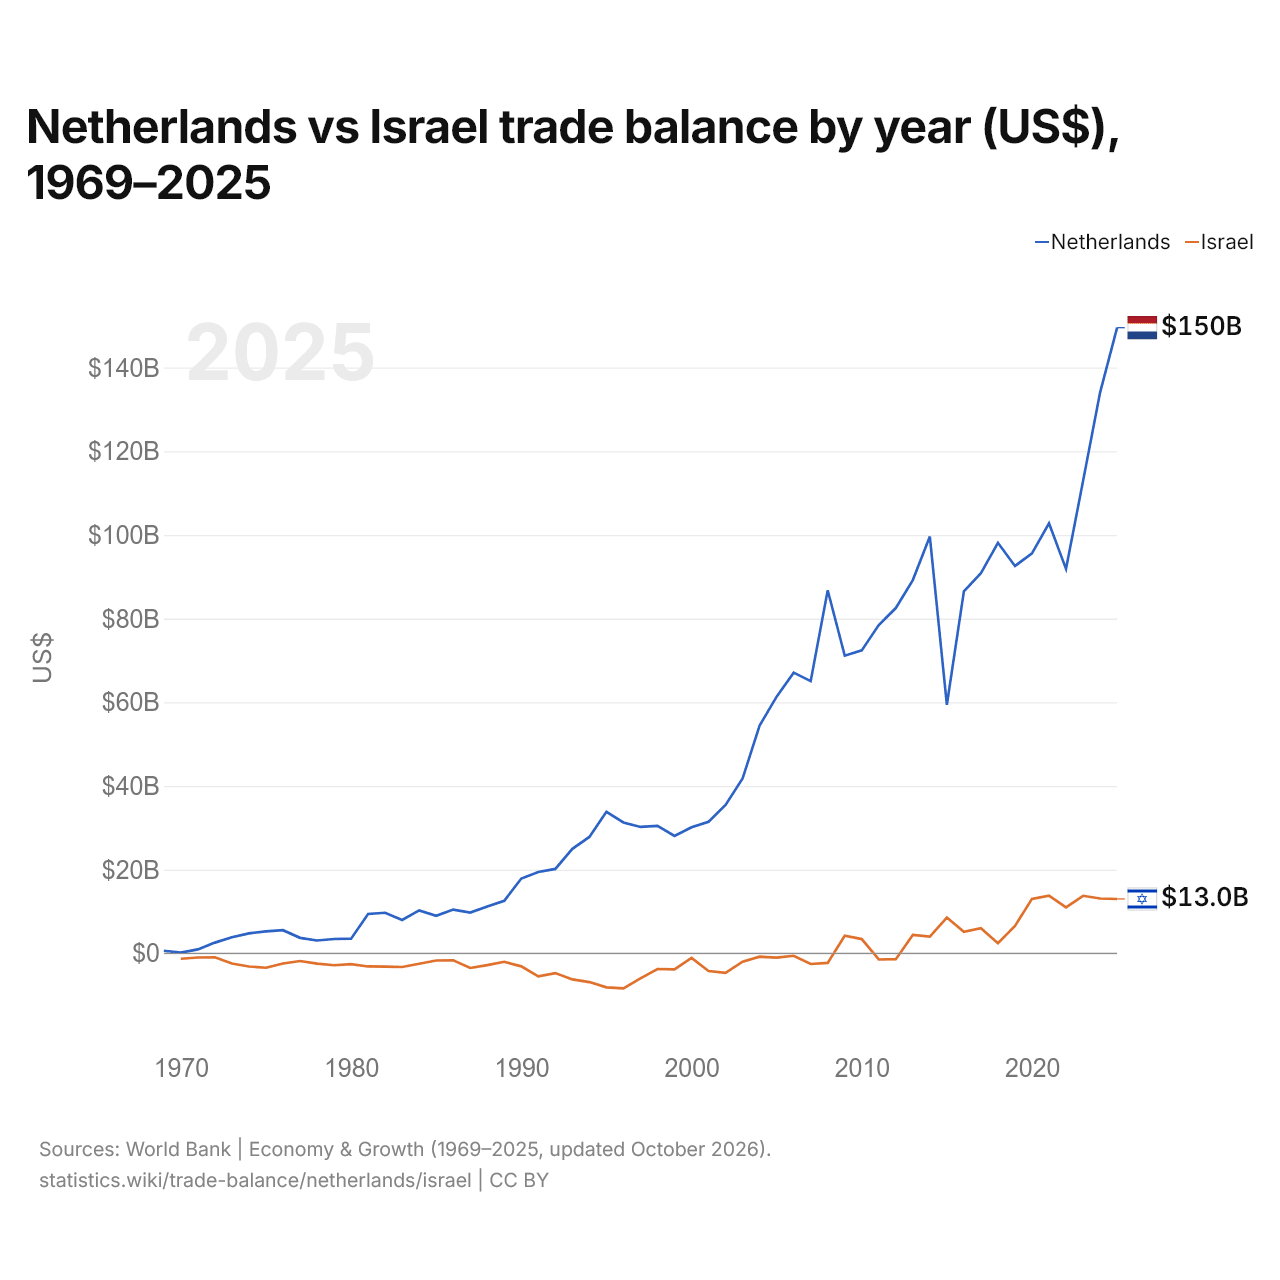
Pays-Bas vs Israël : balance commerciale par année ($ US), 1969–2025
| Année | $ US | |
|---|---|---|
 Pays-Bas |
 Israël |
|
| 2025 | 149 519 368 722 $ US | 12 994 365 505 $ US |
| 2024 | 134 007 361 075 $ US | 13 100 279 099 $ US |
| 2023 | 112 885 525 975 $ US | 13 754 663 733 $ US |
| 2022 | 91 883 758 920 $ US | 11 000 808 302 $ US |
| 2021 | 102 760 026 360 $ US | 13 804 496 055 $ US |
| 2020 | 95 585 823 574 $ US | 13 021 165 408 $ US |
| 2019 | 92 567 108 267 $ US | 6 557 503 906 $ US |
| 2018 | 98 121 967 356 $ US | 2 413 018 727 $ US |
| 2017 | 90 871 553 835 $ US | 6 004 796 901 $ US |
| 2016 | 86 519 974 912 $ US | 5 128 475 225 $ US |
| 2015 | 59 405 539 190 $ US | 8 575 319 326 $ US |
| 2014 | 99 609 660 307 $ US | 3 984 226 053 $ US |
| 2013 | 89 195 079 396 $ US | 4 406 103 796 $ US |
| 2012 | 82 521 976 395 $ US | −1 392 248 402 $ US |
| 2011 | 78 468 693 473 $ US | −1 462 187 515 $ US |
| 2010 | 72 400 038 600 $ US | 3 412 251 219 $ US |
| 2009 | 71 142 272 210 $ US | 4 198 677 110 $ US |
| 2008 | 86 778 984 923 $ US | −2 287 048 495 $ US |
| 2007 | 65 052 481 087 $ US | −2 539 773 861 $ US |
| 2006 | 67 090 411 938 $ US | −575 153 283 $ US |
| 2005 | 61 353 555 872 $ US | −1 009 500 635 $ US |
| 2004 | 54 443 116 593 $ US | −793 186 301 $ US |
| 2003 | 41 785 064 886 $ US | −1 975 804 879 $ US |
| 2002 | 35 473 198 312 $ US | −4 669 753 894 $ US |
| 2001 | 31 443 761 454 $ US | −4 222 578 168 $ US |
| 2000 | 30 149 484 438 $ US | −1 098 518 628 $ US |
| 1999 | 28 049 104 555 $ US | −3 810 722 999 $ US |
| 1998 | 30 467 673 850 $ US | −3 730 624 984 $ US |
| 1997 | 30 213 462 842 $ US | −5 975 502 116 $ US |
| 1996 | 31 287 581 699 $ US | −8 351 877 056 $ US |
| 1995 | 33 823 771 617 $ US | −8 115 948 262 $ US |
| 1994 | 27 817 382 250 $ US | −6 867 235 894 $ US |
| 1993 | 24 988 427 860 $ US | −6 232 770 220 $ US |
| 1992 | 20 174 407 268 $ US | −4 720 523 362 $ US |
| 1991 | 19 451 513 437 $ US | −5 509 077 267 $ US |
| 1990 | 17 883 441 849 $ US | −3 103 552 723 $ US |
| 1989 | 12 556 469 916 $ US | −2 010 870 382 $ US |
| 1988 | 11 195 472 182 $ US | −2 800 375 258 $ US |
| 1987 | 9 754 287 424 $ US | −3 498 185 125 $ US |
| 1986 | 10 457 692 031 $ US | −1 649 481 113 $ US |
| 1985 | 8 962 418 392 $ US | −1 698 280 601 $ US |
| 1984 | 10 259 458 104 $ US | −2 488 666 439 $ US |
| 1983 | 7 966 659 717 $ US | −3 259 483 986 $ US |
| 1982 | 9 708 016 011 $ US | −3 188 683 128 $ US |
| 1981 | 9 423 038 947 $ US | −3 131 228 070 $ US |
| 1980 | 3 500 606 296 $ US | −2 559 607 843 $ US |
| 1979 | 3 439 706 690 $ US | −2 851 200 000 $ US |
| 1978 | 3 075 533 714 $ US | −2 447 647 059 $ US |
| 1977 | 3 708 195 205 $ US | −1 834 000 000 $ US |
| 1976 | 5 533 782 297 $ US | −2 433 750 000 $ US |
| 1975 | 5 259 495 469 $ US | −3 438 333 333 $ US |
| 1974 | 4 786 280 843 $ US | −3 132 500 000 $ US |
| 1973 | 3 843 968 154 $ US | −2 412 500 000 $ US |
| 1972 | 2 565 120 846 $ US | −925 000 000 $ US |
| 1971 | 940 433 584 $ US | −1 000 000 000 $ US |
| 1970 | 195 855 604 $ US | −1 283 333 333 $ US |
| 1969 | 611 798 612 $ US | - |
En 2025, la balance commerciale des Pays-Bas affichait un excédent de 150 milliards de dollars et celle d'Israël un excédent de 13 milliards de dollars ; l'excédent des Pays-Bas était 12 fois plus grand. En 1970, la balance commerciale des Pays-Bas affichait un excédent de 196 millions de dollars et celle d'Israël un déficit de 1,28 milliard de dollars.
De 1970 à 2025, la balance commerciale des Pays-Bas a été excédentaire chacune des 56 années, et celle d'Israël pendant 15. Les balances commerciales des Pays-Bas et d'Israël n'ont jamais été déficitaires la même année.
Pays-Bas vs Israël : chiffres de la balance commerciale
|
Pays-Bas
|
Israël
|
|
|---|---|---|
| Biens et services, $ US | +150 Md $US (2025) | +13,0 Md $US (2025) |
| % du PIB | +11,2 % (2025) | +2,1 % (2025) |
| Années d'excédent depuis 2000 | 26 sur 26 | 15 sur 26 |
| Solde des biens entre les deux, chiffres propres | +366 M $US (2025) | +1,08 Md $US (2025) |
| Premier excédent en biens avec | Allemagne (+52,4 Md $US, 2025) | États-Unis (+6,12 Md $US, 2025) |
| Premier déficit en biens avec | Chine (−33,7 Md $US, 2025) | Chine (−18,0 Md $US, 2025) |
Comparer la balance commerciale de 2 pays au choix
Sources :
- Banque mondiale | Économie et croissance (1969–2025, mis à jour en octobre 2026)
- TradeMap (2001–2025, mis à jour en octobre 2026)
Creative Commons Attribution (CC BY) : vous pouvez copier, partager, adapter et réutiliser ce contenu, y compris à des fins commerciales, à condition de citer statistics.wiki et d’indiquer les modifications apportées. Les sources citées ci-dessus peuvent avoir leurs propres conditions de licence.