
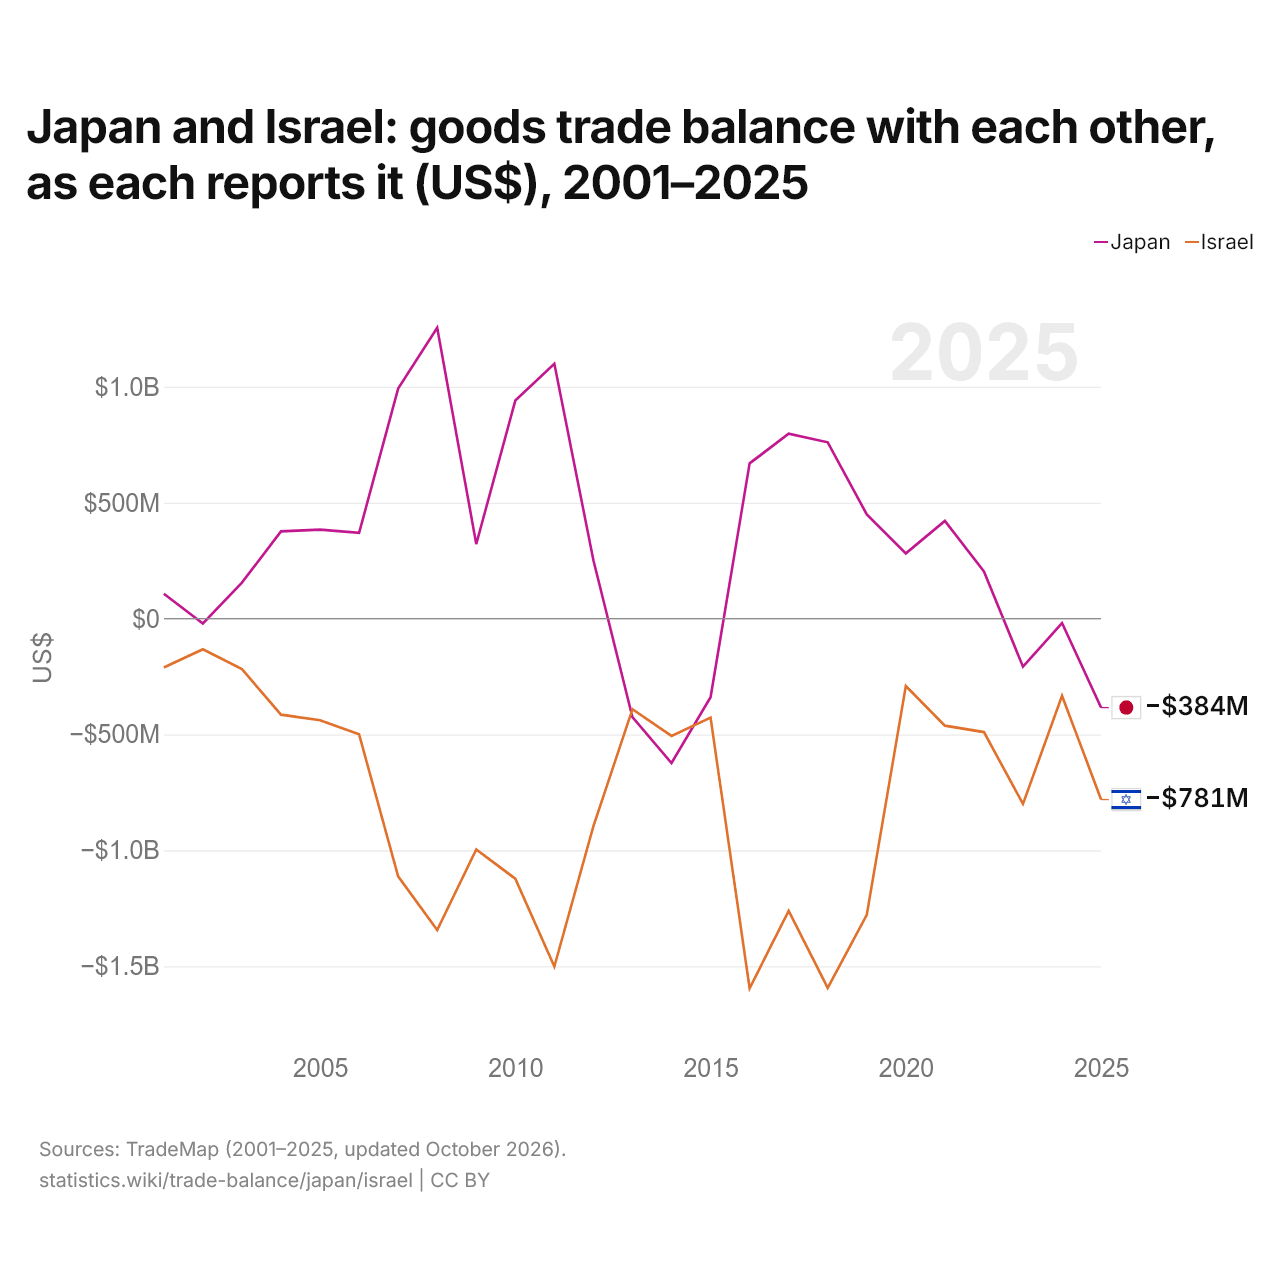
Le Japon et Israël : solde de leur commerce de biens bilatéral, selon chacun ($ US), 2001–2025
| Année | $ US | |
|---|---|---|
| Japon | Israël | |
| 2025 | −384 112 000 $ US | −780 788 000 $ US |
| 2024 | −18 993 000 $ US | −332 634 000 $ US |
| 2023 | −207 545 000 $ US | −799 876 000 $ US |
| 2022 | 203 146 000 $ US | −489 792 000 $ US |
| 2021 | 421 330 000 $ US | −461 995 000 $ US |
| 2020 | 281 197 000 $ US | −291 082 000 $ US |
| 2019 | 449 452 000 $ US | −1 278 034 000 $ US |
| 2018 | 760 427 000 $ US | −1 593 175 000 $ US |
| 2017 | 797 194 000 $ US | −1 260 855 000 $ US |
| 2016 | 669 521 000 $ US | −1 595 189 000 $ US |
| 2015 | −339 561 000 $ US | −427 440 000 $ US |
| 2014 | −623 309 000 $ US | −506 356 000 $ US |
| 2013 | −425 119 000 $ US | −390 972 000 $ US |
| 2012 | 251 653 000 $ US | −895 941 000 $ US |
| 2011 | 1 099 341 000 $ US | −1 501 446 000 $ US |
| 2010 | 940 685 000 $ US | −1 122 384 000 $ US |
| 2009 | 321 355 000 $ US | −996 042 000 $ US |
| 2008 | 1 254 919 000 $ US | −1 343 705 000 $ US |
| 2007 | 992 441 000 $ US | −1 112 491 000 $ US |
| 2006 | 369 481 000 $ US | −499 391 000 $ US |
| 2005 | 383 430 000 $ US | −438 926 000 $ US |
| 2004 | 376 436 000 $ US | −414 723 000 $ US |
| 2003 | 154 876 000 $ US | −217 826 000 $ US |
| 2002 | −21 361 000 $ US | −132 187 000 $ US |
| 2001 | 107 023 000 $ US | −211 456 000 $ US |
En 2025, selon le Japon, son commerce de biens avec Israël affichait un déficit de 384 millions de dollars ; selon Israël, son commerce de biens avec le Japon affichait un déficit de 781 millions de dollars. En 2001, les chiffres étaient un excédent de 107 millions de dollars pour le Japon et un déficit de 211 millions de dollars pour Israël.
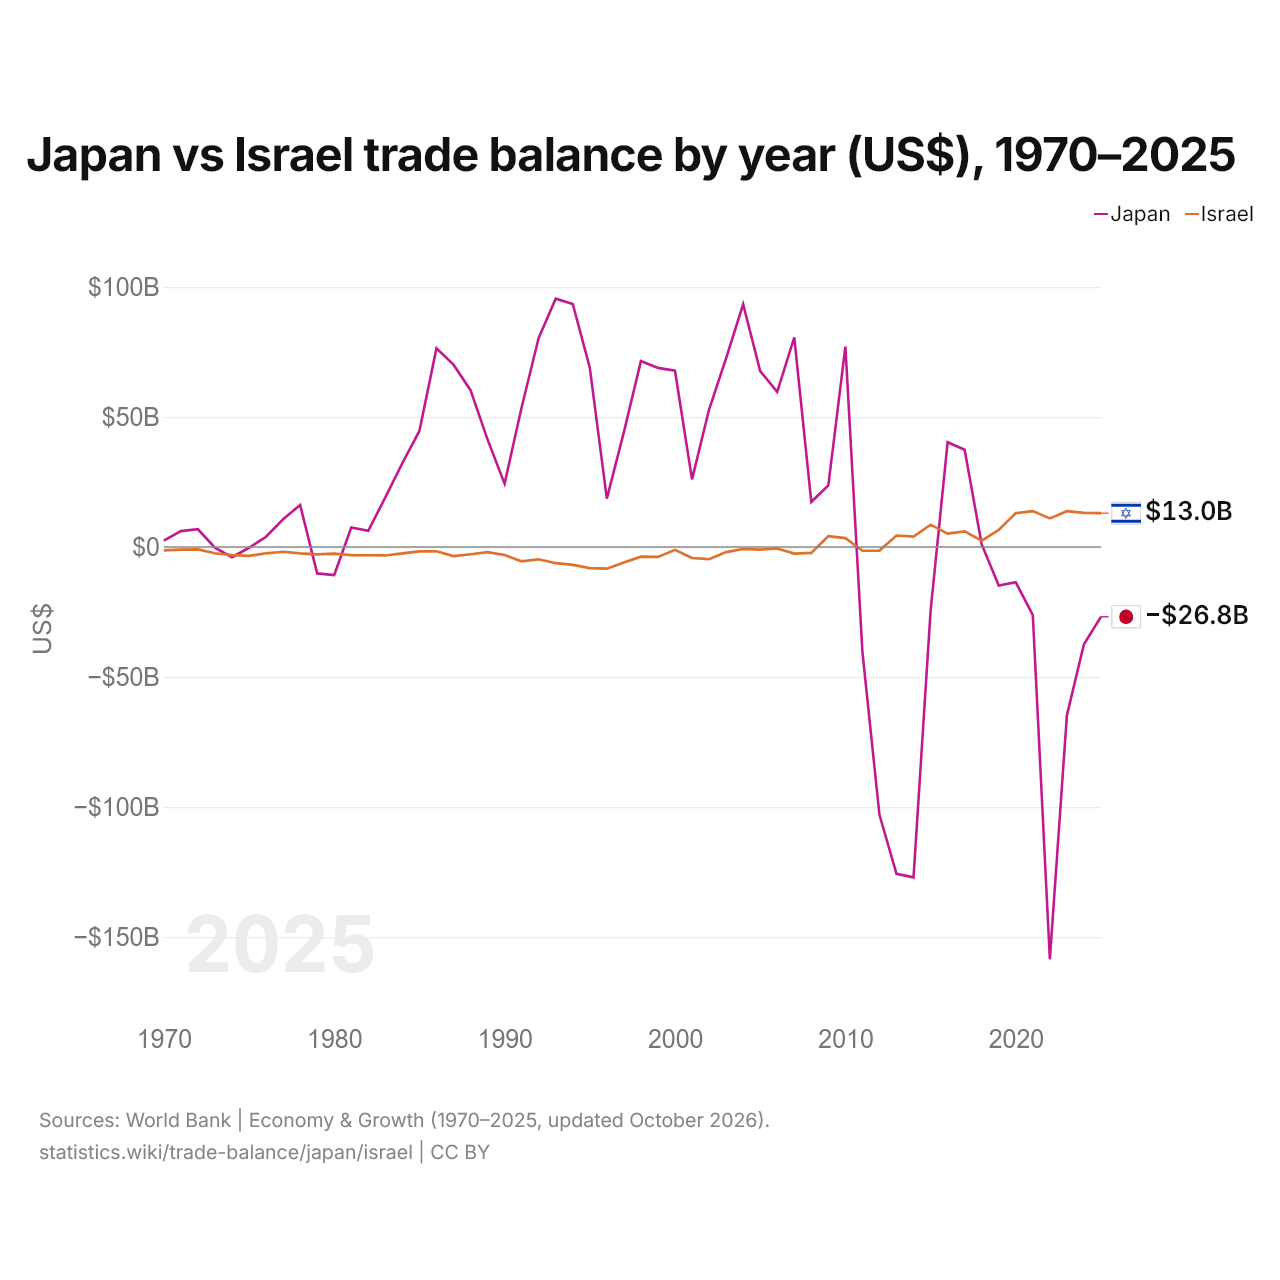
Japon vs Israël : balance commerciale par année ($ US), 1970–2025
| Année | $ US | |
|---|---|---|
 Japon |
 Israël |
|
| 2025 | −26 840 701 298 $ US | 12 994 365 505 $ US |
| 2024 | −37 421 806 079 $ US | 13 100 279 099 $ US |
| 2023 | −64 740 755 791 $ US | 13 754 663 733 $ US |
| 2022 | −158 565 740 395 $ US | 11 000 808 302 $ US |
| 2021 | −26 203 979 027 $ US | 13 804 496 055 $ US |
| 2020 | −13 587 503 404 $ US | 13 021 165 408 $ US |
| 2019 | −14 829 877 577 $ US | 6 557 503 906 $ US |
| 2018 | 964 471 415 $ US | 2 413 018 727 $ US |
| 2017 | 37 424 841 039 $ US | 6 004 796 901 $ US |
| 2016 | 40 295 828 111 $ US | 5 128 475 225 $ US |
| 2015 | −24 640 621 321 $ US | 8 575 319 326 $ US |
| 2014 | −127 067 136 943 $ US | 3 984 226 053 $ US |
| 2013 | −125 688 992 897 $ US | 4 406 103 796 $ US |
| 2012 | −103 017 334 054 $ US | −1 392 248 402 $ US |
| 2011 | −40 334 797 700 $ US | −1 462 187 515 $ US |
| 2010 | 77 030 184 880 $ US | 3 412 251 219 $ US |
| 2009 | 23 690 260 030 $ US | 4 198 677 110 $ US |
| 2008 | 17 356 895 109 $ US | −2 287 048 495 $ US |
| 2007 | 80 582 742 763 $ US | −2 539 773 861 $ US |
| 2006 | 59 659 000 527 $ US | −575 153 283 $ US |
| 2005 | 67 663 961 124 $ US | −1 009 500 635 $ US |
| 2004 | 93 354 468 404 $ US | −793 186 301 $ US |
| 2003 | 72 560 562 736 $ US | −1 975 804 879 $ US |
| 2002 | 52 861 517 849 $ US | −4 669 753 894 $ US |
| 2001 | 25 985 588 613 $ US | −4 222 578 168 $ US |
| 2000 | 67 799 063 708 $ US | −1 098 518 628 $ US |
| 1999 | 68 865 072 147 $ US | −3 810 722 999 $ US |
| 1998 | 71 492 903 649 $ US | −3 730 624 984 $ US |
| 1997 | 44 200 018 348 $ US | −5 975 502 116 $ US |
| 1996 | 18 591 806 698 $ US | −8 351 877 056 $ US |
| 1995 | 68 922 257 802 $ US | −8 115 948 262 $ US |
| 1994 | 93 444 922 990 $ US | −6 867 235 894 $ US |
| 1993 | 95 479 406 967 $ US | −6 232 770 220 $ US |
| 1992 | 80 350 537 263 $ US | −4 720 523 362 $ US |
| 1991 | 53 732 293 939 $ US | −5 509 077 267 $ US |
| 1990 | 24 355 543 277 $ US | −3 103 552 723 $ US |
| 1989 | 41 293 261 160 $ US | −2 010 870 382 $ US |
| 1988 | 60 323 819 348 $ US | −2 800 375 258 $ US |
| 1987 | 70 124 276 208 $ US | −3 498 185 125 $ US |
| 1986 | 76 375 001 632 $ US | −1 649 481 113 $ US |
| 1985 | 44 629 778 842 $ US | −1 698 280 601 $ US |
| 1984 | 32 246 208 254 $ US | −2 488 666 439 $ US |
| 1983 | 19 079 902 169 $ US | −3 259 483 986 $ US |
| 1982 | 6 219 770 858 $ US | −3 188 683 128 $ US |
| 1981 | 7 475 883 734 $ US | −3 131 228 070 $ US |
| 1980 | −10 762 068 406 $ US | −2 559 607 843 $ US |
| 1979 | −10 178 503 568 $ US | −2 851 200 000 $ US |
| 1978 | 16 145 734 415 $ US | −2 447 647 059 $ US |
| 1977 | 10 673 368 053 $ US | −1 834 000 000 $ US |
| 1976 | 3 911 996 800 $ US | −2 433 750 000 $ US |
| 1975 | −316 462 115 $ US | −3 438 333 333 $ US |
| 1974 | −3 967 665 540 $ US | −3 132 500 000 $ US |
| 1973 | −231 313 286 $ US | −2 412 500 000 $ US |
| 1972 | 6 834 642 809 $ US | −925 000 000 $ US |
| 1971 | 6 099 709 614 $ US | −1 000 000 000 $ US |
| 1970 | 2 454 150 061 $ US | −1 283 333 333 $ US |
En 2025, la balance commerciale du Japon affichait un déficit de 26,8 milliards de dollars et celle d'Israël un excédent de 13 milliards de dollars. En 1970, la balance commerciale du Japon affichait un excédent de 2,45 milliards de dollars et celle d'Israël un déficit de 1,28 milliard de dollars.
De 1970 à 2025, la balance commerciale du Japon a été excédentaire pendant 39 des 56 années, et celle d'Israël pendant 15. Les balances commerciales du Japon et d'Israël ont été déficitaires en même temps pendant 7 de ces années, la dernière fois en 2012.
Japon vs Israël : chiffres de la balance commerciale
|
Japon
|
Israël
|
|
|---|---|---|
| Biens et services, $ US | −26,8 Md $US (2025) | +13,0 Md $US (2025) |
| % du PIB | −0,6 % (2025) | +2,1 % (2025) |
| Années d'excédent depuis 2000 | 14 sur 26 | 15 sur 26 |
| Solde des biens entre les deux, chiffres propres | −384 M $US (2025) | −781 M $US (2025) |
| Premier excédent en biens avec | États-Unis (+49,5 Md $US, 2025) | États-Unis (+6,12 Md $US, 2025) |
| Premier déficit en biens avec | Chine (−53,0 Md $US, 2025) | Chine (−18,0 Md $US, 2025) |
Comparer la balance commerciale de 2 pays au choix
Sources :
- Banque mondiale | Économie et croissance (1970–2025, mis à jour en octobre 2026)
- TradeMap (2001–2025, mis à jour en octobre 2026)
Creative Commons Attribution (CC BY) : vous pouvez copier, partager, adapter et réutiliser ce contenu, y compris à des fins commerciales, à condition de citer statistics.wiki et d’indiquer les modifications apportées. Les sources citées ci-dessus peuvent avoir leurs propres conditions de licence.