
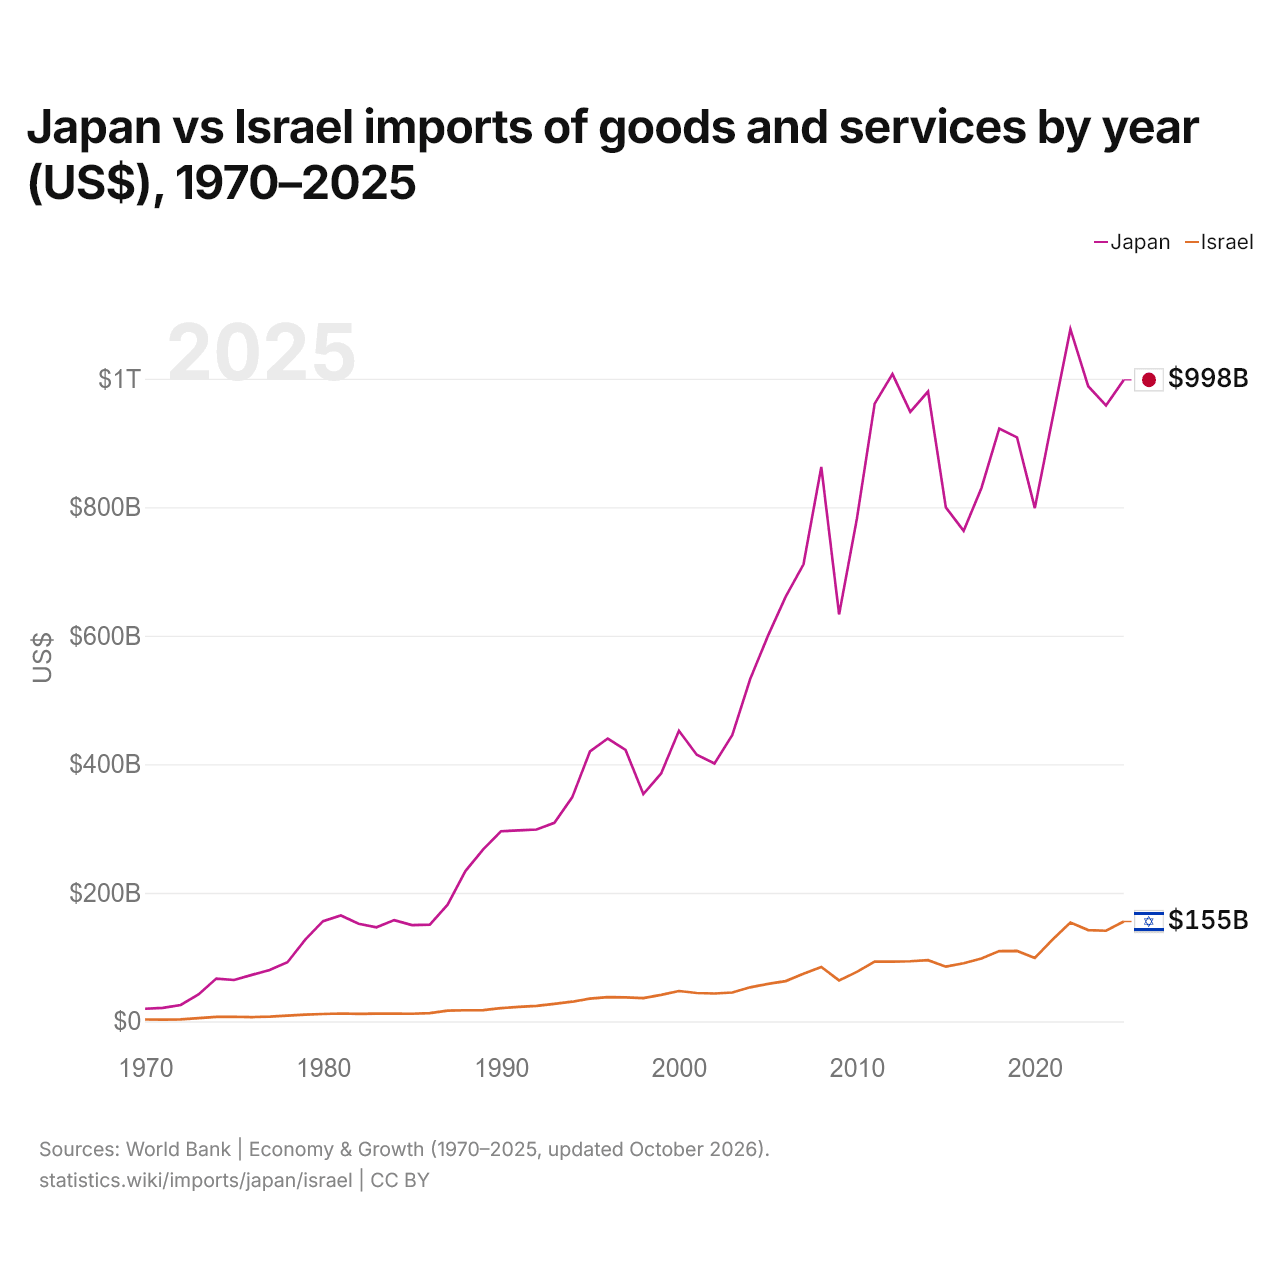
Japon vs Israël : importations de biens et services par année ($ US), 1970–2025
| Année | $ US | |
|---|---|---|
 Japon |
 Israël |
|
| 2025 | 998 125 889 632 $ US | 155 326 013 611 $ US |
| 2024 | 958 381 808 469 $ US | 140 903 132 496 $ US |
| 2023 | 988 160 815 442 $ US | 141 949 720 798 $ US |
| 2022 | 1 076 977 967 309 $ US | 153 716 570 794 $ US |
| 2021 | 938 755 726 387 $ US | 127 330 211 936 $ US |
| 2020 | 798 645 128 767 $ US | 98 559 641 596 $ US |
| 2019 | 908 590 987 611 $ US | 109 553 655 514 $ US |
| 2018 | 922 228 472 389 $ US | 109 319 594 929 $ US |
| 2017 | 829 948 316 864 $ US | 97 866 153 832 $ US |
| 2016 | 763 174 802 439 $ US | 90 475 144 467 $ US |
| 2015 | 799 671 850 412 $ US | 85 081 011 363 $ US |
| 2014 | 980 024 678 768 $ US | 95 211 692 531 $ US |
| 2013 | 948 362 884 512 $ US | 93 509 987 330 $ US |
| 2012 | 1 007 099 152 148 $ US | 92 906 239 603 $ US |
| 2011 | 961 182 364 174 $ US | 93 102 471 848 $ US |
| 2010 | 782 080 174 983 $ US | 76 948 241 162 $ US |
| 2009 | 633 184 104 751 $ US | 63 709 559 037 $ US |
| 2008 | 862 718 956 651 $ US | 84 526 756 689 $ US |
| 2007 | 711 118 565 478 $ US | 74 068 549 938 $ US |
| 2006 | 660 752 902 210 $ US | 62 604 628 574 $ US |
| 2005 | 599 781 161 369 $ US | 58 276 695 189 $ US |
| 2004 | 532 277 504 090 $ US | 52 895 820 616 $ US |
| 2003 | 445 643 407 643 $ US | 44 932 193 847 $ US |
| 2002 | 401 205 059 495 $ US | 43 363 108 827 $ US |
| 2001 | 414 845 357 771 $ US | 44 056 142 854 $ US |
| 2000 | 452 064 900 177 $ US | 47 200 194 491 $ US |
| 1999 | 385 717 972 939 $ US | 41 207 853 226 $ US |
| 1998 | 353 663 297 055 $ US | 36 163 743 059 $ US |
| 1997 | 422 282 171 634 $ US | 37 372 736 708 $ US |
| 1996 | 440 058 798 060 $ US | 37 635 231 381 $ US |
| 1995 | 420 000 722 946 $ US | 35 385 120 380 $ US |
| 1994 | 348 440 138 620 $ US | 30 559 356 049 $ US |
| 1993 | 308 939 565 351 $ US | 27 078 766 828 $ US |
| 1992 | 298 544 112 852 $ US | 24 174 277 988 $ US |
| 1991 | 297 072 083 274 $ US | 22 534 110 833 $ US |
| 1990 | 295 830 930 469 $ US | 20 435 071 421 $ US |
| 1989 | 267 623 386 903 $ US | 17 498 729 910 $ US |
| 1988 | 233 782 306 438 $ US | 17 261 772 469 $ US |
| 1987 | 181 576 008 988 $ US | 16 608 825 411 $ US |
| 1986 | 150 490 328 139 $ US | 12 705 184 837 $ US |
| 1985 | 149 721 341 618 $ US | 11 785 377 046 $ US |
| 1984 | 157 511 814 670 $ US | 12 012 629 604 $ US |
| 1983 | 146 249 637 386 $ US | 12 014 412 811 $ US |
| 1982 | 151 713 508 329 $ US | 11 726 255 144 $ US |
| 1981 | 164 658 527 096 $ US | 12 228 947 368 $ US |
| 1980 | 155 866 963 511 $ US | 11 434 705 882 $ US |
| 1979 | 127 175 652 405 $ US | 10 380 400 000 $ US |
| 1978 | 91 906 326 826 $ US | 8 833 529 412 $ US |
| 1977 | 79 894 824 196 $ US | 7 348 000 000 $ US |
| 1976 | 72 270 446 349 $ US | 6 588 750 000 $ US |
| 1975 | 64 302 596 002 $ US | 7 091 666 667 $ US |
| 1974 | 66 503 972 919 $ US | 6 822 500 000 $ US |
| 1973 | 41 807 597 571 $ US | 5 057 500 000 $ US |
| 1972 | 25 436 329 222 $ US | 3 042 500 000 $ US |
| 1971 | 20 867 004 112 $ US | 2 580 000 000 $ US |
| 1970 | 19 572 635 781 $ US | 2 800 000 000 $ US |
En 2025, les importations de biens et services du Japon s'élevaient à 998 milliards de dollars et celles d'Israël à 155 milliards de dollars : celles du Japon étaient 6,4 fois plus élevées. En 1970, les importations du Japon étaient 7,0 fois plus élevées : 19,6 milliards de dollars pour le Japon et 2,8 milliards de dollars pour Israël.
Les importations de biens et services du Japon sont supérieures à celles d'Israël chaque année depuis 1970.
Japon vs Israël : chiffres des importations
|
Japon
|
Israël
|
|
|---|---|---|
| Importations | 998 Md $US (2025) | 155 Md $US (2025) |
| Rang mondial | 6/174 | 39/174 |
| Part mondiale | 2,96 % | 0,46 % |
| % du PIB | 22,5 % | 25,4 % |
| Première catégorie de biens | Machines, électronique et véhicules (34,1 %, 2025) | Machines, électronique et véhicules (40,1 %, 2025) |
| Première origine des biens | Chine (23,6 %, 2025) | Chine (21,8 %, 2025) |
Comparer les importations de 2 pays au choix
Sources :
- Banque mondiale | Économie et croissance (1970–2025, mis à jour en octobre 2026)
- TradeMap (2001–2025, mis à jour en octobre 2026)
Creative Commons Attribution (CC BY) : vous pouvez copier, partager, adapter et réutiliser ce contenu, y compris à des fins commerciales, à condition de citer statistics.wiki et d’indiquer les modifications apportées. Les sources citées ci-dessus peuvent avoir leurs propres conditions de licence.