
Importations de biens et services de la Syrie par année ($ US)
| Année | $ US | Rang mondial |
|---|---|---|
| Importations | Rang mondial | |
| 2022 | 6 803 218 572 $ US | #131 |
| 2021 | 6 560 493 570 $ US | #125 |
| 2020 | 3 750 745 660 $ US | #134 |
| 2019 | 6 546 690 317 $ US | #122 |
| 2018 | 7 683 752 902 $ US | #115 |
| 2017 | 6 828 054 268 $ US | #116 |
| 2016 | 5 723 436 973 $ US | #121 |
| 2015 | 6 058 999 272 $ US | #122 |
| 2014 | 10 159 432 249 $ US | #103 |
| 2013 | 7 888 121 085 $ US | #110 |
| 2012 | 11 943 881 866 $ US | #97 |
| 2011 | 21 157 918 970 $ US | #75 |
| 2010 | 19 548 915 139 $ US | #74 |
| 2009 | 16 712 093 143 $ US | #75 |
| 2008 | 19 270 827 060 $ US | #75 |
| 2007 | 15 289 807 769 $ US | #76 |
| 2006 | 11 878 533 724 $ US | #79 |
| 2005 | 11 281 149 425 $ US | #75 |
| 2004 | 9 449 227 723 $ US | #75 |
| 2003 | 6 404 206 462 $ US | #81 |
| 2002 | 6 591 622 611 $ US | #77 |
| 2001 | 6 168 564 305 $ US | #74 |
| 2000 | 5 523 717 815 $ US | #72 |
| 1999 | 5 078 313 953 $ US | #73 |
| 1998 | 4 696 403 846 $ US | #80 |
| 1997 | 4 903 093 385 $ US | #75 |
| 1996 | 5 252 195 609 $ US | #70 |
| 1995 | 4 323 552 894 $ US | #75 |
| 1994 | 4 594 640 000 $ US | #68 |
| 1993 | 5 602 184 892 $ US | #61 |
| 1992 | 4 987 517 654 $ US | #62 |
| 1991 | 4 163 791 667 $ US | #64 |
| 1990 | 3 440 367 130 $ US | #67 |
| 1989 | 2 965 896 087 $ US | #60 |
| 1988 | 2 749 847 766 $ US | #61 |
| 1987 | 3 286 057 265 $ US | #56 |
| 1986 | 2 957 326 806 $ US | #57 |
| 1985 | 4 173 565 121 $ US | #51 |
| 1984 | 4 200 952 492 $ US | #50 |
| 1983 | 4 691 609 868 $ US | #49 |
| 1982 | 4 063 358 923 $ US | #52 |
| 1981 | 5 116 427 206 $ US | #50 |
| 1980 | 4 628 789 809 $ US | #50 |
| 1979 | 3 575 286 624 $ US | #49 |
| 1978 | 2 896 334 479 $ US | #50 |
| 1977 | 3 129 344 729 $ US | #46 |
| 1976 | 2 617 783 266 $ US | #47 |
| 1975 | 2 318 859 794 $ US | #48 |
| 1974 | 1 741 126 669 $ US | #50 |
| 1973 | 834 756 899 $ US | #52 |
| 1972 | 725 132 626 $ US | #53 |
| 1971 | 578 539 108 $ US | #55 |
| 1970 | 450 739 692 $ US | #56 |
| 1969 | 486 948 413 $ US | - |
| 1968 | 359 837 643 $ US | - |
| 1967 | 302 663 381 $ US | - |
| 1966 | 308 588 670 $ US | - |
| 1965 | 250 835 033 $ US | - |
| 1964 | 257 291 283 $ US | - |
| 1963 | 254 143 979 $ US | - |
| 1962 | 239 475 799 $ US | - |
| 1961 | 211 572 011 $ US | - |
| 1960 | 238 438 296 $ US | - |
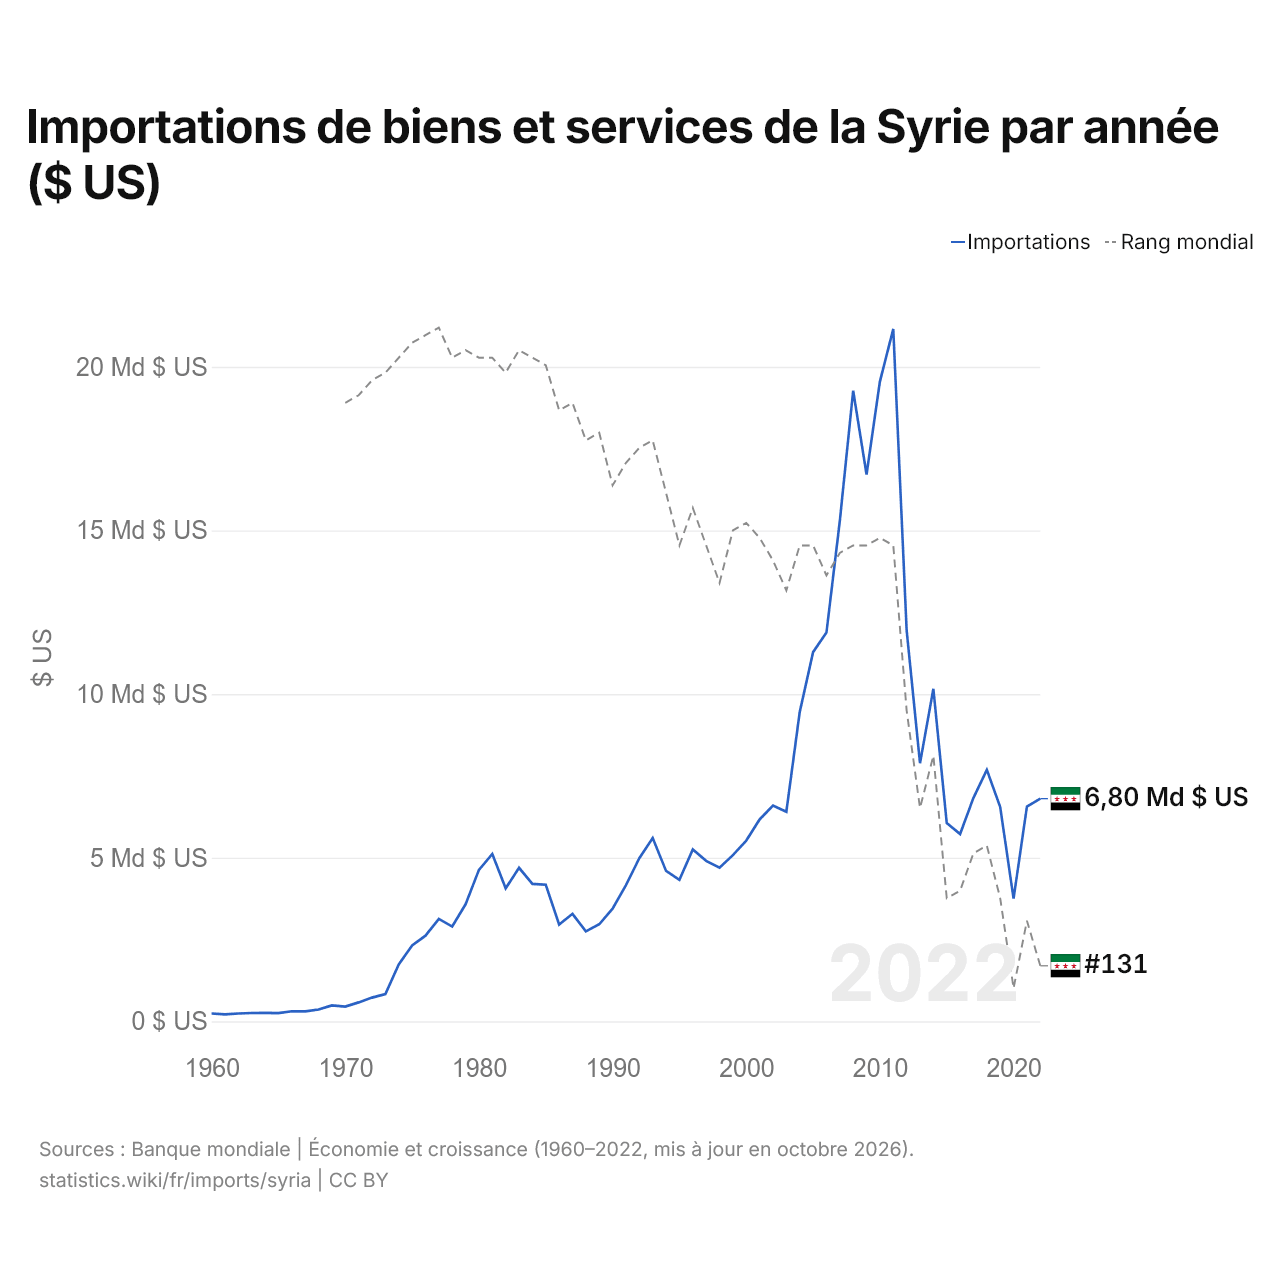
Les importations de biens et services de la Syrie s'élèvent à 6,8 milliards de dollars (2022), contre 238 millions de dollars en 1960. Le maximum a été de 21,2 milliards de dollars, en 2011. Elles se classent au 131e rang mondial, en baisse par rapport au 125e rang l'année précédente. Leur meilleur rang a été le 46e, occupé pour la dernière fois en 1977.
Les importations de biens et services de la Syrie sont les 41es plus élevées de 44 pays situés en Asie. Les importations de la Syrie dépassent ses exportations de 5,19 milliards de dollars, soit un déficit commercial (2022). Le commerce de la Syrie, exportations et importations réunies, équivaut à 35,4 % de son PIB (2022), au 158e rang mondial.
Importations de biens et de services de la Syrie ($ US)
| Année | $ US | |
|---|---|---|
| Biens | Services | |
| 2010 | 15 875 729 420 $ US | 3 533 066 693 $ US |
| 2009 | 13 932 561 664 $ US | 2 734 215 492 $ US |
| 2008 | 16 107 236 177 $ US | 3 171 166 633 $ US |
| 2007 | 12 276 793 014 $ US | 3 012 511 531 $ US |
| 2006 | 9 359 000 000 $ US | 2 520 000 000 $ US |
| 2005 | 8 742 000 000 $ US | 2 359 000 000 $ US |
| 2004 | 6 957 000 000 $ US | 2 235 000 000 $ US |
| 2003 | 4 382 000 000 $ US | 1 806 000 000 $ US |
| 2002 | 4 458 000 000 $ US | 1 883 000 000 $ US |
| 2001 | 4 282 000 000 $ US | 1 694 000 000 $ US |
| 2000 | 3 723 000 000 $ US | 1 667 000 000 $ US |
| 1999 | 3 590 000 000 $ US | 1 612 000 000 $ US |
| 1998 | 3 320 000 000 $ US | 1 491 000 000 $ US |
| 1997 | 3 603 000 000 $ US | 1 489 000 000 $ US |
| 1996 | 4 516 000 000 $ US | 1 555 000 000 $ US |
| 1995 | 4 004 000 000 $ US | 1 537 000 000 $ US |
| 1994 | 4 604 000 000 $ US | 1 611 000 000 $ US |
| 1993 | 3 512 000 000 $ US | 1 442 000 000 $ US |
| 1992 | 2 941 000 000 $ US | 1 102 100 000 $ US |
| 1991 | 2 354 000 000 $ US | 1 002 300 000 $ US |
| 1990 | 2 062 400 000 $ US | 892 300 000 $ US |
| 1989 | 1 820 600 000 $ US | 792 400 000 $ US |
| 1988 | 1 986 300 000 $ US | 636 400 000 $ US |
| 1987 | 2 225 800 000 $ US | 689 900 000 $ US |
| 1986 | 2 363 200 000 $ US | 698 800 000 $ US |
| 1985 | 3 945 700 000 $ US | 974 500 000 $ US |
| 1984 | 3 687 200 000 $ US | 905 500 000 $ US |
| 1983 | 4 024 000 000 $ US | 853 600 000 $ US |
| 1982 | 3 635 500 000 $ US | 757 000 000 $ US |
| 1981 | 4 404 000 000 $ US | 813 900 000 $ US |
| 1980 | 4 009 700 000 $ US | 521 000 000 $ US |
| 1979 | 3 055 100 000 $ US | 590 100 000 $ US |
| 1978 | 2 203 500 000 $ US | 579 400 000 $ US |
| 1977 | 2 402 000 000 $ US | 418 100 000 $ US |
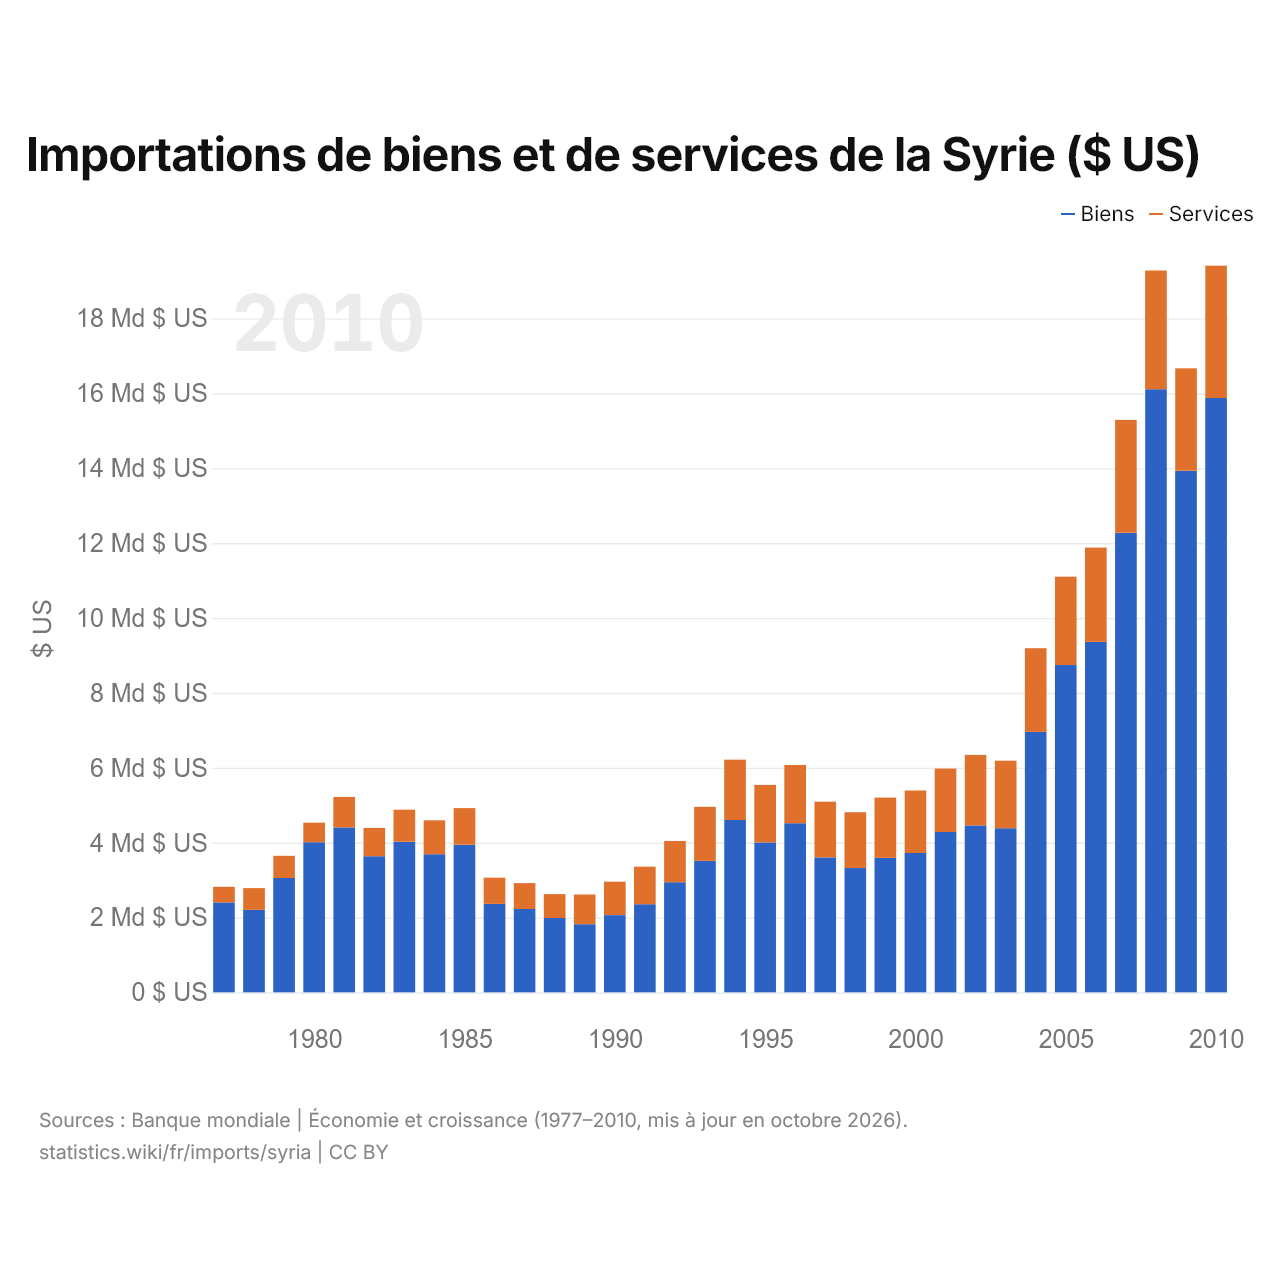
Les importations de biens de la Syrie s'élèvent à 15,9 milliards de dollars (2010) et celles de services à 3,53 milliards de dollars ; les services représentent 18,2 % du total, contre 14,8 % en 1977.
La Syrie dans le classement mondial des importations
| Rang | Pays | Importations | Part mondiale | |
|---|---|---|---|---|
| 128 |
 Congo-Brazza |
7,12 Md $US (2025) | 0,02 % | |
| 129 |
 Zambie |
6,97 Md $US (2024) | 0,02 % | |
| 130 |
 Turkménistan |
6,82 Md $US (2025) | 0,02 % | |
| 131 |
 Syrie |
6,80 Md $US | 0,02 % | |
| 132 |
 Bahamas |
6,56 Md $US (2024) | 0,02 % | |
| 133 |
 Madagascar |
6,46 Md $US (2025) | 0,02 % | |
| 134 |
 Mauritanie |
6,33 Md $US (2025) | 0,02 % |
Importations de biens et services de la Syrie, % du PIB
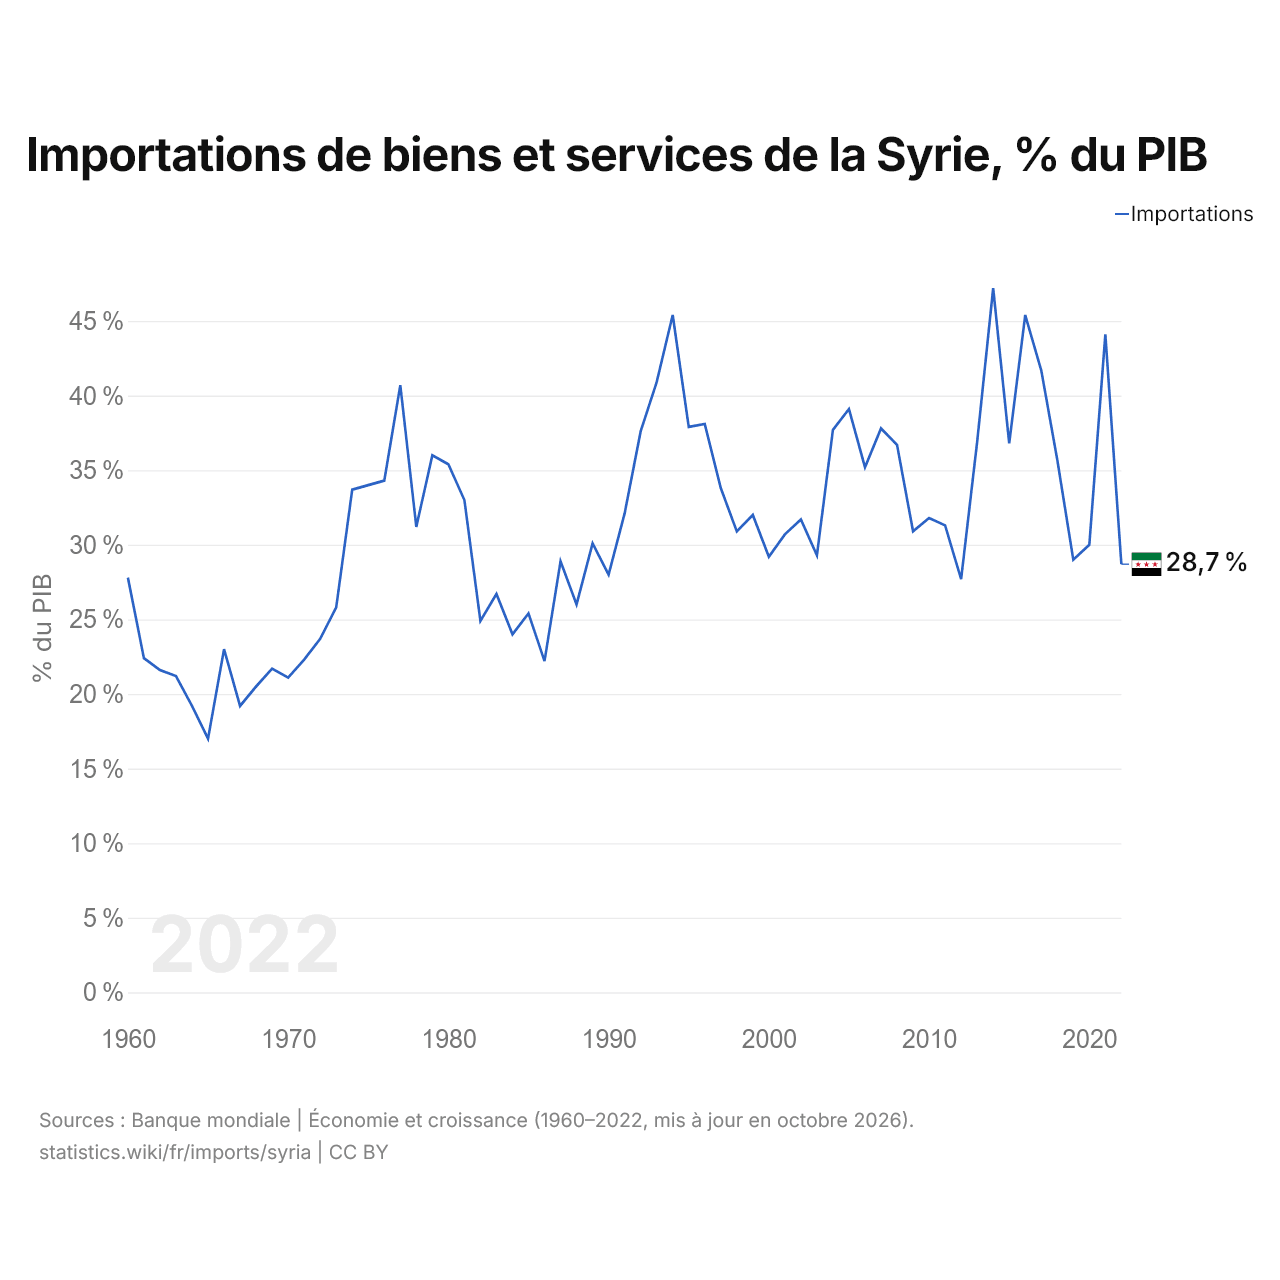
Les importations de biens et services de la Syrie équivalent à 28,7 % de son PIB (2022), contre 27,8 % en 1960. La part la plus élevée a été de 47,2 %, en 2014.
Comparer les importations de la Syrie avec celles d'autres pays
Sources :
- Banque mondiale | Économie et croissance (1960–2025, mis à jour en octobre 2026)
- TradeMap (2010, mis à jour en octobre 2026)
Creative Commons Attribution (CC BY) : vous pouvez copier, partager, adapter et réutiliser ce contenu, y compris à des fins commerciales, à condition de citer statistics.wiki et d’indiquer les modifications apportées. Les sources citées ci-dessus peuvent avoir leurs propres conditions de licence.