
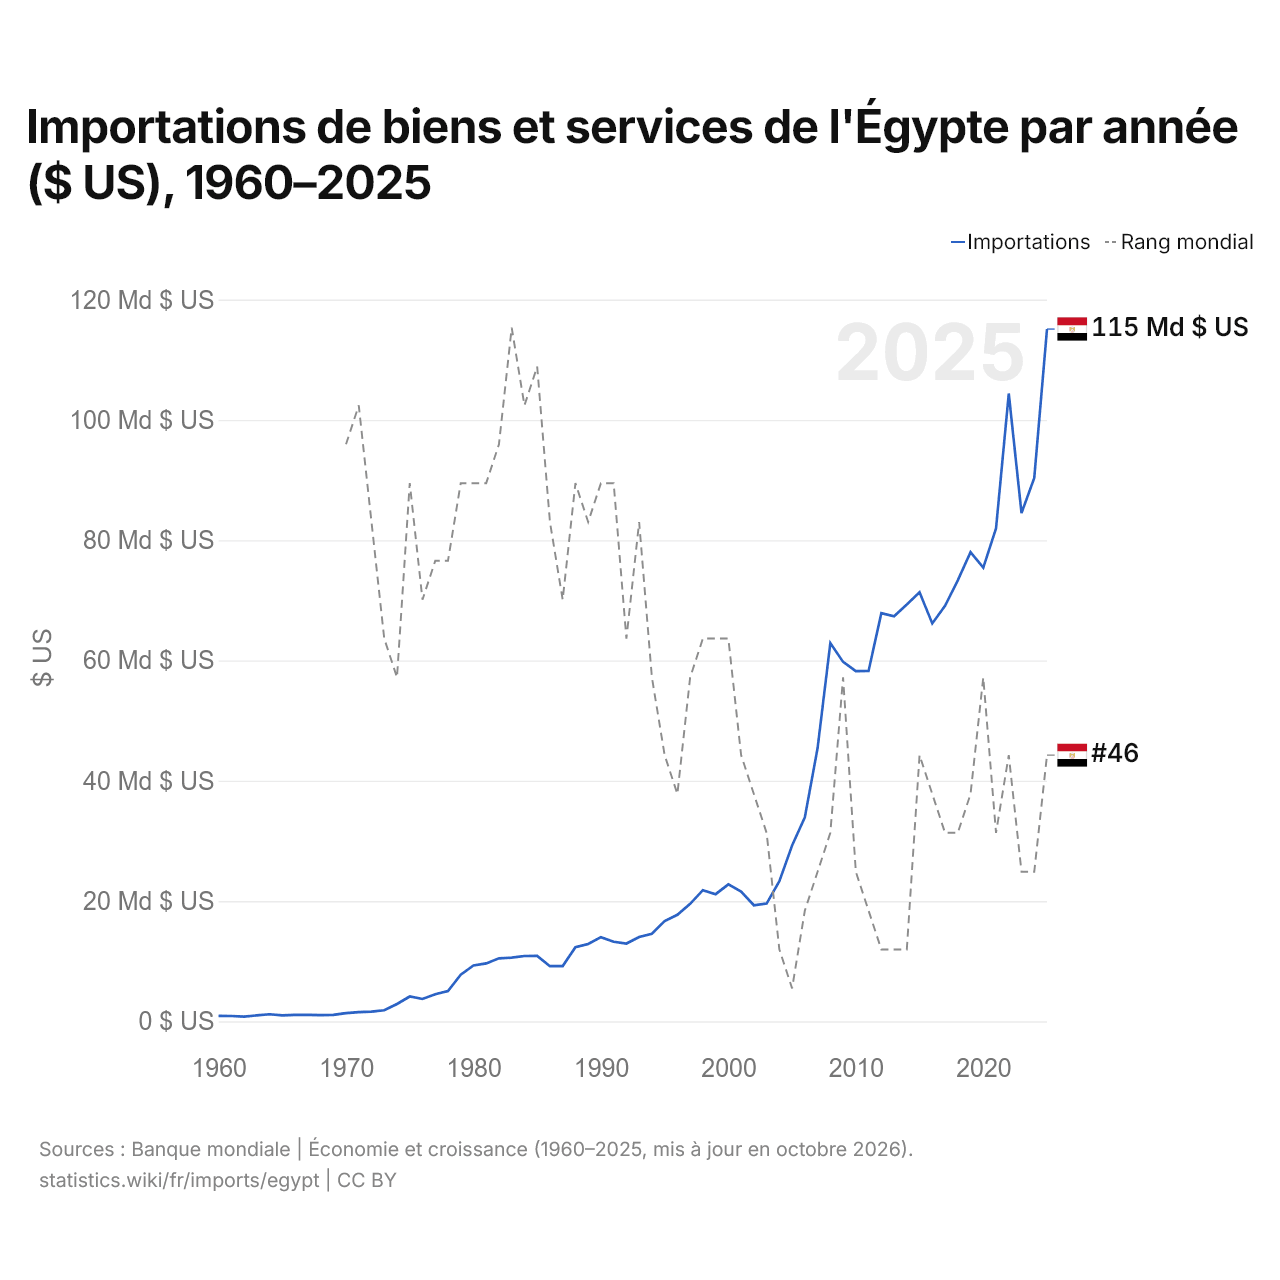
Importations de biens et services de l'Égypte par année ($ US), 1960–2025
| Année | $ US | Rang mondial |
|---|---|---|
| Importations | Rang mondial | |
| 2025 | 115 107 510 878 $ US | #46 |
| 2024 | 90 357 257 364 $ US | #49 |
| 2023 | 84 507 685 810 $ US | #49 |
| 2022 | 104 389 057 751 $ US | #46 |
| 2021 | 81 943 913 321 $ US | #48 |
| 2020 | 75 433 562 071 $ US | #44 |
| 2019 | 78 012 528 474 $ US | #47 |
| 2018 | 73 331 457 513 $ US | #48 |
| 2017 | 69 089 673 913 $ US | #48 |
| 2016 | 66 159 509 202 $ US | #47 |
| 2015 | 71 347 708 895 $ US | #46 |
| 2014 | 69 296 987 088 $ US | #51 |
| 2013 | 67 364 341 085 $ US | #51 |
| 2012 | 67 866 666 667 $ US | #51 |
| 2011 | 58 261 617 900 $ US | #50 |
| 2010 | 58 221 415 608 $ US | #49 |
| 2009 | 59 764 065 336 $ US | #44 |
| 2008 | 62 909 090 909 $ US | #48 |
| 2007 | 45 429 071 804 $ US | #49 |
| 2006 | 33 913 043 478 $ US | #50 |
| 2005 | 29 237 429 237 $ US | #52 |
| 2004 | 23 311 688 312 $ US | #51 |
| 2003 | 19 576 923 077 $ US | #48 |
| 2002 | 19 303 370 787 $ US | #47 |
| 2001 | 21 590 296 496 $ US | #46 |
| 2000 | 22 779 979 451 $ US | #43 |
| 1999 | 21 144 205 249 $ US | #43 |
| 1998 | 21 812 278 630 $ US | #43 |
| 1997 | 19 528 023 599 $ US | #44 |
| 1996 | 17 718 160 377 $ US | #47 |
| 1995 | 16 661 751 696 $ US | #46 |
| 1994 | 14 561 091 340 $ US | #44 |
| 1993 | 14 015 606 242 $ US | #40 |
| 1992 | 12 938 946 228 $ US | #43 |
| 1991 | 13 226 985 710 $ US | #39 |
| 1990 | 13 997 308 210 $ US | #39 |
| 1989 | 12 856 257 745 $ US | #40 |
| 1988 | 12 322 544 009 $ US | #39 |
| 1987 | 9 190 887 667 $ US | #42 |
| 1986 | 9 167 446 211 $ US | #40 |
| 1985 | 10 888 912 156 $ US | #36 |
| 1984 | 10 857 880 026 $ US | #37 |
| 1983 | 10 593 713 620 $ US | #35 |
| 1982 | 10 472 660 099 $ US | #38 |
| 1981 | 9 628 783 784 $ US | #39 |
| 1980 | 9 289 542 760 $ US | #39 |
| 1979 | 7 743 714 286 $ US | #39 |
| 1978 | 5 026 531 231 $ US | #41 |
| 1977 | 4 516 926 855 $ US | #41 |
| 1976 | 3 717 576 961 $ US | #42 |
| 1975 | 4 134 809 294 $ US | #39 |
| 1974 | 2 888 427 176 $ US | #44 |
| 1973 | 1 834 007 074 $ US | #43 |
| 1972 | 1 615 822 130 $ US | #40 |
| 1971 | 1 530 986 993 $ US | #37 |
| 1970 | 1 374 780 206 $ US | #38 |
| 1969 | 1 078 692 494 $ US | - |
| 1968 | 1 035 981 308 $ US | - |
| 1967 | 1 071 428 571 $ US | - |
| 1966 | 1 081 156 918 $ US | - |
| 1965 | 996 286 588 $ US | - |
| 1964 | 1 171 388 946 $ US | - |
| 1963 | 987 619 111 $ US | - |
| 1962 | 787 660 480 $ US | - |
| 1961 | 887 313 994 $ US | - |
| 1960 | 918 039 754 $ US | - |
En 2025, les importations de biens et services de l'Égypte s'élevaient à 115 milliards de dollars, contre 918 millions de dollars en 1960. Le minimum a été de 788 millions de dollars, en 1962. Elles se classaient au 46e rang mondial, en hausse par rapport au 49e rang en 2024. Leur meilleur rang a été le 35e, occupé pour la dernière fois en 1983.
En 2025, les importations de biens et services de l'Égypte étaient les 2es plus élevées de 50 pays situés en Afrique, après celles de l'Afrique du Sud. En 2025, les importations de l'Égypte dépassaient ses exportations de 42,7 milliards de dollars, soit un déficit commercial. Le commerce de l'Égypte, exportations et importations réunies, équivalait à 51,3 % de son PIB en 2025, au 132e rang mondial.
Importations de biens de l'Égypte par catégorie, 2025
Importations de biens, 2025: 101 Md $US
En 2025, la première catégorie des importations de biens de l'Égypte était « pétrole, gaz, minerais et autres matières premières », avec 25,2 %, suivie de « machines, électronique et véhicules », avec 23,2 %.
Origines des importations de biens de l'Égypte : les 10 premières, 2025
| Rang | Pays | Importations de biens | Part | |
|---|---|---|---|---|
| 1 |
 Chine |
18,8 Md $US | 18,6 % | |
| 2 |
 États-Unis |
12,8 Md $US | 12,6 % | |
| 3 |
 Arabie saoudite |
9,45 Md $US | 9,36 % | vs Arabie saoudite |
| 4 |
 Russie |
5,19 Md $US | 5,14 % | |
| 5 |
 Allemagne |
4,35 Md $US | 4,31 % | vs Allemagne |
| 6 |
 Brésil |
4,34 Md $US | 4,3 % | |
| 7 |
 Turquie |
3,66 Md $US | 3,62 % | vs Turquie |
| 8 |
 Inde |
3,63 Md $US | 3,6 % | vs Inde |
| 9 |
 Italie |
2,90 Md $US | 2,87 % | vs Italie |
| 10 |
 EAU |
2,64 Md $US | 2,61 % | vs EAU |
| Autres partenaires et non précisés | 33,3 Md $US | 33 % |
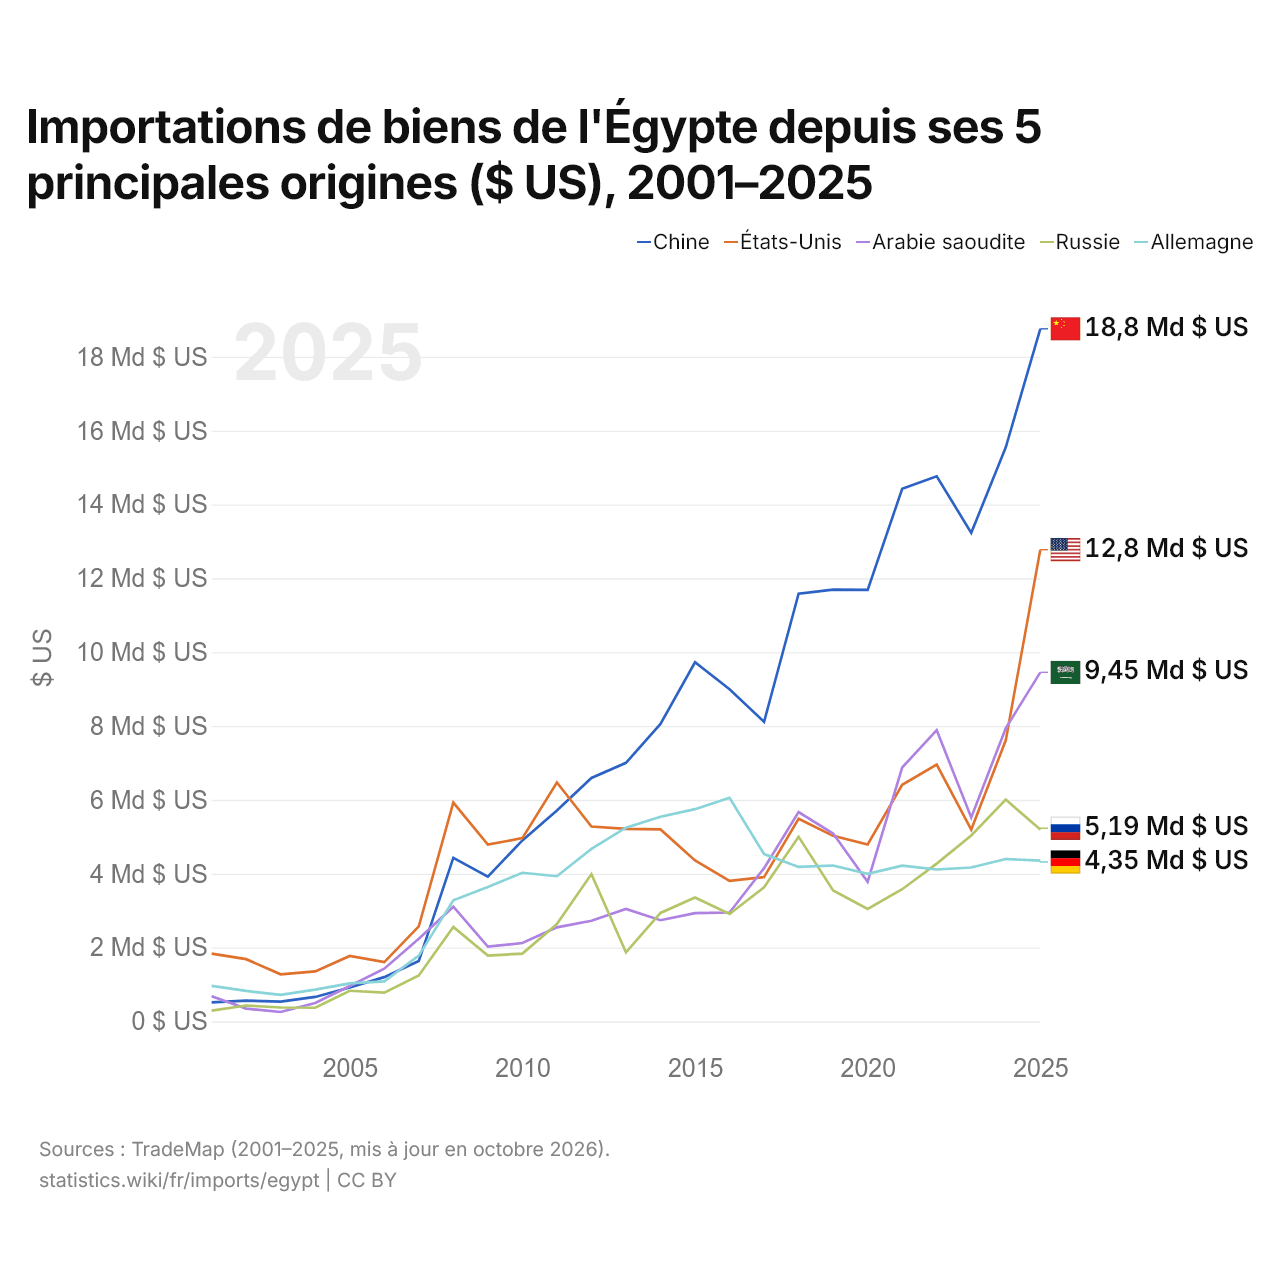
Importations de biens de l'Égypte depuis ses 5 principales origines ($ US), 2001–2025
| Année | $ US | ||||
|---|---|---|---|---|---|
| Chine | États-Unis | Arabie saoudite | Russie | Allemagne | |
| 2025 | 18 757 378 000 $ US | 12 775 142 000 $ US | 9 452 609 000 $ US | 5 193 419 000 $ US | 4 351 857 000 $ US |
| 2024 | 15 548 581 000 $ US | 7 612 638 000 $ US | 7 940 588 000 $ US | 6 007 183 000 $ US | 4 396 305 000 $ US |
| 2023 | 13 230 940 000 $ US | 5 193 015 000 $ US | 5 520 948 000 $ US | 5 035 197 000 $ US | 4 165 523 000 $ US |
| 2022 | 14 764 248 000 $ US | 6 953 220 000 $ US | 7 885 821 000 $ US | 4 273 229 000 $ US | 4 112 450 000 $ US |
| 2021 | 14 424 153 000 $ US | 6 407 995 000 $ US | 6 875 829 000 $ US | 3 578 212 000 $ US | 4 215 166 000 $ US |
| 2020 | 11 685 672 000 $ US | 4 791 484 000 $ US | 3 780 760 000 $ US | 3 043 123 000 $ US | 3 996 953 000 $ US |
| 2019 | 11 691 714 000 $ US | 5 024 088 000 $ US | 5 087 326 000 $ US | 3 547 102 000 $ US | 4 220 736 000 $ US |
| 2018 | 11 582 163 000 $ US | 5 488 427 000 $ US | 5 668 026 000 $ US | 4 999 570 000 $ US | 4 181 621 000 $ US |
| 2017 | 8 112 424 000 $ US | 3 907 373 000 $ US | 4 149 688 000 $ US | 3 631 411 000 $ US | 4 530 960 000 $ US |
| 2016 | 8 994 896 000 $ US | 3 802 826 000 $ US | 2 947 330 000 $ US | 2 905 229 000 $ US | 6 056 648 000 $ US |
| 2015 | 9 726 052 000 $ US | 4 355 852 000 $ US | 2 931 422 000 $ US | 3 352 750 000 $ US | 5 747 290 000 $ US |
| 2014 | 8 057 649 000 $ US | 5 198 838 000 $ US | 2 738 364 000 $ US | 2 935 920 000 $ US | 5 540 056 000 $ US |
| 2013 | 7 002 779 000 $ US | 5 214 723 000 $ US | 3 042 520 000 $ US | 1 869 638 000 $ US | 5 246 839 000 $ US |
| 2012 | 6 590 725 000 $ US | 5 276 494 000 $ US | 2 722 363 000 $ US | 3 988 780 000 $ US | 4 669 976 000 $ US |
| 2011 | 5 708 258 000 $ US | 6 470 100 000 $ US | 2 546 395 000 $ US | 2 634 128 000 $ US | 3 930 009 000 $ US |
| 2010 | 4 901 783 000 $ US | 4 961 898 000 $ US | 2 120 138 000 $ US | 1 835 099 000 $ US | 4 023 948 000 $ US |
| 2009 | 3 916 706 000 $ US | 4 785 176 000 $ US | 2 021 645 000 $ US | 1 780 430 000 $ US | 3 639 430 000 $ US |
| 2008 | 4 426 055 000 $ US | 5 924 799 000 $ US | 3 106 188 000 $ US | 2 556 106 000 $ US | 3 276 446 000 $ US |
| 2007 | 1 633 246 000 $ US | 2 571 843 000 $ US | 2 238 078 000 $ US | 1 243 124 000 $ US | 1 778 780 000 $ US |
| 2006 | 1 196 672 000 $ US | 1 603 710 000 $ US | 1 424 944 000 $ US | 777 824 000 $ US | 1 083 157 000 $ US |
| 2005 | 914 544 000 $ US | 1 769 758 000 $ US | 957 429 000 $ US | 827 301 000 $ US | 1 026 113 000 $ US |
| 2004 | 661 295 000 $ US | 1 351 227 000 $ US | 496 958 000 $ US | 367 813 000 $ US | 859 655 000 $ US |
| 2003 | 535 486 000 $ US | 1 272 951 000 $ US | 252 824 000 $ US | 373 563 000 $ US | 715 867 000 $ US |
| 2002 | 560 071 000 $ US | 1 684 285 000 $ US | 344 360 000 $ US | 428 436 000 $ US | 824 475 000 $ US |
| 2001 | 512 667 000 $ US | 1 832 166 000 $ US | 678 674 000 $ US | 290 744 000 $ US | 959 707 000 $ US |
En 2025, les importations de biens s'élevaient à 18,8 milliards de dollars en provenance de la Chine, 12,8 milliards de dollars en provenance des États-Unis, 9,45 milliards de dollars en provenance de l'Arabie saoudite, 5,19 milliards de dollars en provenance de la Russie et 4,35 milliards de dollars en provenance de l'Allemagne. Le premier rang des cinq fournisseurs de l'Égypte est occupé par la Chine depuis 2012. Le changement le plus récent dans leur ordre remonte à 2025, quand les importations de l'Égypte en provenance des États-Unis ont dépassé celles en provenance de l'Arabie saoudite.
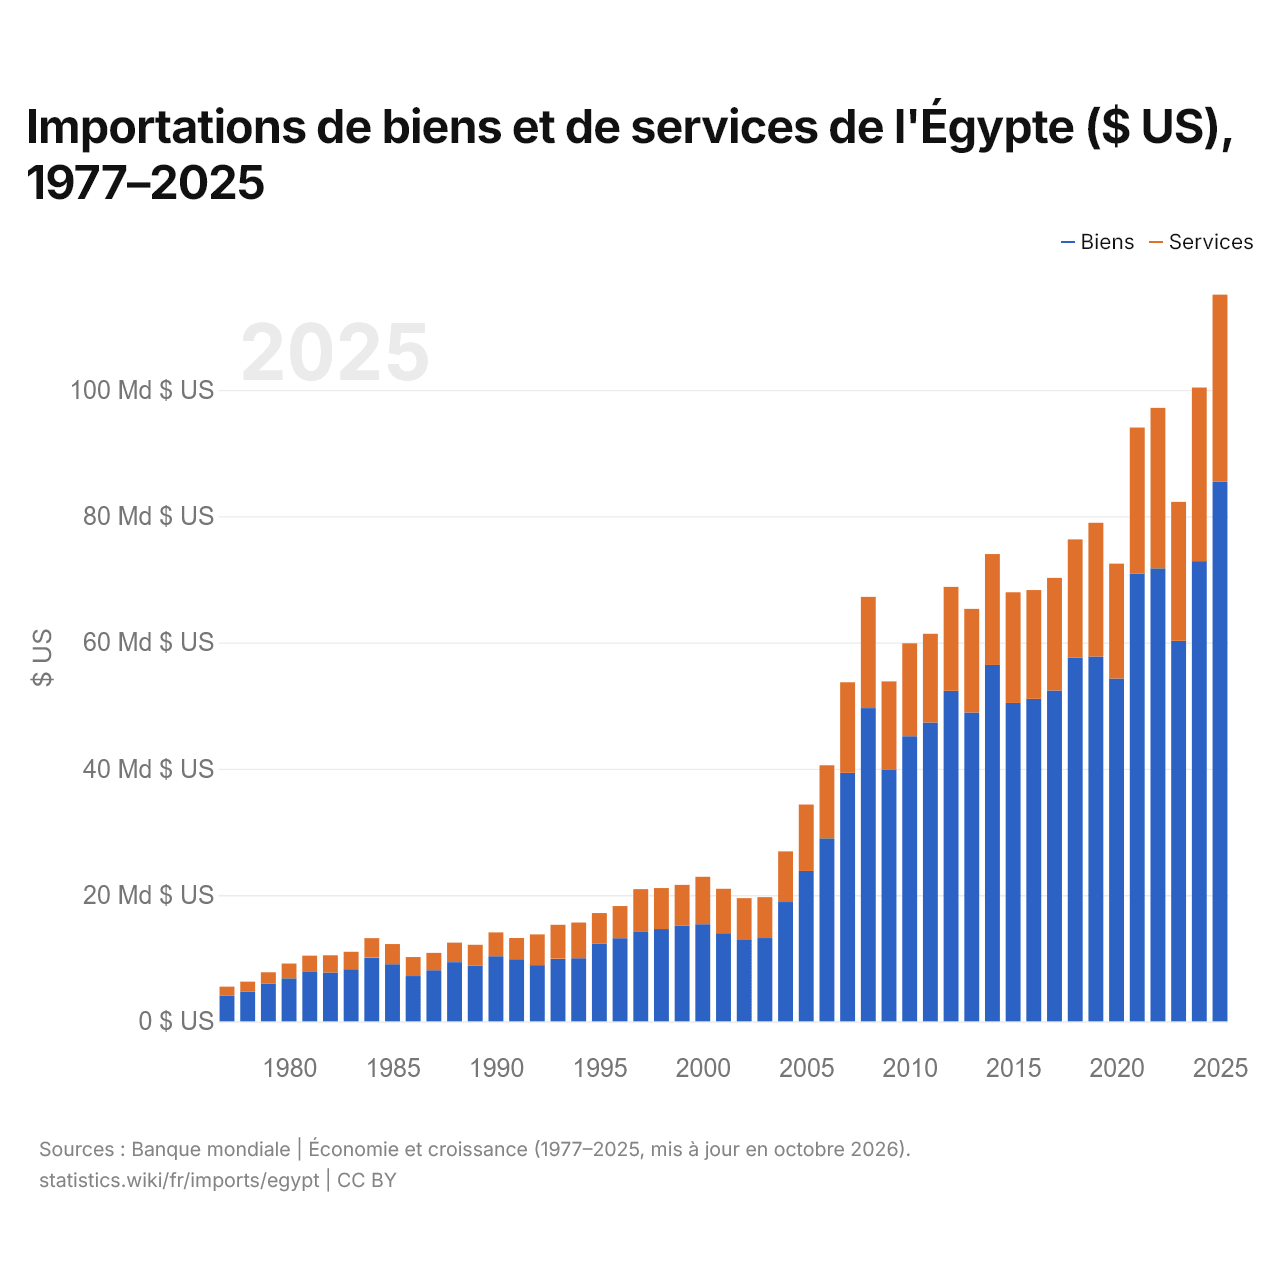
Importations de biens et de services de l'Égypte ($ US), 1977–2025
| Année | $ US | |
|---|---|---|
| Biens | Services | |
| 2025 | 85 472 012 500 $ US | 29 605 787 500 $ US |
| 2024 | 72 882 900 000 $ US | 27 494 400 000 $ US |
| 2023 | 60 259 137 500 $ US | 22 005 662 500 $ US |
| 2022 | 71 745 425 000 $ US | 25 398 320 000 $ US |
| 2021 | 70 912 800 000 $ US | 23 126 083 000 $ US |
| 2020 | 54 282 937 500 $ US | 18 199 462 500 $ US |
| 2019 | 57 757 587 500 $ US | 21 193 212 500 $ US |
| 2018 | 57 635 387 500 $ US | 18 692 712 500 $ US |
| 2017 | 52 404 100 000 $ US | 17 820 000 000 $ US |
| 2016 | 51 066 100 000 $ US | 17 235 300 000 $ US |
| 2015 | 50 419 900 000 $ US | 17 518 900 000 $ US |
| 2014 | 56 446 400 000 $ US | 17 549 600 000 $ US |
| 2013 | 48 918 100 000 $ US | 16 407 700 000 $ US |
| 2012 | 52 350 400 000 $ US | 16 450 400 000 $ US |
| 2011 | 47 311 500 000 $ US | 14 069 600 000 $ US |
| 2010 | 45 144 500 000 $ US | 14 717 700 000 $ US |
| 2009 | 39 906 900 000 $ US | 13 935 200 000 $ US |
| 2008 | 49 607 900 000 $ US | 17 614 900 000 $ US |
| 2007 | 39 354 300 000 $ US | 14 342 400 000 $ US |
| 2006 | 28 983 500 000 $ US | 11 569 200 000 $ US |
| 2005 | 23 818 200 000 $ US | 10 508 100 000 $ US |
| 2004 | 18 895 275 000 $ US | 8 020 025 000 $ US |
| 2003 | 13 188 562 500 $ US | 6 473 837 500 $ US |
| 2002 | 12 879 425 000 $ US | 6 628 975 000 $ US |
| 2001 | 13 959 600 000 $ US | 7 036 500 000 $ US |
| 2000 | 15 382 000 000 $ US | 7 513 000 000 $ US |
| 1999 | 15 164 800 000 $ US | 6 451 500 000 $ US |
| 1998 | 14 617 000 000 $ US | 6 492 000 000 $ US |
| 1997 | 14 156 800 000 $ US | 6 769 800 000 $ US |
| 1996 | 13 169 000 000 $ US | 5 084 000 000 $ US |
| 1995 | 12 267 000 000 $ US | 4 873 000 000 $ US |
| 1994 | 9 997 000 000 $ US | 5 645 000 000 $ US |
| 1993 | 9 923 000 000 $ US | 5 367 000 000 $ US |
| 1992 | 8 901 000 000 $ US | 4 867 000 000 $ US |
| 1991 | 9 831 000 000 $ US | 3 364 000 000 $ US |
| 1990 | 10 302 500 000 $ US | 3 788 000 000 $ US |
| 1989 | 8 840 545 455 $ US | 3 283 000 000 $ US |
| 1988 | 9 377 857 143 $ US | 3 082 285 714 $ US |
| 1987 | 8 094 857 143 $ US | 2 741 857 143 $ US |
| 1986 | 7 170 000 000 $ US | 3 012 285 714 $ US |
| 1985 | 9 050 428 571 $ US | 3 190 000 000 $ US |
| 1984 | 10 080 428 577 $ US | 3 096 000 002 $ US |
| 1983 | 8 250 857 155 $ US | 2 767 428 575 $ US |
| 1982 | 7 732 714 297 $ US | 2 727 428 575 $ US |
| 1981 | 7 917 857 154 $ US | 2 487 285 718 $ US |
| 1980 | 6 813 857 153 $ US | 2 343 285 718 $ US |
| 1979 | 6 002 285 723 $ US | 1 772 714 288 $ US |
| 1978 | 4 742 592 108 $ US | 1 548 408 534 $ US |
| 1977 | 4 038 282 169 $ US | 1 447 975 368 $ US |
En 2025, les importations de biens de l'Égypte s'élevaient à 85,5 milliards de dollars et celles de services à 29,6 milliards de dollars ; les services représentaient 25,7 % du total, contre 26,4 % en 1977.
L'Égypte dans le classement mondial des importations, 2025
| Rang | Pays | Importations | Part mondiale | |
|---|---|---|---|---|
| 43 |
 Afrique du Sud |
126 Md $US | 0,37 % | |
| 44 |
 Iran |
125 Md $US | 0,37 % | vs Iran |
| 45 |
 Grèce |
123 Md $US | 0,37 % | |
| 46 |
 Égypte |
115 Md $US | 0,34 % | |
| 47 |
 Ukraine |
111 Md $US | 0,33 % | |
| 48 |
 Chili |
109 Md $US | 0,32 % | |
| 49 |
 Argentine |
101 Md $US | 0,3 % | vs Argentine |
Importations de biens et services de l'Égypte, % du PIB, 1960–2025
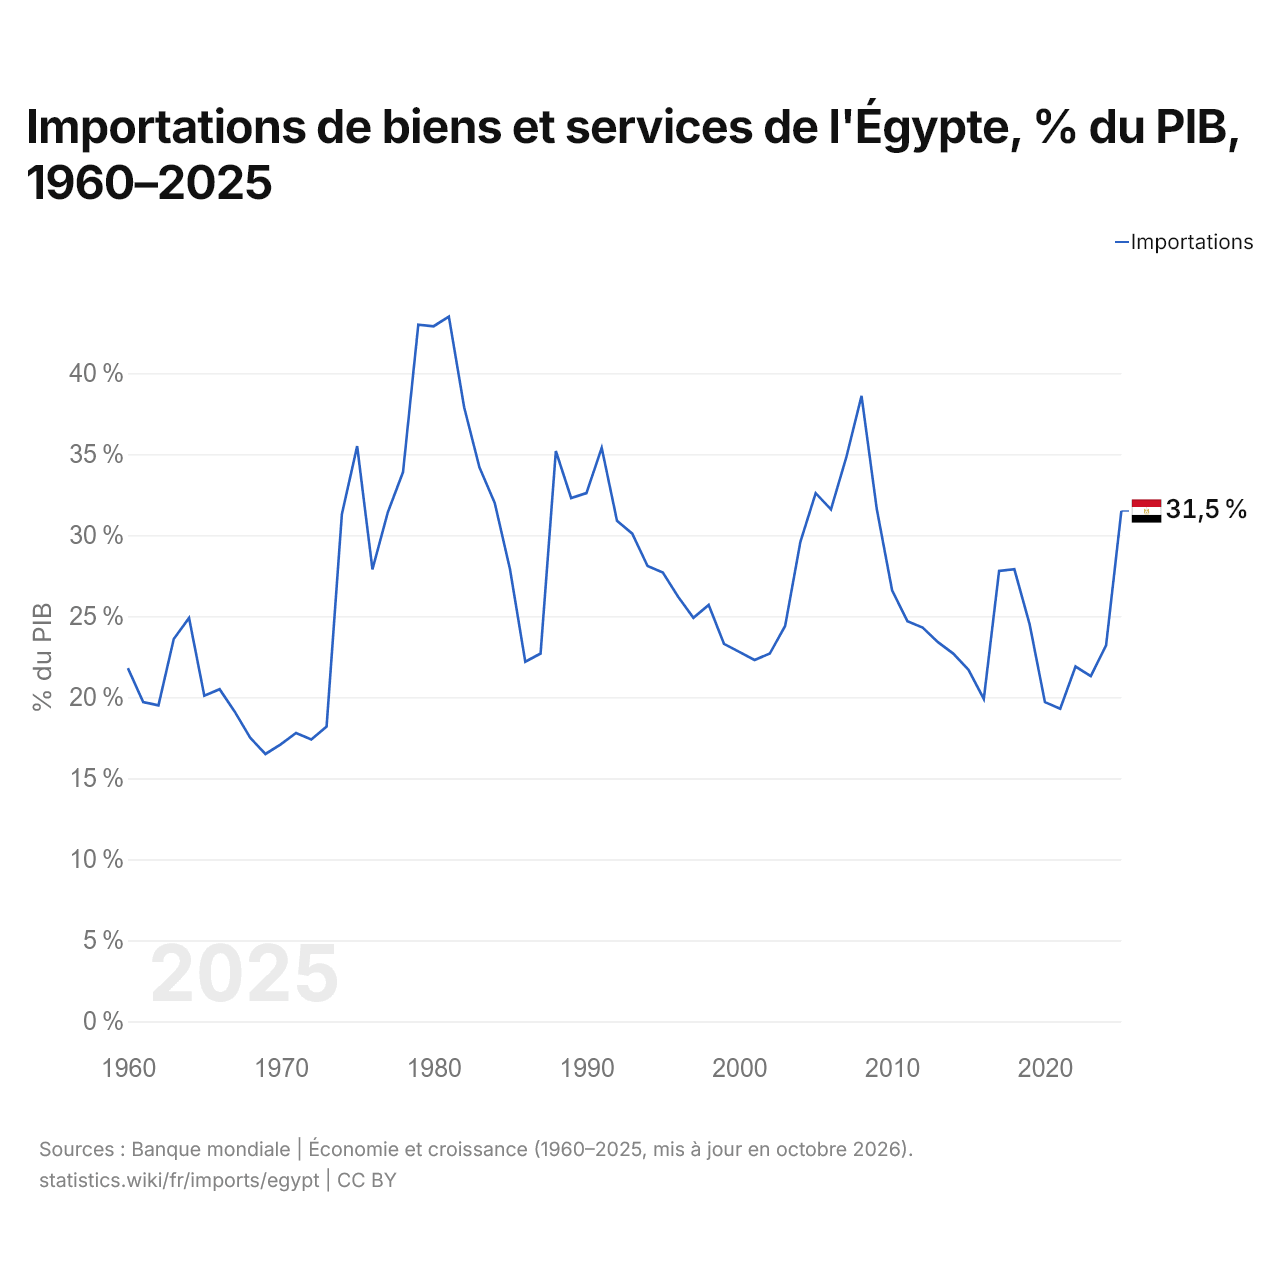
En 2025, les importations de biens et services de l'Égypte équivalaient à 31,5 % de son PIB, contre 21,8 % en 1960. La part la plus élevée a été de 43,5 %, en 1981.
Comparer les importations de l'Égypte avec celles d'autres pays
Sources :
- TradeMap (2001–2025, mis à jour en octobre 2026)
- Banque mondiale | Économie et croissance (1960–2025, mis à jour en octobre 2026)
Creative Commons Attribution (CC BY) : vous pouvez copier, partager, adapter et réutiliser ce contenu, y compris à des fins commerciales, à condition de citer statistics.wiki et d’indiquer les modifications apportées. Les sources citées ci-dessus peuvent avoir leurs propres conditions de licence.