
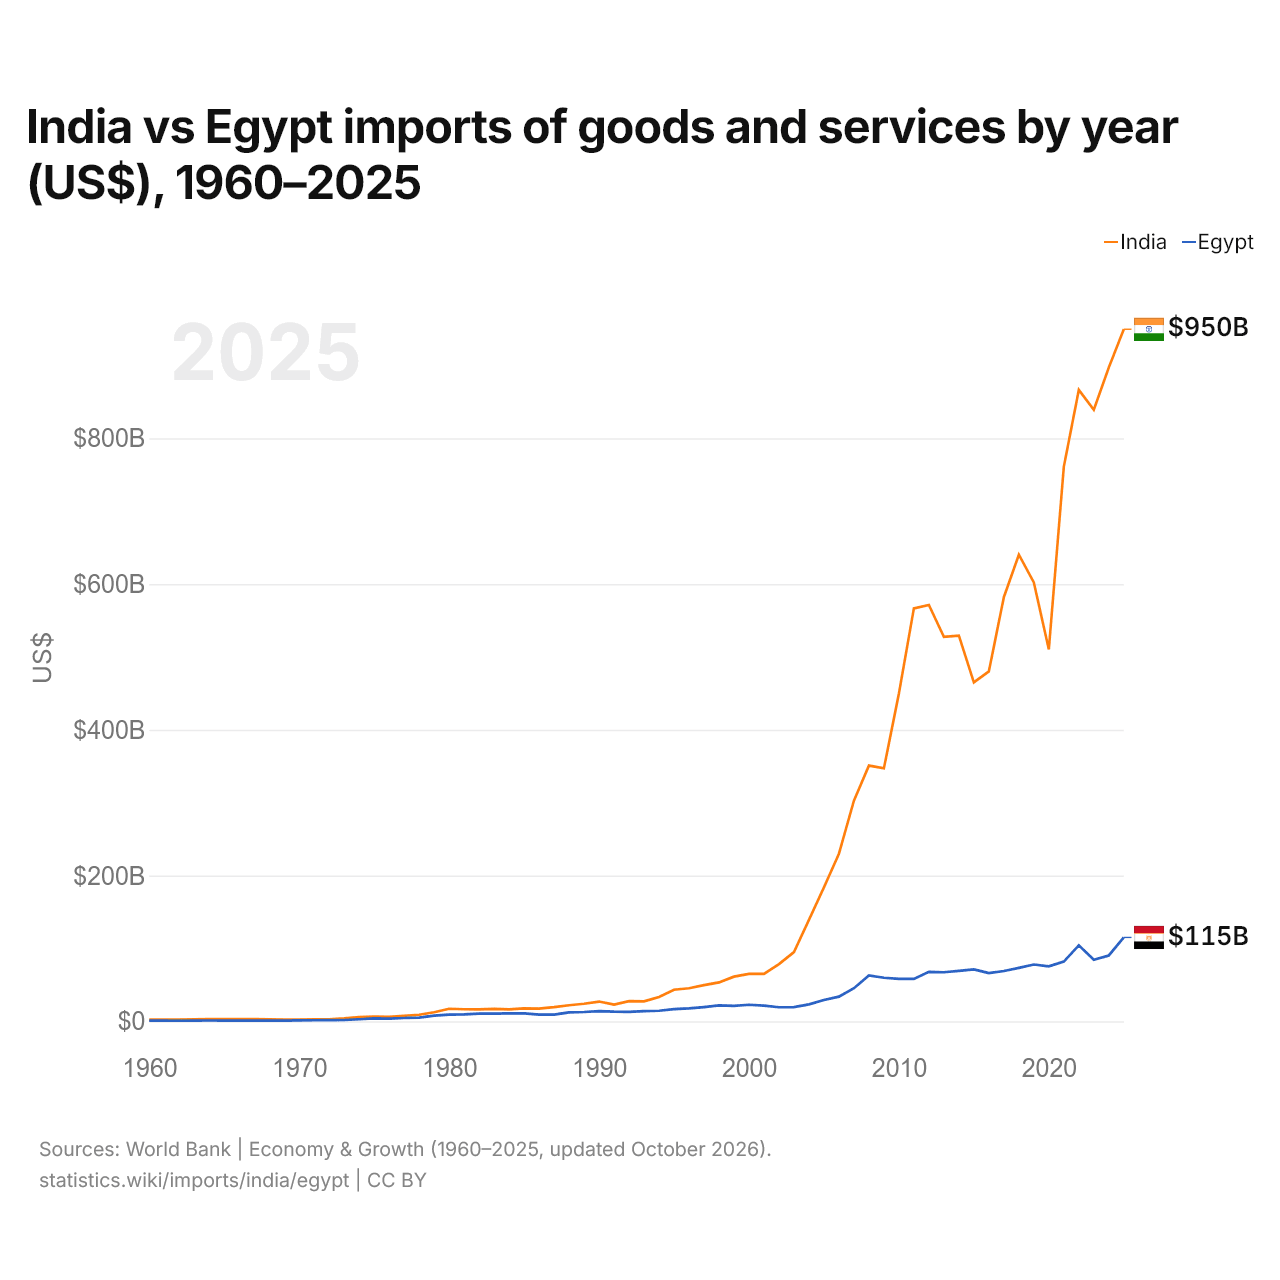
Inde vs Égypte : importations de biens et services par année ($ US), 1960–2025
| Année | $ US | |
|---|---|---|
 Inde |
 Égypte |
|
| 2025 | 949 660 225 776 $ US | 115 107 510 878 $ US |
| 2024 | 897 055 898 132 $ US | 90 357 257 364 $ US |
| 2023 | 839 102 411 987 $ US | 84 507 685 810 $ US |
| 2022 | 866 361 019 119 $ US | 104 389 057 751 $ US |
| 2021 | 760 902 891 806 $ US | 81 943 913 321 $ US |
| 2020 | 510 244 747 372 $ US | 75 433 562 071 $ US |
| 2019 | 602 315 056 053 $ US | 78 012 528 474 $ US |
| 2018 | 640 300 806 739 $ US | 73 331 457 513 $ US |
| 2017 | 582 018 012 522 $ US | 69 089 673 913 $ US |
| 2016 | 480 169 055 768 $ US | 66 159 509 202 $ US |
| 2015 | 465 097 595 426 $ US | 71 347 708 895 $ US |
| 2014 | 529 239 428 329 $ US | 69 296 987 088 $ US |
| 2013 | 527 555 307 106 $ US | 67 364 341 085 $ US |
| 2012 | 571 306 554 042 $ US | 67 866 666 667 $ US |
| 2011 | 566 667 744 820 $ US | 58 261 617 900 $ US |
| 2010 | 449 974 370 199 $ US | 58 221 415 608 $ US |
| 2009 | 347 177 967 968 $ US | 59 764 065 336 $ US |
| 2008 | 350 926 955 799 $ US | 62 909 090 909 $ US |
| 2007 | 302 803 952 553 $ US | 45 429 071 804 $ US |
| 2006 | 229 955 027 127 $ US | 33 913 043 478 $ US |
| 2005 | 183 736 617 243 $ US | 29 237 429 237 $ US |
| 2004 | 139 310 848 797 $ US | 23 311 688 312 $ US |
| 2003 | 95 071 869 379 $ US | 19 576 923 077 $ US |
| 2002 | 78 498 759 286 $ US | 19 303 370 787 $ US |
| 2001 | 65 218 276 482 $ US | 21 590 296 496 $ US |
| 2000 | 65 124 245 375 $ US | 22 779 979 451 $ US |
| 1999 | 61 314 704 757 $ US | 21 144 205 249 $ US |
| 1998 | 53 431 564 328 $ US | 21 812 278 630 $ US |
| 1997 | 49 607 467 421 $ US | 19 528 023 599 $ US |
| 1996 | 45 357 266 003 $ US | 17 718 160 377 $ US |
| 1995 | 43 318 425 768 $ US | 16 661 751 696 $ US |
| 1994 | 33 349 501 148 $ US | 14 561 091 340 $ US |
| 1993 | 27 419 354 119 $ US | 14 015 606 242 $ US |
| 1992 | 27 639 649 994 $ US | 12 938 946 228 $ US |
| 1991 | 22 941 358 805 $ US | 13 226 985 710 $ US |
| 1990 | 27 132 072 318 $ US | 13 997 308 210 $ US |
| 1989 | 24 133 353 522 $ US | 12 856 257 745 $ US |
| 1988 | 22 111 443 193 $ US | 12 322 544 009 $ US |
| 1987 | 19 477 194 741 $ US | 9 190 887 667 $ US |
| 1986 | 17 486 411 450 $ US | 9 167 446 211 $ US |
| 1985 | 17 776 627 208 $ US | 10 888 912 156 $ US |
| 1984 | 16 391 245 675 $ US | 10 857 880 026 $ US |
| 1983 | 17 140 048 793 $ US | 10 593 713 620 $ US |
| 1982 | 16 343 526 469 $ US | 10 472 660 099 $ US |
| 1981 | 16 584 605 960 $ US | 9 628 783 784 $ US |
| 1980 | 17 226 125 073 $ US | 9 289 542 760 $ US |
| 1979 | 12 498 452 242 $ US | 7 743 714 286 $ US |
| 1978 | 9 045 733 047 $ US | 5 026 531 231 $ US |
| 1977 | 7 611 052 224 $ US | 4 516 926 855 $ US |
| 1976 | 6 280 792 834 $ US | 3 717 576 961 $ US |
| 1975 | 6 545 472 951 $ US | 4 134 809 294 $ US |
| 1974 | 5 992 067 751 $ US | 2 888 427 176 $ US |
| 1973 | 4 039 284 329 $ US | 1 834 007 074 $ US |
| 1972 | 2 650 561 669 $ US | 1 615 822 130 $ US |
| 1971 | 2 695 673 511 $ US | 1 530 986 993 $ US |
| 1970 | 2 421 333 333 $ US | 1 374 780 206 $ US |
| 1969 | 2 356 000 000 $ US | 1 078 692 494 $ US |
| 1968 | 2 624 000 000 $ US | 1 035 981 308 $ US |
| 1967 | 2 981 333 333 $ US | 1 071 428 571 $ US |
| 1966 | 3 041 036 962 $ US | 1 081 156 918 $ US |
| 1965 | 3 103 803 104 $ US | 996 286 588 $ US |
| 1964 | 3 210 903 211 $ US | 1 171 388 946 $ US |
| 1963 | 2 860 202 860 $ US | 987 619 111 $ US |
| 1962 | 2 543 102 543 $ US | 787 660 480 $ US |
| 1961 | 2 337 302 337 $ US | 887 313 994 $ US |
| 1960 | 2 530 502 531 $ US | 918 039 754 $ US |
En 2025, les importations de biens et services de l'Inde s'élevaient à 950 milliards de dollars et celles de l'Égypte à 115 milliards de dollars : celles de l'Inde étaient 8,3 fois plus élevées. En 1960, les importations de l'Inde étaient 2,8 fois plus élevées : 2,53 milliards de dollars pour l'Inde et 918 millions de dollars pour l'Égypte.
Les importations de biens et services de l'Inde sont supérieures à celles de l'Égypte chaque année depuis 1960.
Inde vs Égypte : chiffres des importations
|
Inde
|
Égypte
|
|
|---|---|---|
| Importations | 950 Md $US (2025) | 115 Md $US (2025) |
| Rang mondial | 7/174 | 46/174 |
| Part mondiale | 2,82 % | 0,34 % |
| % du PIB | 24,0 % | 31,5 % |
| Première catégorie de biens | Pétrole, gaz, minerais et autres matières premières (34,4 %, 2025) | Pétrole, gaz, minerais et autres matières premières (25,2 %, 2025) |
| Première origine des biens | Chine (16,6 %, 2025) | Chine (18,6 %, 2025) |
Comparer les importations de 2 pays au choix
Sources :
- Banque mondiale | Économie et croissance (1960–2025, mis à jour en octobre 2026)
- TradeMap (2001–2025, mis à jour en octobre 2026)
Creative Commons Attribution (CC BY) : vous pouvez copier, partager, adapter et réutiliser ce contenu, y compris à des fins commerciales, à condition de citer statistics.wiki et d’indiquer les modifications apportées. Les sources citées ci-dessus peuvent avoir leurs propres conditions de licence.