
Importations de biens et services de l'Argentine par année ($ US), 1960–2025
| Année | $ US | Rang mondial |
|---|---|---|
| Importations | Rang mondial | |
| 2025 | 101 159 779 351 $ US | #49 |
| 2024 | 80 944 817 978 $ US | #51 |
| 2023 | 89 980 573 298 $ US | #47 |
| 2022 | 96 991 607 941 $ US | #48 |
| 2021 | 73 042 905 138 $ US | #50 |
| 2020 | 52 454 091 268 $ US | #53 |
| 2019 | 65 845 624 691 $ US | #52 |
| 2018 | 85 681 309 473 $ US | #47 |
| 2017 | 89 910 495 567 $ US | #44 |
| 2016 | 75 639 254 068 $ US | #45 |
| 2015 | 70 064 879 912 $ US | #47 |
| 2014 | 73 691 675 720 $ US | #48 |
| 2013 | 81 240 190 817 $ US | #47 |
| 2012 | 78 013 690 407 $ US | #48 |
| 2011 | 88 838 309 449 $ US | #42 |
| 2010 | 67 937 933 972 $ US | #47 |
| 2009 | 48 268 743 530 $ US | #49 |
| 2008 | 66 316 154 417 $ US | #47 |
| 2007 | 52 567 536 062 $ US | #48 |
| 2006 | 40 480 743 016 $ US | #48 |
| 2005 | 34 392 237 787 $ US | #47 |
| 2004 | 27 736 672 324 $ US | #48 |
| 2003 | 18 772 898 619 $ US | #50 |
| 2002 | 13 065 823 829 $ US | #55 |
| 2001 | 27 603 881 800 $ US | #41 |
| 2000 | 33 070 146 000 $ US | #39 |
| 1999 | 32 762 700 000 $ US | #37 |
| 1998 | 38 667 300 000 $ US | #34 |
| 1997 | 37 413 700 000 $ US | #35 |
| 1996 | 30 148 400 000 $ US | #38 |
| 1995 | 26 038 017 000 $ US | #38 |
| 1994 | 27 299 960 000 $ US | #33 |
| 1993 | 22 049 649 650 $ US | #36 |
| 1992 | 18 606 116 034 $ US | #38 |
| 1991 | 11 531 201 154 $ US | #42 |
| 1990 | 6 546 497 152 $ US | #57 |
| 1989 | 5 041 767 786 $ US | #52 |
| 1988 | 7 882 225 528 $ US | #46 |
| 1987 | 8 243 255 952 $ US | #44 |
| 1986 | 6 695 427 336 $ US | #44 |
| 1985 | 5 529 993 736 $ US | #46 |
| 1984 | 5 561 048 223 $ US | #46 |
| 1983 | 6 068 376 037 $ US | #46 |
| 1982 | 5 497 685 333 $ US | #48 |
| 1981 | 5 800 000 171 $ US | #48 |
| 1980 | 4 989 980 080 $ US | #49 |
| 1979 | 4 383 512 571 $ US | #46 |
| 1978 | 5 089 538 172 $ US | #40 |
| 1977 | 4 159 999 873 $ US | #43 |
| 1976 | 3 030 000 057 $ US | #45 |
| 1975 | 3 135 135 021 $ US | #43 |
| 1974 | 4 555 555 490 $ US | #37 |
| 1973 | 3 000 000 102 $ US | #36 |
| 1972 | 2 374 999 979 $ US | #31 |
| 1971 | 2 199 999 959 $ US | #30 |
| 1970 | 1 495 789 482 $ US | #35 |
| 1969 | 2 000 000 041 $ US | - |
| 1968 | 1 428 571 475 $ US | - |
| 1967 | 1 212 121 237 $ US | - |
| 1966 | 1 428 571 371 $ US | - |
| 1965 | 1 176 470 539 $ US | - |
| 1964 | 1 424 602 864 $ US | - |
| 1963 | 1 441 753 153 $ US | - |
| 1962 | 1 720 750 787 $ US | - |
| 1961 | 1 206 915 602 $ US | - |
| 1960 | 1 206 418 120 $ US | - |
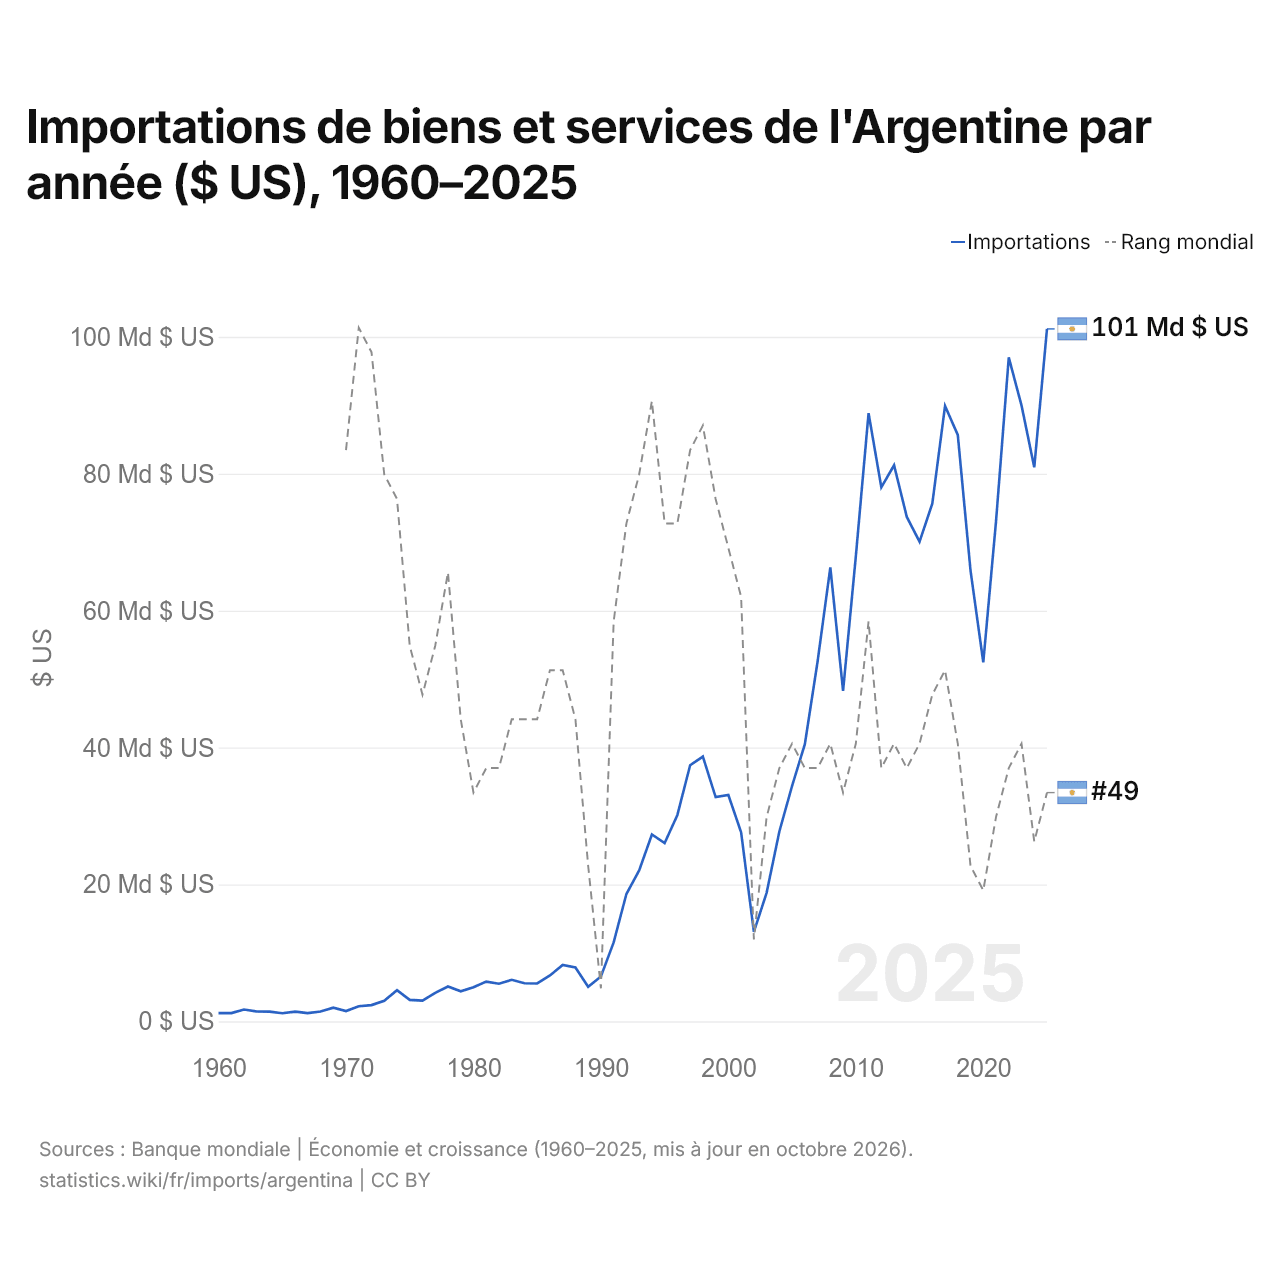
En 2025, les importations de biens et services de l'Argentine s'élevaient à 101 milliards de dollars, contre 1,21 milliard de dollars en 1960. Le minimum a été de 1,18 milliard de dollars, en 1965. Elles se classaient au 49e rang mondial, en hausse par rapport au 51e rang en 2024. Leur meilleur rang a été le 30e, occupé pour la dernière fois en 1971.
En 2025, les importations de biens et services de l'Argentine étaient les 4es plus élevées de 26 pays situés en Amérique latine. En 2025, les exportations de l'Argentine dépassaient ses importations de 5,1 milliards de dollars, soit un excédent commercial. Le commerce de l'Argentine, exportations et importations réunies, équivalait à 30,4 % de son PIB en 2025, au 166e rang mondial.
Importations de biens de l'Argentine par catégorie, 2025
Importations de biens, 2025: 71,8 Md $US
En 2025, la première catégorie des importations de biens de l'Argentine était « machines, électronique et véhicules », avec 49,9 %, suivie de « produits chimiques, pharmaceutiques et plastiques », avec 15,9 %.
Origines des importations de biens de l'Argentine : les 10 premières, 2025
| Rang | Pays | Importations de biens | Part | |
|---|---|---|---|---|
| 1 |
 Brésil |
17,6 Md $US | 24,5 % | vs Brésil |
| 2 |
 Chine |
16,6 Md $US | 23,1 % | vs Chine |
| 3 |
 États-Unis |
6,35 Md $US | 8,84 % | vs USA |
| 4 |
 Allemagne |
3,04 Md $US | 4,24 % | vs Allemagne |
| 5 |
 Paraguay |
2,78 Md $US | 3,87 % | |
| 6 |
 Thaïlande |
2,01 Md $US | 2,8 % | |
| 7 |
 Mexique |
1,67 Md $US | 2,33 % | vs Mexique |
| 8 |
 Italie |
1,52 Md $US | 2,11 % | |
| 9 |
 Japon |
1,38 Md $US | 1,92 % | |
| 10 |
 Inde |
1,36 Md $US | 1,9 % | vs Inde |
| Autres partenaires et non précisés | 17,5 Md $US | 24,4 % |
Importations de biens de l'Argentine depuis ses 5 principales origines ($ US), 2001–2025
| Année | $ US | ||||
|---|---|---|---|---|---|
| Brésil | Chine | États-Unis | Allemagne | Paraguay | |
| 2025 | 17 611 806 000 $ US | 16 582 258 000 $ US | 6 345 712 000 $ US | 3 044 675 000 $ US | 2 778 917 000 $ US |
| 2024 | 14 349 279 000 $ US | 11 658 764 000 $ US | 6 225 532 000 $ US | 2 655 723 000 $ US | 3 314 110 000 $ US |
| 2023 | 17 348 516 000 $ US | 14 477 566 000 $ US | 8 629 761 000 $ US | 2 783 720 000 $ US | 3 911 732 000 $ US |
| 2022 | 15 190 063 000 $ US | 15 855 696 000 $ US | 9 651 640 000 $ US | 2 587 180 000 $ US | 1 895 972 000 $ US |
| 2021 | 12 442 342 000 $ US | 13 525 039 000 $ US | 5 922 119 000 $ US | 2 527 152 000 $ US | 2 914 633 000 $ US |
| 2020 | 8 685 285 000 $ US | 8 656 340 000 $ US | 4 414 057 000 $ US | 1 987 983 000 $ US | 2 217 872 000 $ US |
| 2019 | 10 159 331 000 $ US | 9 258 744 000 $ US | 6 273 636 000 $ US | 2 765 873 000 $ US | 1 646 757 000 $ US |
| 2018 | 15 697 797 000 $ US | 12 078 804 000 $ US | 7 716 402 000 $ US | 3 351 365 000 $ US | 2 176 720 000 $ US |
| 2017 | 17 990 350 000 $ US | 12 316 140 000 $ US | 7 635 572 000 $ US | 3 229 108 000 $ US | 1 105 088 000 $ US |
| 2016 | 13 597 452 000 $ US | 10 467 476 000 $ US | 6 984 637 000 $ US | 3 053 219 000 $ US | 711 340 000 $ US |
| 2015 | 13 005 591 000 $ US | 11 749 039 000 $ US | 7 705 939 000 $ US | 3 127 228 000 $ US | 409 413 000 $ US |
| 2014 | 14 340 808 000 $ US | 10 776 371 000 $ US | 9 107 001 000 $ US | 3 532 730 000 $ US | 498 619 000 $ US |
| 2013 | 19 161 458 000 $ US | 11 312 451 000 $ US | 8 069 314 000 $ US | 3 892 128 000 $ US | 530 822 000 $ US |
| 2012 | 17 676 647 000 $ US | 9 900 612 000 $ US | 8 476 098 000 $ US | 3 698 229 000 $ US | 450 632 000 $ US |
| 2011 | 22 181 035 000 $ US | 10 572 982 000 $ US | 7 810 169 000 $ US | 3 645 600 000 $ US | 515 026 000 $ US |
| 2010 | 17 948 822 000 $ US | 7 649 019 000 $ US | 6 125 400 000 $ US | 3 215 186 000 $ US | 436 801 000 $ US |
| 2009 | 11 819 237 000 $ US | 4 822 599 000 $ US | 5 169 636 000 $ US | 1 993 913 000 $ US | 698 956 000 $ US |
| 2008 | 17 976 761 000 $ US | 7 103 891 000 $ US | 6 979 889 000 $ US | 2 533 587 000 $ US | 1 782 956 000 $ US |
| 2007 | 14 660 266 000 $ US | 5 092 954 000 $ US | 5 342 304 000 $ US | 2 131 321 000 $ US | 1 056 420 000 $ US |
| 2006 | 11 871 444 000 $ US | 3 121 708 000 $ US | 4 292 133 000 $ US | 1 544 876 000 $ US | 505 183 000 $ US |
| 2005 | 10 625 328 000 $ US | 1 528 620 000 $ US | 4 532 216 000 $ US | 1 335 333 000 $ US | 455 387 000 $ US |
| 2004 | 7 562 429 000 $ US | 1 400 969 000 $ US | 3 429 868 000 $ US | 1 092 735 000 $ US | 380 497 000 $ US |
| 2003 | 4 699 633 000 $ US | 720 755 000 $ US | 2 264 013 000 $ US | 768 794 000 $ US | 294 712 000 $ US |
| 2002 | 2 518 267 000 $ US | 330 240 000 $ US | 1 804 349 000 $ US | 553 553 000 $ US | 255 397 000 $ US |
| 2001 | 5 277 761 000 $ US | 1 066 327 000 $ US | 3 781 206 000 $ US | 1 051 947 000 $ US | 302 804 000 $ US |
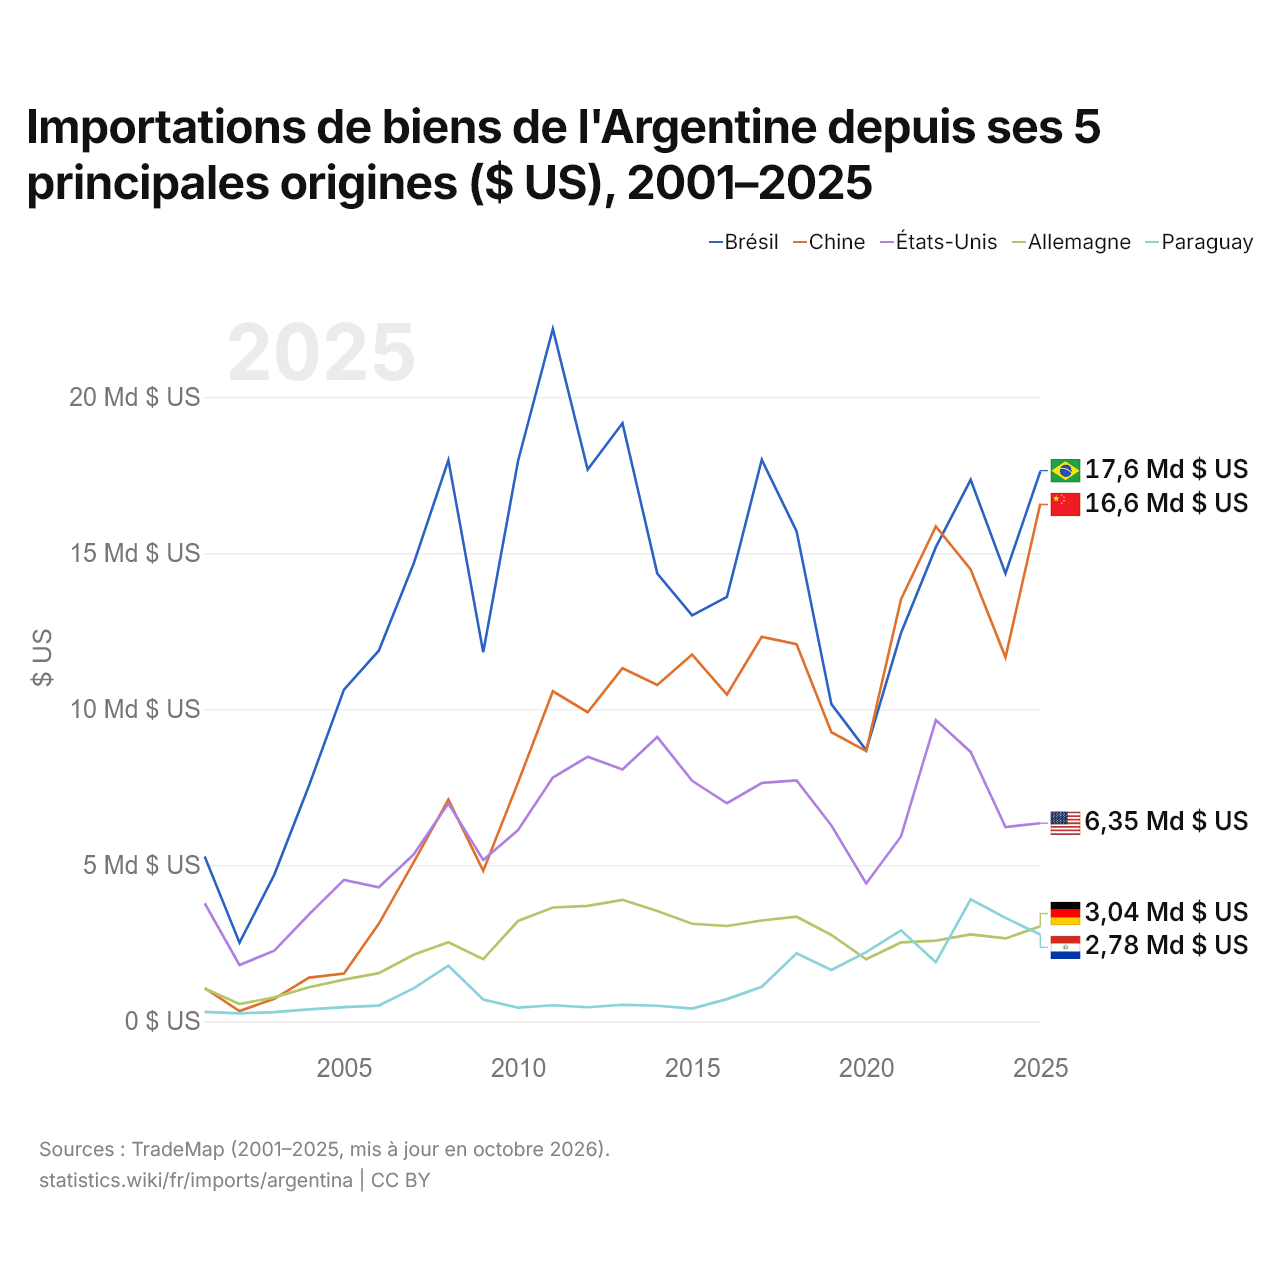
En 2025, les importations de biens s'élevaient à 17,6 milliards de dollars en provenance du Brésil, 16,6 milliards de dollars en provenance de la Chine, 6,35 milliards de dollars en provenance des États-Unis, 3,04 milliards de dollars en provenance de l'Allemagne et 2,78 milliards de dollars en provenance du Paraguay. Le premier rang des cinq fournisseurs de l'Argentine est occupé par le Brésil depuis 2023. Le changement le plus récent dans leur ordre remonte à 2025, quand les importations de l'Argentine en provenance de l'Allemagne ont dépassé celles en provenance du Paraguay.
Importations de biens et de services de l'Argentine ($ US), 1976–2025
| Année | $ US | |
|---|---|---|
| Biens | Services | |
| 2025 | 71 792 647 801 $ US | 29 941 795 284 $ US |
| 2024 | 57 355 705 333 $ US | 22 053 754 970 $ US |
| 2023 | 69 849 121 546 $ US | 22 696 657 400 $ US |
| 2022 | 76 354 624 126 $ US | 21 190 721 717 $ US |
| 2021 | 59 291 110 550 $ US | 13 288 827 176 $ US |
| 2020 | 40 314 811 522 $ US | 12 028 020 373 $ US |
| 2019 | 46 928 338 267 $ US | 19 645 594 222 $ US |
| 2018 | 62 544 230 316 $ US | 24 277 430 964 $ US |
| 2017 | 64 108 936 659 $ US | 25 201 640 554 $ US |
| 2016 | 53 543 776 749 $ US | 21 876 362 070 $ US |
| 2015 | 57 594 229 886 $ US | 19 028 557 043 $ US |
| 2014 | 62 898 966 094 $ US | 18 037 663 981 $ US |
| 2013 | 71 292 993 120 $ US | 19 008 807 884 $ US |
| 2012 | 65 042 742 213 $ US | 18 344 325 454 $ US |
| 2011 | 70 768 777 913 $ US | 17 649 469 312 $ US |
| 2010 | 54 158 763 702 $ US | 14 620 732 011 $ US |
| 2009 | 37 146 134 000 $ US | 12 536 652 813 $ US |
| 2008 | 54 596 200 000 $ US | 13 646 484 098 $ US |
| 2007 | 42 524 500 000 $ US | 11 027 218 520 $ US |
| 2006 | 32 587 900 000 $ US | 8 673 972 520 $ US |
| 2005 | 27 300 100 000 $ US | 7 496 890 000 $ US |
| 2004 | 21 311 100 000 $ US | 6 512 540 000 $ US |
| 2003 | 13 134 200 000 $ US | 5 590 310 000 $ US |
| 2002 | 8 473 100 000 $ US | 4 864 120 000 $ US |
| 2001 | 19 157 800 000 $ US | 8 437 142 433 $ US |
| 2000 | 23 889 100 000 $ US | 9 179 703 787 $ US |
| 1999 | 24 103 200 000 $ US | 8 799 876 781 $ US |
| 1998 | 29 530 900 000 $ US | 9 266 617 537 $ US |
| 1997 | 28 553 500 000 $ US | 8 958 086 709 $ US |
| 1996 | 22 283 200 000 $ US | 7 929 004 066 $ US |
| 1995 | 18 804 317 000 $ US | 7 230 800 000 $ US |
| 1994 | 20 162 200 000 $ US | 7 111 400 000 $ US |
| 1993 | 15 632 500 000 $ US | 6 342 900 000 $ US |
| 1992 | 13 794 800 000 $ US | 5 524 700 000 $ US |
| 1991 | 7 559 000 000 $ US | 4 007 000 000 $ US |
| 1990 | 3 726 000 000 $ US | 3 120 000 000 $ US |
| 1989 | 3 864 000 000 $ US | 2 793 000 000 $ US |
| 1988 | 4 892 000 000 $ US | 2 702 000 000 $ US |
| 1987 | 5 343 000 000 $ US | 2 566 000 000 $ US |
| 1986 | 4 406 000 000 $ US | 2 500 000 000 $ US |
| 1985 | 3 518 000 000 $ US | 2 187 000 000 $ US |
| 1984 | 4 118 000 000 $ US | 2 289 000 000 $ US |
| 1983 | 4 119 000 000 $ US | 2 224 000 000 $ US |
| 1982 | 4 859 000 000 $ US | 2 018 000 000 $ US |
| 1981 | 8 431 000 000 $ US | 3 434 000 000 $ US |
| 1980 | 9 394 000 000 $ US | 3 788 000 000 $ US |
| 1979 | 6 028 000 000 $ US | 2 814 000 000 $ US |
| 1978 | 3 488 000 000 $ US | 1 544 000 000 $ US |
| 1977 | 3 799 000 000 $ US | 967 000 000 $ US |
| 1976 | 2 765 000 000 $ US | 742 000 000 $ US |
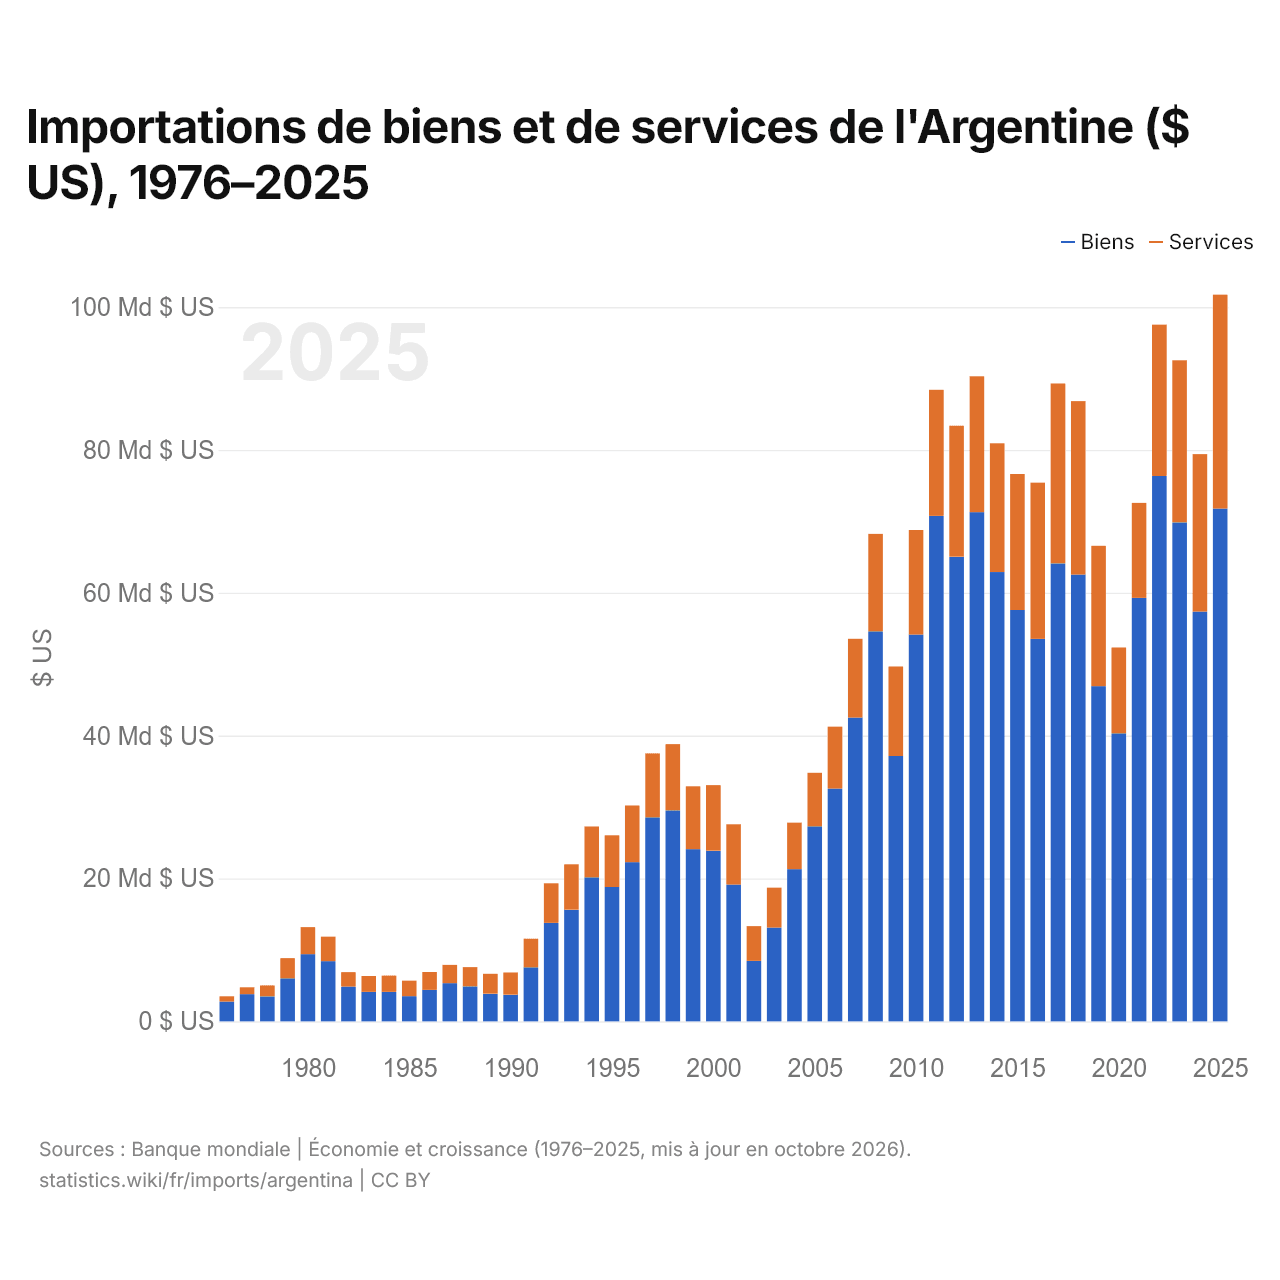
En 2025, les importations de biens de l'Argentine s'élevaient à 71,8 milliards de dollars et celles de services à 29,9 milliards de dollars ; les services représentaient 29,4 % du total, contre 21,2 % en 1976.
L'Argentine dans le classement mondial des importations, 2025







Importations de biens et services de l'Argentine, % du PIB, 1960–2025
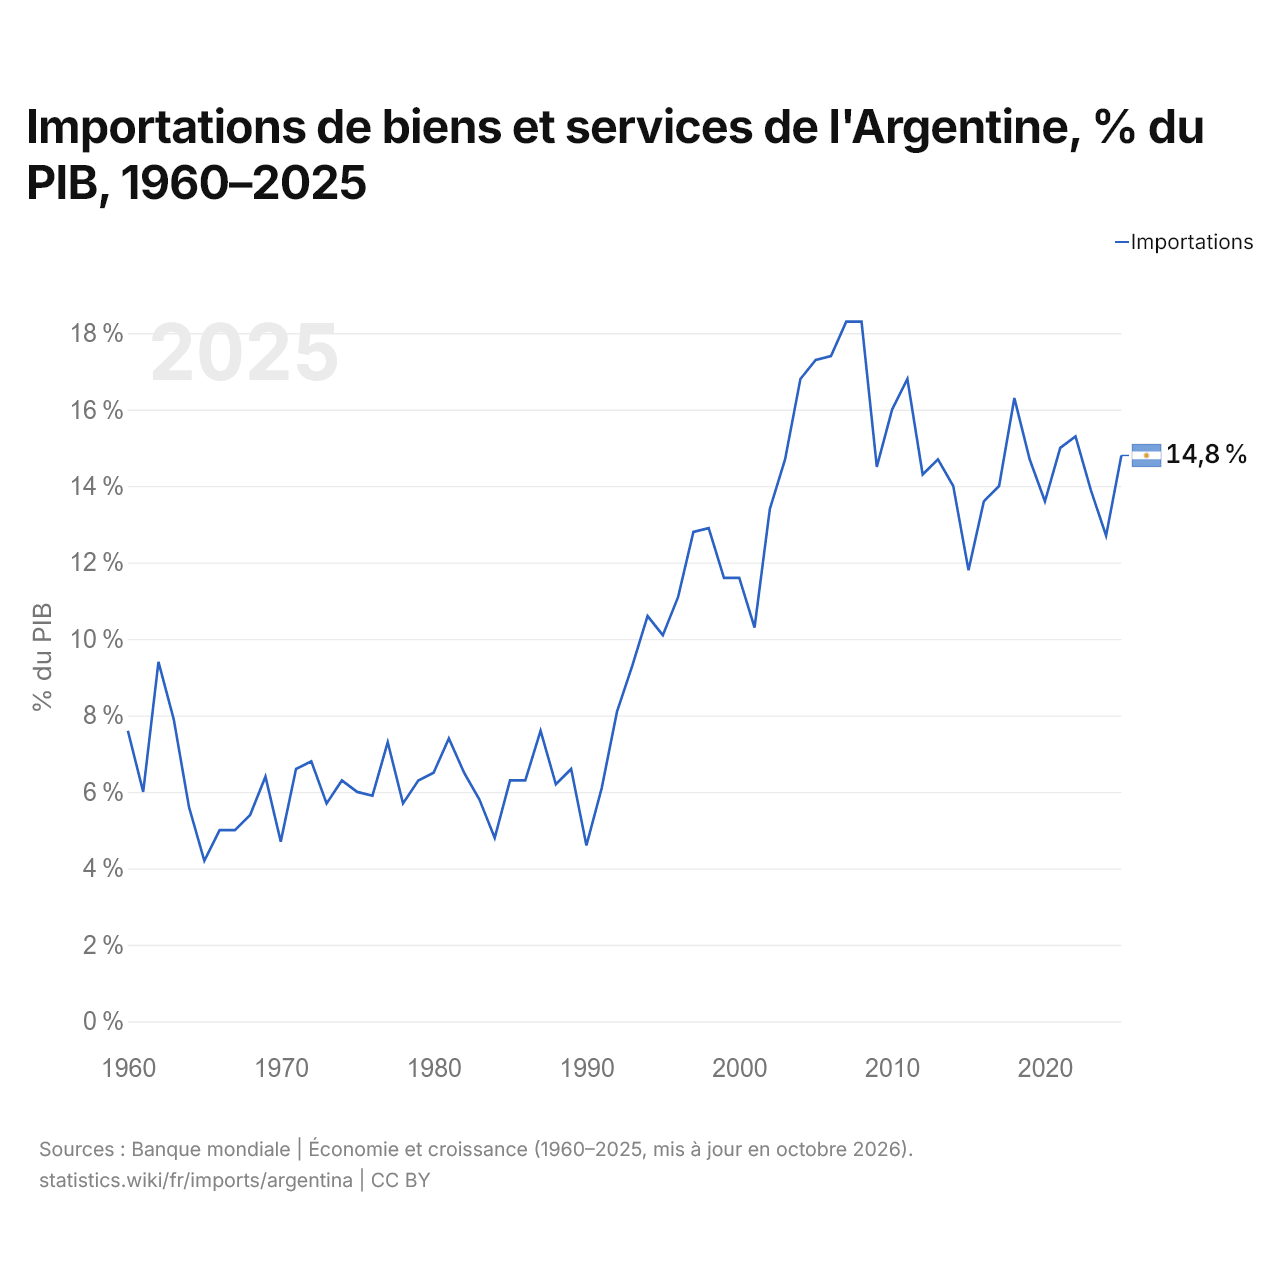
En 2025, les importations de biens et services de l'Argentine équivalaient à 14,8 % de son PIB, contre 7,6 % en 1960. La part la plus élevée a été de 18,3 %, en 2008.
Comparer les importations de l'Argentine avec celles d'autres pays
Sources :
- Banque mondiale | Économie et croissance (1960–2025, mis à jour en octobre 2026)
- TradeMap (2001–2025, mis à jour en octobre 2026)
Creative Commons Attribution (CC BY) : vous pouvez copier, partager, adapter et réutiliser ce contenu, y compris à des fins commerciales, à condition de citer statistics.wiki et d’indiquer les modifications apportées. Les sources citées ci-dessus peuvent avoir leurs propres conditions de licence.