
Haïti vs Argentine : importations de biens et services par année ($ US), 1960–2025
| Année | $ US | |
|---|---|---|
 Haïti |
 Argentine |
|
| 2025 | 4 595 232 441 $ US | 101 159 779 351 $ US |
| 2024 | 3 993 530 417 $ US | 80 944 817 978 $ US |
| 2023 | 4 315 356 249 $ US | 89 980 573 298 $ US |
| 2022 | 5 201 283 685 $ US | 96 991 607 941 $ US |
| 2021 | 6 031 369 600 $ US | 73 042 905 138 $ US |
| 2020 | 4 318 064 226 $ US | 52 454 091 268 $ US |
| 2019 | 5 107 129 495 $ US | 65 845 624 691 $ US |
| 2018 | 5 635 999 404 $ US | 85 681 309 473 $ US |
| 2017 | 4 689 668 692 $ US | 89 910 495 567 $ US |
| 2016 | 4 193 901 268 $ US | 75 639 254 068 $ US |
| 2015 | 4 481 319 816 $ US | 70 064 879 912 $ US |
| 2014 | 4 752 590 723 $ US | 73 691 675 720 $ US |
| 2013 | 4 443 359 383 $ US | 81 240 190 817 $ US |
| 2012 | 4 195 362 731 $ US | 78 013 690 407 $ US |
| 2011 | 4 433 440 000 $ US | 88 838 309 449 $ US |
| 2010 | 4 287 288 127 $ US | 67 937 933 972 $ US |
| 2009 | 2 804 199 819 $ US | 48 268 743 530 $ US |
| 2008 | 2 853 795 883 $ US | 66 316 154 417 $ US |
| 2007 | 2 384 574 759 $ US | 52 567 536 062 $ US |
| 2006 | 2 141 589 441 $ US | 40 480 743 016 $ US |
| 2005 | 1 852 992 471 $ US | 34 392 237 787 $ US |
| 2004 | 1 546 552 275 $ US | 27 736 672 324 $ US |
| 2003 | 1 416 336 753 $ US | 18 772 898 619 $ US |
| 2002 | 1 157 716 251 $ US | 13 065 823 829 $ US |
| 2001 | 1 300 849 983 $ US | 27 603 881 800 $ US |
| 2000 | 1 348 782 314 $ US | 33 070 146 000 $ US |
| 1999 | 1 233 630 317 $ US | 32 762 700 000 $ US |
| 1998 | 991 314 911 $ US | 38 667 300 000 $ US |
| 1997 | 882 868 457 $ US | 37 413 700 000 $ US |
| 1996 | 840 148 987 $ US | 30 148 400 000 $ US |
| 1995 | 807 821 955 $ US | 26 038 017 000 $ US |
| 1994 | 535 669 462 $ US | 27 299 960 000 $ US |
| 1993 | 711 988 087 $ US | 22 049 649 650 $ US |
| 1992 | 563 519 020 $ US | 18 606 116 034 $ US |
| 1991 | 1 024 563 585 $ US | 11 531 201 154 $ US |
| 1990 | 1 068 364 600 $ US | 6 546 497 152 $ US |
| 1989 | 753 772 600 $ US | 5 041 767 786 $ US |
| 1988 | 848 904 800 $ US | 7 882 225 528 $ US |
| 1987 | - | 8 243 255 952 $ US |
| 1986 | - | 6 695 427 336 $ US |
| 1985 | - | 5 529 993 736 $ US |
| 1984 | - | 5 561 048 223 $ US |
| 1983 | - | 6 068 376 037 $ US |
| 1982 | - | 5 497 685 333 $ US |
| 1981 | - | 5 800 000 171 $ US |
| 1980 | - | 4 989 980 080 $ US |
| 1979 | - | 4 383 512 571 $ US |
| 1978 | - | 5 089 538 172 $ US |
| 1977 | - | 4 159 999 873 $ US |
| 1976 | - | 3 030 000 057 $ US |
| 1975 | - | 3 135 135 021 $ US |
| 1974 | - | 4 555 555 490 $ US |
| 1973 | - | 3 000 000 102 $ US |
| 1972 | - | 2 374 999 979 $ US |
| 1971 | - | 2 199 999 959 $ US |
| 1970 | - | 1 495 789 482 $ US |
| 1969 | - | 2 000 000 041 $ US |
| 1968 | - | 1 428 571 475 $ US |
| 1967 | - | 1 212 121 237 $ US |
| 1966 | - | 1 428 571 371 $ US |
| 1965 | - | 1 176 470 539 $ US |
| 1964 | - | 1 424 602 864 $ US |
| 1963 | - | 1 441 753 153 $ US |
| 1962 | - | 1 720 750 787 $ US |
| 1961 | - | 1 206 915 602 $ US |
| 1960 | - | 1 206 418 120 $ US |
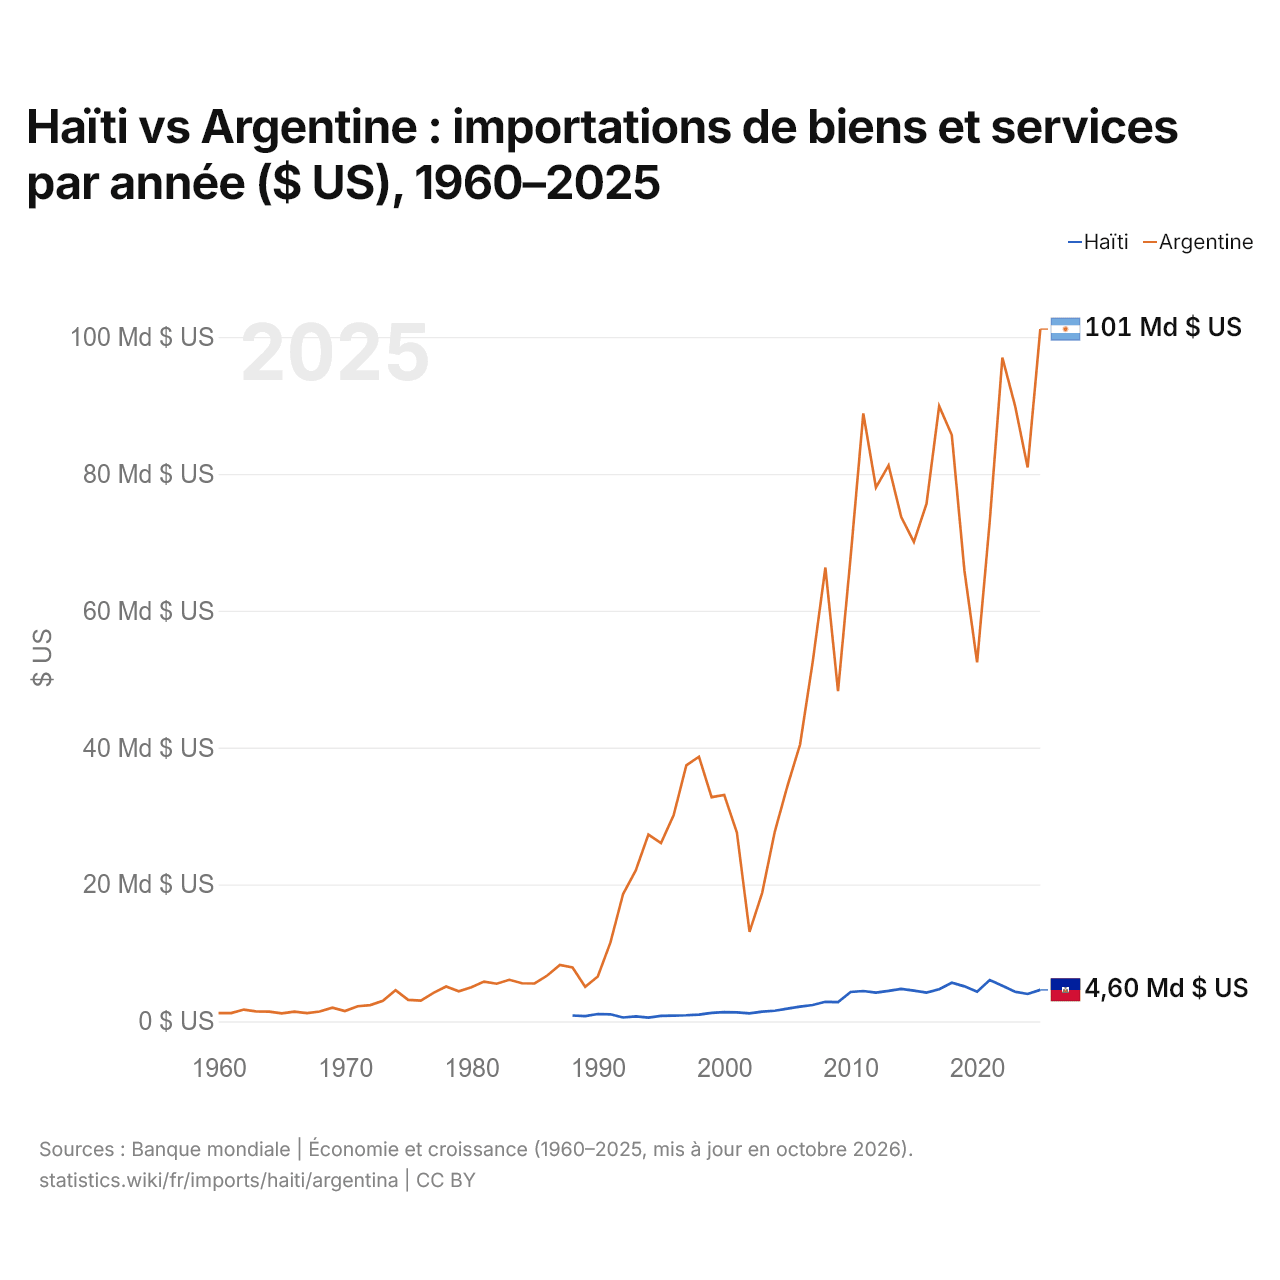
En 2025, les importations de biens et services d'Haïti s'élevaient à 4,6 milliards de dollars et celles de l'Argentine à 101 milliards de dollars : celles de l'Argentine étaient 22 fois plus élevées. En 1988, les importations de l'Argentine étaient 9,3 fois plus élevées : 849 millions de dollars pour Haïti et 7,88 milliards de dollars pour l'Argentine.
Les importations de biens et services de l'Argentine sont supérieures à celles d'Haïti chaque année depuis 1988.
Haïti vs Argentine : chiffres des importations
|
Haïti
|
Argentine
|
|
|---|---|---|
| Importations | 4,60 Md $US (2025) | 101 Md $US (2025) |
| Rang mondial | 141/174 | 49/174 |
| Part mondiale | 0,01 % | 0,3 % |
| % du PIB | 14,3 % | 14,8 % |
| Première catégorie de biens | Pétrole, gaz, minerais et autres matières premières (16,5 %, 2017) | Machines, électronique et véhicules (49,9 %, 2025) |
| Première origine des biens | États-Unis (30,2 %, 2017) | Brésil (24,5 %, 2025) |
Comparer les importations de 2 pays au choix
Sources :
- Banque mondiale | Économie et croissance (1960–2025, mis à jour en octobre 2026)
- TradeMap (2001–2025, mis à jour en octobre 2026)
Creative Commons Attribution (CC BY) : vous pouvez copier, partager, adapter et réutiliser ce contenu, y compris à des fins commerciales, à condition de citer statistics.wiki et d’indiquer les modifications apportées. Les sources citées ci-dessus peuvent avoir leurs propres conditions de licence.