
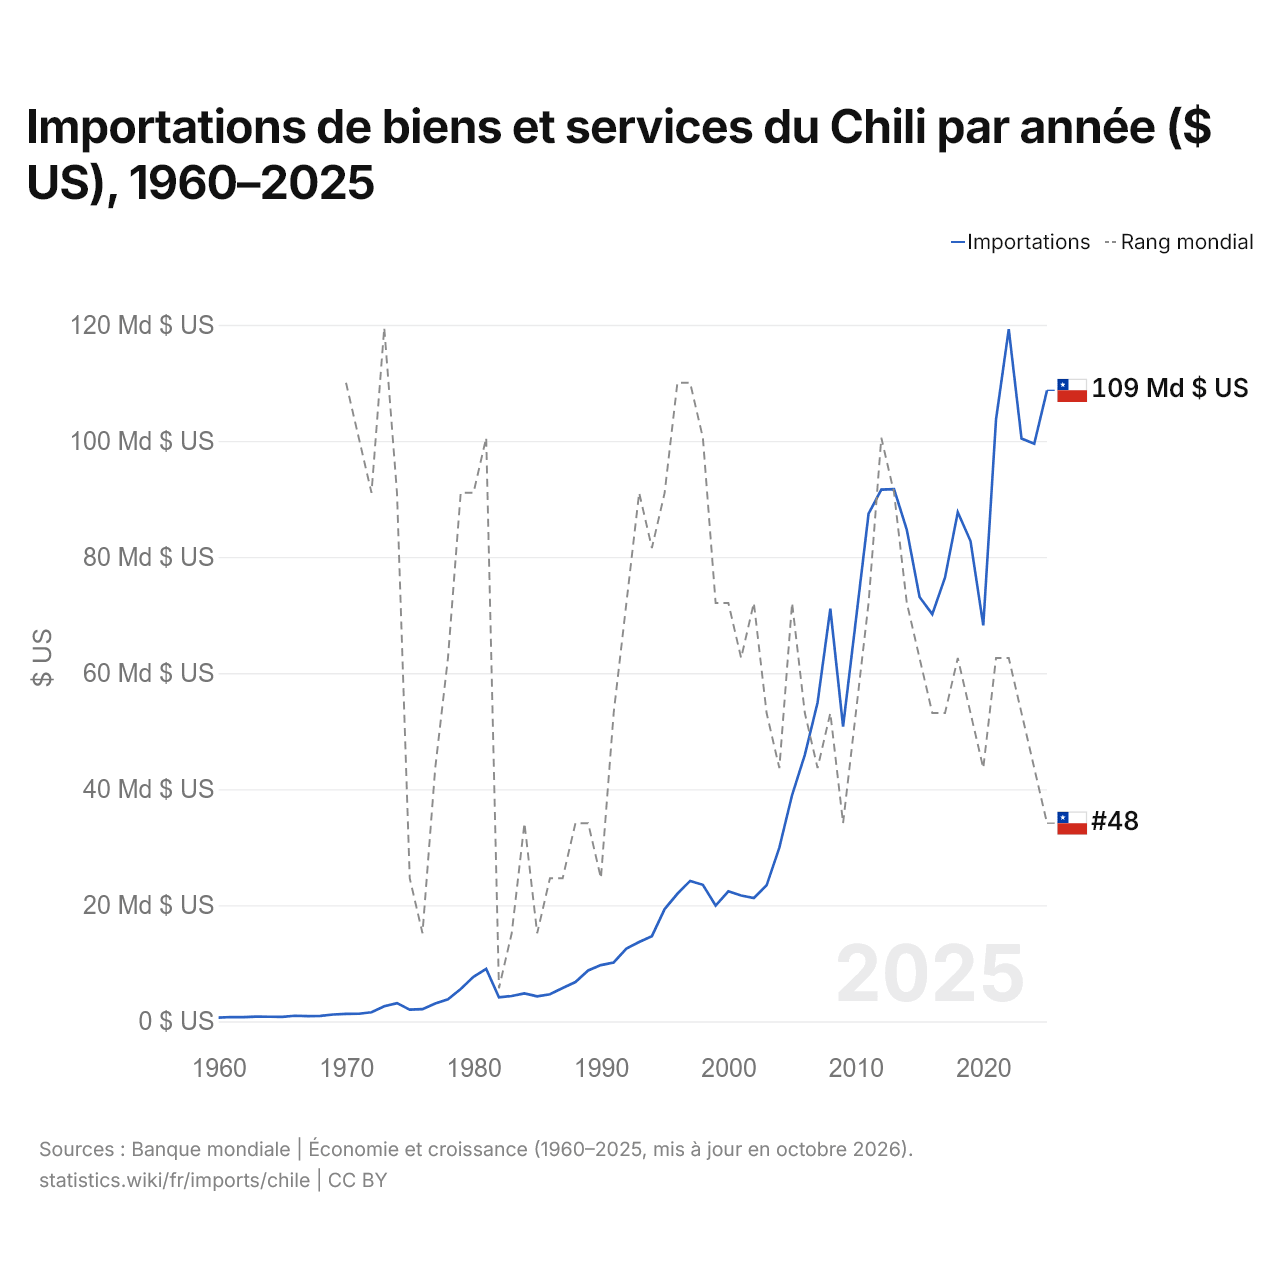
Importations de biens et services du Chili par année ($ US), 1960–2025
| Année | $ US | Rang mondial |
|---|---|---|
| Importations | Rang mondial | |
| 2025 | 108 715 223 275 $ US | #48 |
| 2024 | 99 521 252 623 $ US | #47 |
| 2023 | 100 410 335 716 $ US | #46 |
| 2022 | 119 270 630 425 $ US | #45 |
| 2021 | 103 693 578 714 $ US | #45 |
| 2020 | 68 216 602 660 $ US | #47 |
| 2019 | 82 753 870 848 $ US | #46 |
| 2018 | 87 715 868 252 $ US | #45 |
| 2017 | 76 480 319 596 $ US | #46 |
| 2016 | 70 152 435 857 $ US | #46 |
| 2015 | 73 118 254 671 $ US | #45 |
| 2014 | 84 696 627 984 $ US | #44 |
| 2013 | 91 695 211 542 $ US | #42 |
| 2012 | 91 617 676 952 $ US | #41 |
| 2011 | 87 460 679 326 $ US | #44 |
| 2010 | 69 051 990 702 $ US | #46 |
| 2009 | 50 795 406 457 $ US | #48 |
| 2008 | 71 083 668 290 $ US | #46 |
| 2007 | 54 933 530 784 $ US | #47 |
| 2006 | 45 916 074 877 $ US | #46 |
| 2005 | 38 995 887 667 $ US | #44 |
| 2004 | 29 924 524 972 $ US | #47 |
| 2003 | 23 431 545 588 $ US | #46 |
| 2002 | 21 238 455 351 $ US | #44 |
| 2001 | 21 685 324 598 $ US | #45 |
| 2000 | 22 395 900 152 $ US | #44 |
| 1999 | 19 942 567 935 $ US | #44 |
| 1998 | 23 525 064 326 $ US | #41 |
| 1997 | 24 197 338 480 $ US | #40 |
| 1996 | 21 980 212 268 $ US | #40 |
| 1995 | 19 346 030 597 $ US | #42 |
| 1994 | 14 678 158 958 $ US | #43 |
| 1993 | 13 666 593 546 $ US | #42 |
| 1992 | 12 540 686 002 $ US | #44 |
| 1991 | 10 140 234 075 $ US | #46 |
| 1990 | 9 693 182 798 $ US | #49 |
| 1989 | 8 763 350 928 $ US | #48 |
| 1988 | 6 766 137 916 $ US | #48 |
| 1987 | 5 751 612 001 $ US | #49 |
| 1986 | 4 673 923 939 $ US | #49 |
| 1985 | 4 311 198 581 $ US | #50 |
| 1984 | 4 811 879 608 $ US | #48 |
| 1983 | 4 356 873 073 $ US | #50 |
| 1982 | 4 150 382 431 $ US | #51 |
| 1981 | 9 047 297 177 $ US | #41 |
| 1980 | 7 679 845 876 $ US | #42 |
| 1979 | 5 571 046 794 $ US | #42 |
| 1978 | 3 783 299 653 $ US | #45 |
| 1977 | 3 075 423 107 $ US | #47 |
| 1976 | 2 099 453 727 $ US | #50 |
| 1975 | 2 025 174 741 $ US | #49 |
| 1974 | 3 129 086 575 $ US | #42 |
| 1973 | 2 589 239 510 $ US | #39 |
| 1972 | 1 557 530 214 $ US | #42 |
| 1971 | 1 309 764 436 $ US | #41 |
| 1970 | 1 277 369 303 $ US | #40 |
| 1969 | 1 175 704 224 $ US | - |
| 1968 | 942 056 428 $ US | - |
| 1967 | 910 871 350 $ US | - |
| 1966 | 960 122 046 $ US | - |
| 1965 | 772 992 398 $ US | - |
| 1964 | 788 872 995 $ US | - |
| 1963 | 825 800 247 $ US | - |
| 1962 | 720 689 036 $ US | - |
| 1961 | 749 723 810 $ US | - |
| 1960 | 650 749 091 $ US | - |
En 2025, les importations de biens et services du Chili s'élevaient à 109 milliards de dollars, contre 651 millions de dollars en 1960. Le maximum a été de 119 milliards de dollars, en 2022. Elles se classaient au 48e rang mondial, en baisse par rapport au 47e rang en 2024. Leur meilleur rang a été le 39e, occupé pour la dernière fois en 1973.
En 2025, les importations de biens et services du Chili étaient les 3es plus élevées de 26 pays situés en Amérique latine, après celles du Mexique et du Brésil. En 2025, les exportations du Chili dépassaient ses importations de 14,8 milliards de dollars, soit un excédent commercial. Le commerce du Chili, exportations et importations réunies, équivalait à 65,0 % de son PIB en 2025, au 111e rang mondial.
Importations de biens du Chili par catégorie, 2025
Importations de biens, 2025: 87,4 Md $US
En 2025, la première catégorie des importations de biens du Chili était « machines, électronique et véhicules », avec 38,2 %, suivie de « pétrole, gaz, minerais et autres matières premières », avec 21,1 %.
Origines des importations de biens du Chili : les 10 premières, 2025
| Rang | Pays | Importations de biens | Part | |
|---|---|---|---|---|
| 1 |
 Chine |
23,8 Md $US | 27,3 % | |
| 2 |
 États-Unis |
15,9 Md $US | 18,2 % | |
| 3 |
 Brésil |
7,85 Md $US | 8,99 % | vs Brésil |
| 4 |
 Argentine |
6,85 Md $US | 7,84 % | vs Argentine |
| 5 |
 Allemagne |
3,08 Md $US | 3,53 % | |
| 6 |
 Espagne |
2,13 Md $US | 2,44 % | |
| 7 |
 Pérou |
2,13 Md $US | 2,44 % | vs Pérou |
| 8 |
 Japon |
1,82 Md $US | 2,09 % | |
| 9 |
 Vietnam |
1,74 Md $US | 2 % | |
| 10 |
 Mexique |
1,70 Md $US | 1,95 % | vs Mexique |
| Autres partenaires et non précisés | 20,4 Md $US | 23,3 % |
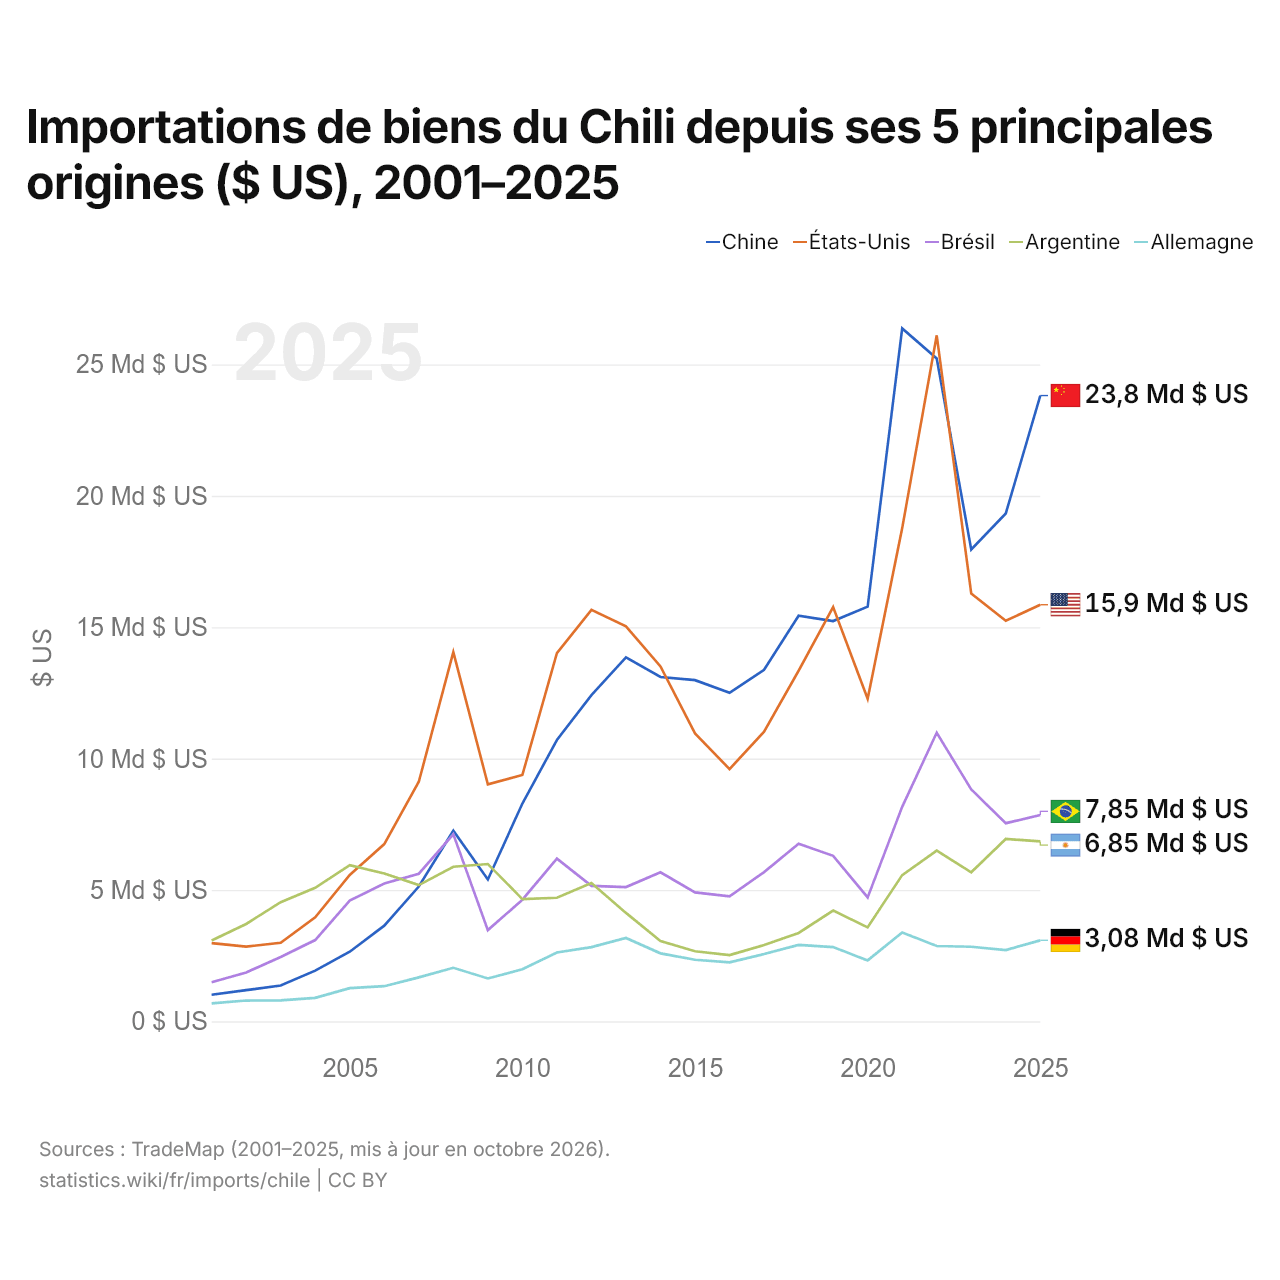
Importations de biens du Chili depuis ses 5 principales origines ($ US), 2001–2025
| Année | $ US | ||||
|---|---|---|---|---|---|
| Chine | États-Unis | Brésil | Argentine | Allemagne | |
| 2025 | 23 818 861 000 $ US | 15 856 733 000 $ US | 7 851 353 000 $ US | 6 847 026 000 $ US | 3 082 709 000 $ US |
| 2024 | 19 330 066 000 $ US | 15 243 933 000 $ US | 7 542 285 000 $ US | 6 941 055 000 $ US | 2 710 373 000 $ US |
| 2023 | 17 956 508 000 $ US | 16 282 825 000 $ US | 8 824 683 000 $ US | 5 672 216 000 $ US | 2 838 573 000 $ US |
| 2022 | 25 227 038 000 $ US | 26 109 024 000 $ US | 10 983 004 000 $ US | 6 495 845 000 $ US | 2 868 269 000 $ US |
| 2021 | 26 373 652 000 $ US | 18 772 446 000 $ US | 8 165 599 000 $ US | 5 565 503 000 $ US | 3 382 755 000 $ US |
| 2020 | 15 783 719 000 $ US | 12 275 861 000 $ US | 4 718 041 000 $ US | 3 577 401 000 $ US | 2 319 164 000 $ US |
| 2019 | 15 236 144 000 $ US | 15 770 090 000 $ US | 6 301 301 000 $ US | 4 217 520 000 $ US | 2 826 047 000 $ US |
| 2018 | 15 436 332 000 $ US | 13 341 828 000 $ US | 6 757 681 000 $ US | 3 364 122 000 $ US | 2 911 342 000 $ US |
| 2017 | 13 381 667 000 $ US | 11 023 438 000 $ US | 5 677 576 000 $ US | 2 903 154 000 $ US | 2 560 043 000 $ US |
| 2016 | 12 502 493 000 $ US | 9 601 329 000 $ US | 4 755 380 000 $ US | 2 523 257 000 $ US | 2 247 014 000 $ US |
| 2015 | 12 986 019 000 $ US | 10 957 218 000 $ US | 4 907 682 000 $ US | 2 666 244 000 $ US | 2 343 923 000 $ US |
| 2014 | 13 105 121 000 $ US | 13 506 978 000 $ US | 5 675 016 000 $ US | 3 060 326 000 $ US | 2 587 708 000 $ US |
| 2013 | 13 855 215 000 $ US | 15 034 332 000 $ US | 5 110 712 000 $ US | 4 126 177 000 $ US | 3 174 261 000 $ US |
| 2012 | 12 418 697 000 $ US | 15 659 907 000 $ US | 5 157 459 000 $ US | 5 265 529 000 $ US | 2 825 538 000 $ US |
| 2011 | 10 706 748 000 $ US | 14 015 327 000 $ US | 6 191 667 000 $ US | 4 705 080 000 $ US | 2 619 610 000 $ US |
| 2010 | 8 289 582 000 $ US | 9 376 385 000 $ US | 4 628 885 000 $ US | 4 652 833 000 $ US | 1 981 767 000 $ US |
| 2009 | 5 399 753 000 $ US | 9 022 007 000 $ US | 3 470 932 000 $ US | 5 987 937 000 $ US | 1 632 348 000 $ US |
| 2008 | 7 255 131 000 $ US | 14 055 016 000 $ US | 7 119 657 000 $ US | 5 884 655 000 $ US | 2 037 681 000 $ US |
| 2007 | 5 130 233 000 $ US | 9 118 207 000 $ US | 5 618 869 000 $ US | 5 186 380 000 $ US | 1 671 909 000 $ US |
| 2006 | 3 642 485 000 $ US | 6 747 691 000 $ US | 5 249 162 000 $ US | 5 628 261 000 $ US | 1 337 500 000 $ US |
| 2005 | 2 650 109 000 $ US | 5 572 076 000 $ US | 4 596 793 000 $ US | 5 946 183 000 $ US | 1 262 494 000 $ US |
| 2004 | 1 929 169 000 $ US | 3 960 642 000 $ US | 3 094 033 000 $ US | 5 082 672 000 $ US | 892 492 000 $ US |
| 2003 | 1 365 645 000 $ US | 2 991 683 000 $ US | 2 450 965 000 $ US | 4 533 425 000 $ US | 796 657 000 $ US |
| 2002 | 1 186 237 000 $ US | 2 842 619 000 $ US | 1 859 717 000 $ US | 3 705 816 000 $ US | 791 247 000 $ US |
| 2001 | 1 013 099 000 $ US | 2 976 102 000 $ US | 1 490 816 000 $ US | 3 074 058 000 $ US | 684 142 000 $ US |
En 2025, les importations de biens s'élevaient à 23,8 milliards de dollars en provenance de la Chine, 15,9 milliards de dollars en provenance des États-Unis, 7,85 milliards de dollars en provenance du Brésil, 6,85 milliards de dollars en provenance de l'Argentine et 3,08 milliards de dollars en provenance de l'Allemagne. Le premier rang des cinq fournisseurs du Chili est occupé par la Chine depuis 2023.
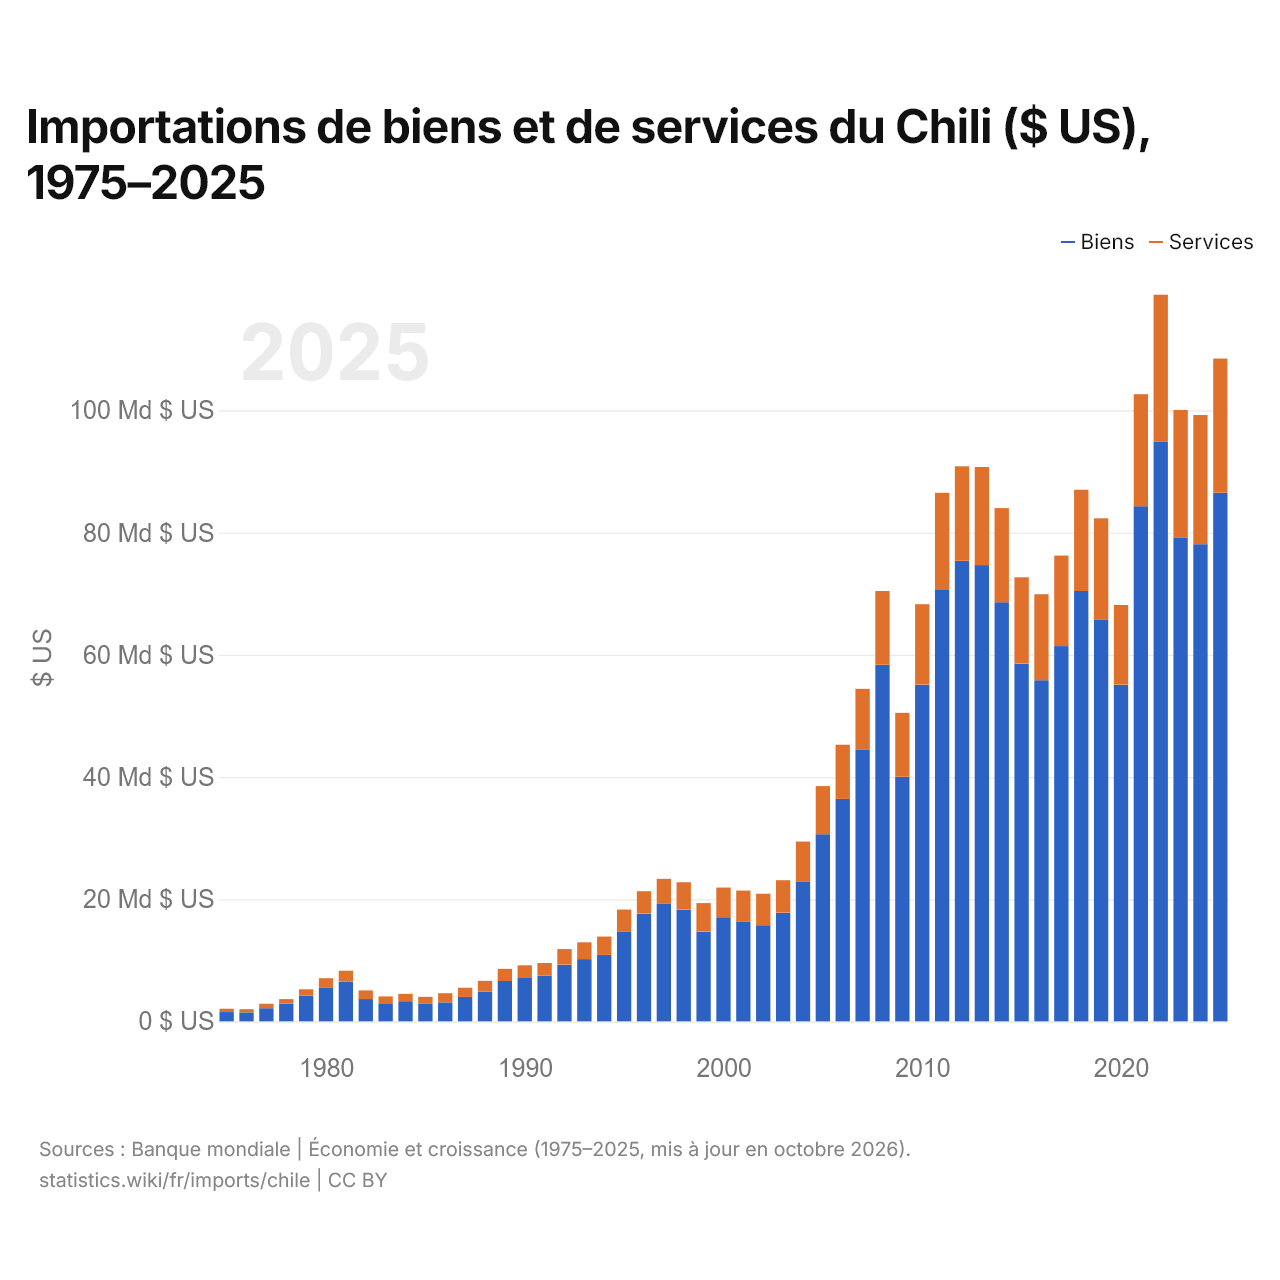
Importations de biens et de services du Chili ($ US), 1975–2025
| Année | $ US | |
|---|---|---|
| Biens | Services | |
| 2025 | 86 515 603 245 $ US | 21 948 568 599 $ US |
| 2024 | 78 098 102 993 $ US | 21 131 468 274 $ US |
| 2023 | 79 114 061 440 $ US | 20 944 477 658 $ US |
| 2022 | 94 904 545 877 $ US | 24 023 894 981 $ US |
| 2021 | 84 298 843 436 $ US | 18 337 676 561 $ US |
| 2020 | 55 107 524 956 $ US | 13 026 956 218 $ US |
| 2019 | 65 776 232 155 $ US | 16 547 433 677 $ US |
| 2018 | 70 429 568 219 $ US | 16 567 154 808 $ US |
| 2017 | 61 413 799 389 $ US | 14 804 099 323 $ US |
| 2016 | 55 818 817 538 $ US | 14 078 917 071 $ US |
| 2015 | 58 544 405 842 $ US | 14 128 342 206 $ US |
| 2014 | 68 593 775 670 $ US | 15 400 984 663 $ US |
| 2013 | 74 670 217 340 $ US | 16 051 565 796 $ US |
| 2012 | 75 374 270 472 $ US | 15 459 016 389 $ US |
| 2011 | 70 591 146 901 $ US | 15 905 675 060 $ US |
| 2010 | 55 107 733 124 $ US | 13 166 681 701 $ US |
| 2009 | 40 023 222 836 $ US | 10 461 677 231 $ US |
| 2008 | 58 355 092 940 $ US | 12 072 132 923 $ US |
| 2007 | 44 420 017 110 $ US | 9 994 091 178 $ US |
| 2006 | 36 404 414 881 $ US | 8 858 224 146 $ US |
| 2005 | 30 616 765 738 $ US | 7 883 176 855 $ US |
| 2004 | 22 829 937 344 $ US | 6 598 732 808 $ US |
| 2003 | 17 803 473 186 $ US | 5 285 606 470 $ US |
| 2002 | 15 742 541 722 $ US | 5 138 705 999 $ US |
| 2001 | 16 356 140 000 $ US | 5 054 742 510 $ US |
| 2000 | 17 028 810 000 $ US | 4 864 288 891 $ US |
| 1999 | 14 681 790 000 $ US | 4 659 500 986 $ US |
| 1998 | 18 288 420 000 $ US | 4 478 473 603 $ US |
| 1997 | 19 222 140 000 $ US | 4 103 256 407 $ US |
| 1996 | 17 623 815 000 $ US | 3 663 534 100 $ US |
| 1995 | 14 644 000 000 $ US | 3 657 000 000 $ US |
| 1994 | 10 872 100 000 $ US | 2 990 900 000 $ US |
| 1993 | 10 188 500 000 $ US | 2 740 600 000 $ US |
| 1992 | 9 285 400 000 $ US | 2 536 000 000 $ US |
| 1991 | 7 456 400 000 $ US | 2 093 100 000 $ US |
| 1990 | 7 089 200 000 $ US | 2 076 310 000 $ US |
| 1989 | 6 595 200 000 $ US | 1 994 910 000 $ US |
| 1988 | 4 844 300 000 $ US | 1 780 400 000 $ US |
| 1987 | 3 994 300 000 $ US | 1 498 800 000 $ US |
| 1986 | 3 099 100 000 $ US | 1 505 400 000 $ US |
| 1985 | 2 920 400 000 $ US | 1 080 500 000 $ US |
| 1984 | 3 288 000 000 $ US | 1 207 000 000 $ US |
| 1983 | 2 845 000 000 $ US | 1 236 000 000 $ US |
| 1982 | 3 643 000 000 $ US | 1 410 000 000 $ US |
| 1981 | 6 513 000 000 $ US | 1 780 000 000 $ US |
| 1980 | 5 469 000 000 $ US | 1 583 000 000 $ US |
| 1979 | 4 190 000 000 $ US | 1 048 000 000 $ US |
| 1978 | 2 886 000 000 $ US | 751 000 000 $ US |
| 1977 | 2 151 000 000 $ US | 734 000 000 $ US |
| 1976 | 1 473 000 000 $ US | 515 000 000 $ US |
| 1975 | 1 520 000 000 $ US | 535 000 000 $ US |
En 2025, les importations de biens du Chili s'élevaient à 86,5 milliards de dollars et celles de services à 21,9 milliards de dollars ; les services représentaient 20,2 % du total, contre 26,0 % en 1975.
Le Chili dans le classement mondial des importations, 2025






Importations de biens et services du Chili, % du PIB, 1960–2025
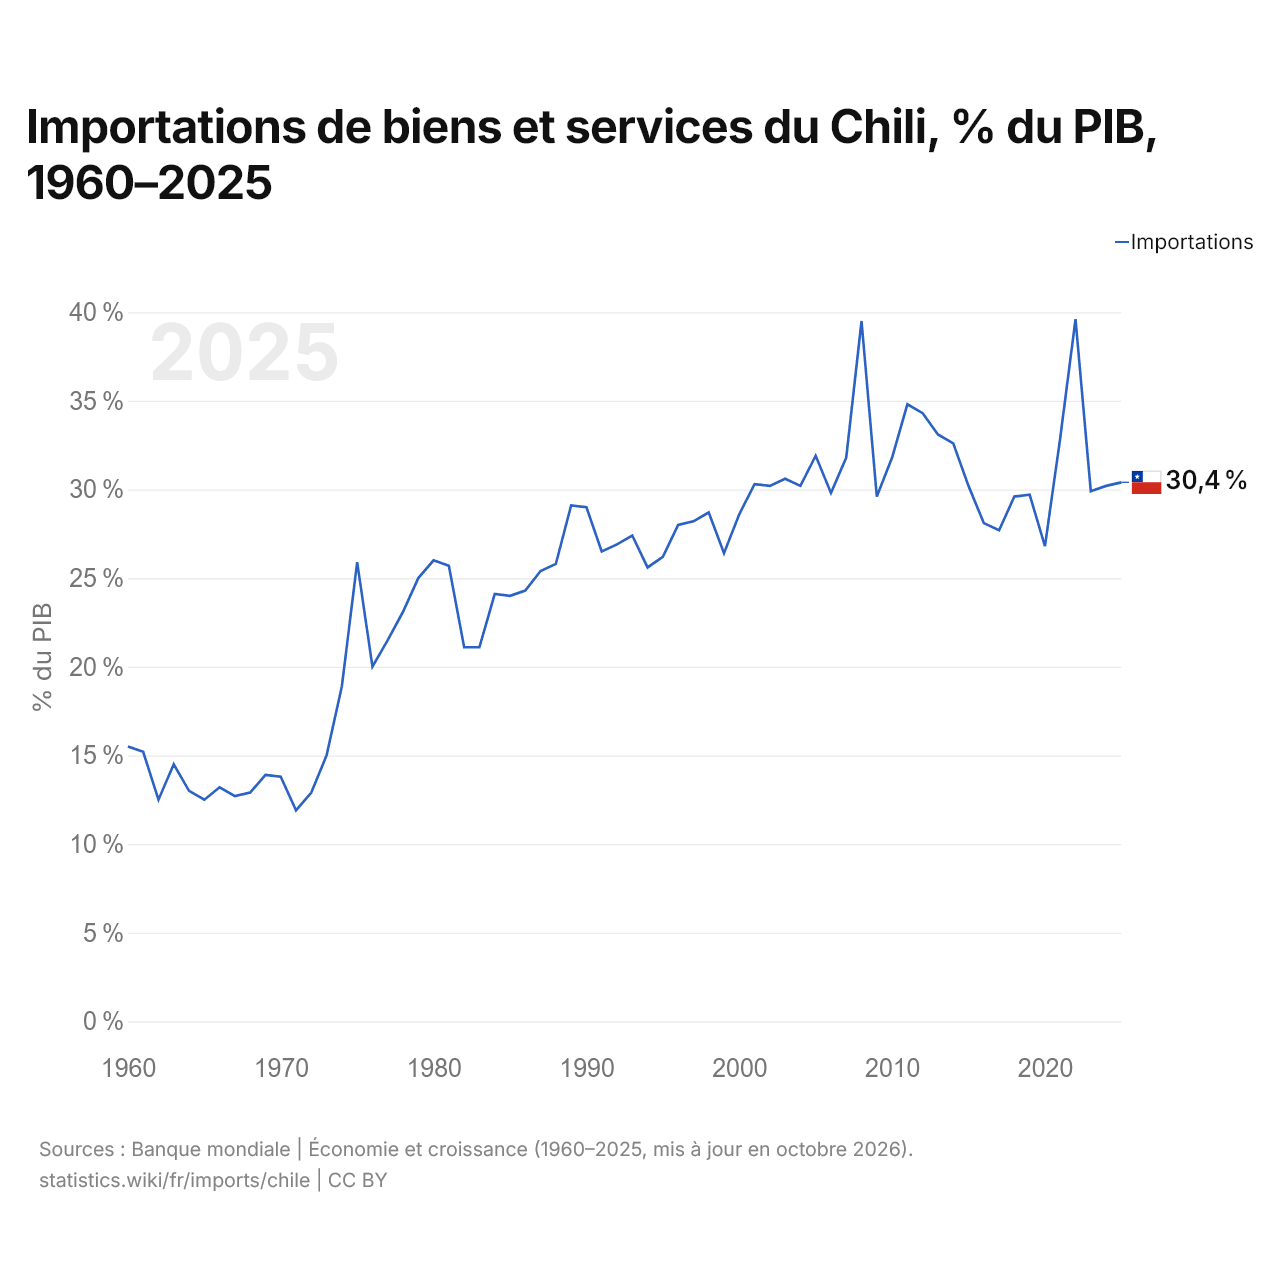
En 2025, les importations de biens et services du Chili équivalaient à 30,4 % de son PIB, contre 15,5 % en 1960. La part la plus élevée a été de 39,6 %, en 2022.
Comparer les importations du Chili avec celles d'autres pays
Sources :
- Banque mondiale | Économie et croissance (1960–2025, mis à jour en octobre 2026)
- TradeMap (2001–2025, mis à jour en octobre 2026)
Creative Commons Attribution (CC BY) : vous pouvez copier, partager, adapter et réutiliser ce contenu, y compris à des fins commerciales, à condition de citer statistics.wiki et d’indiquer les modifications apportées. Les sources citées ci-dessus peuvent avoir leurs propres conditions de licence.