
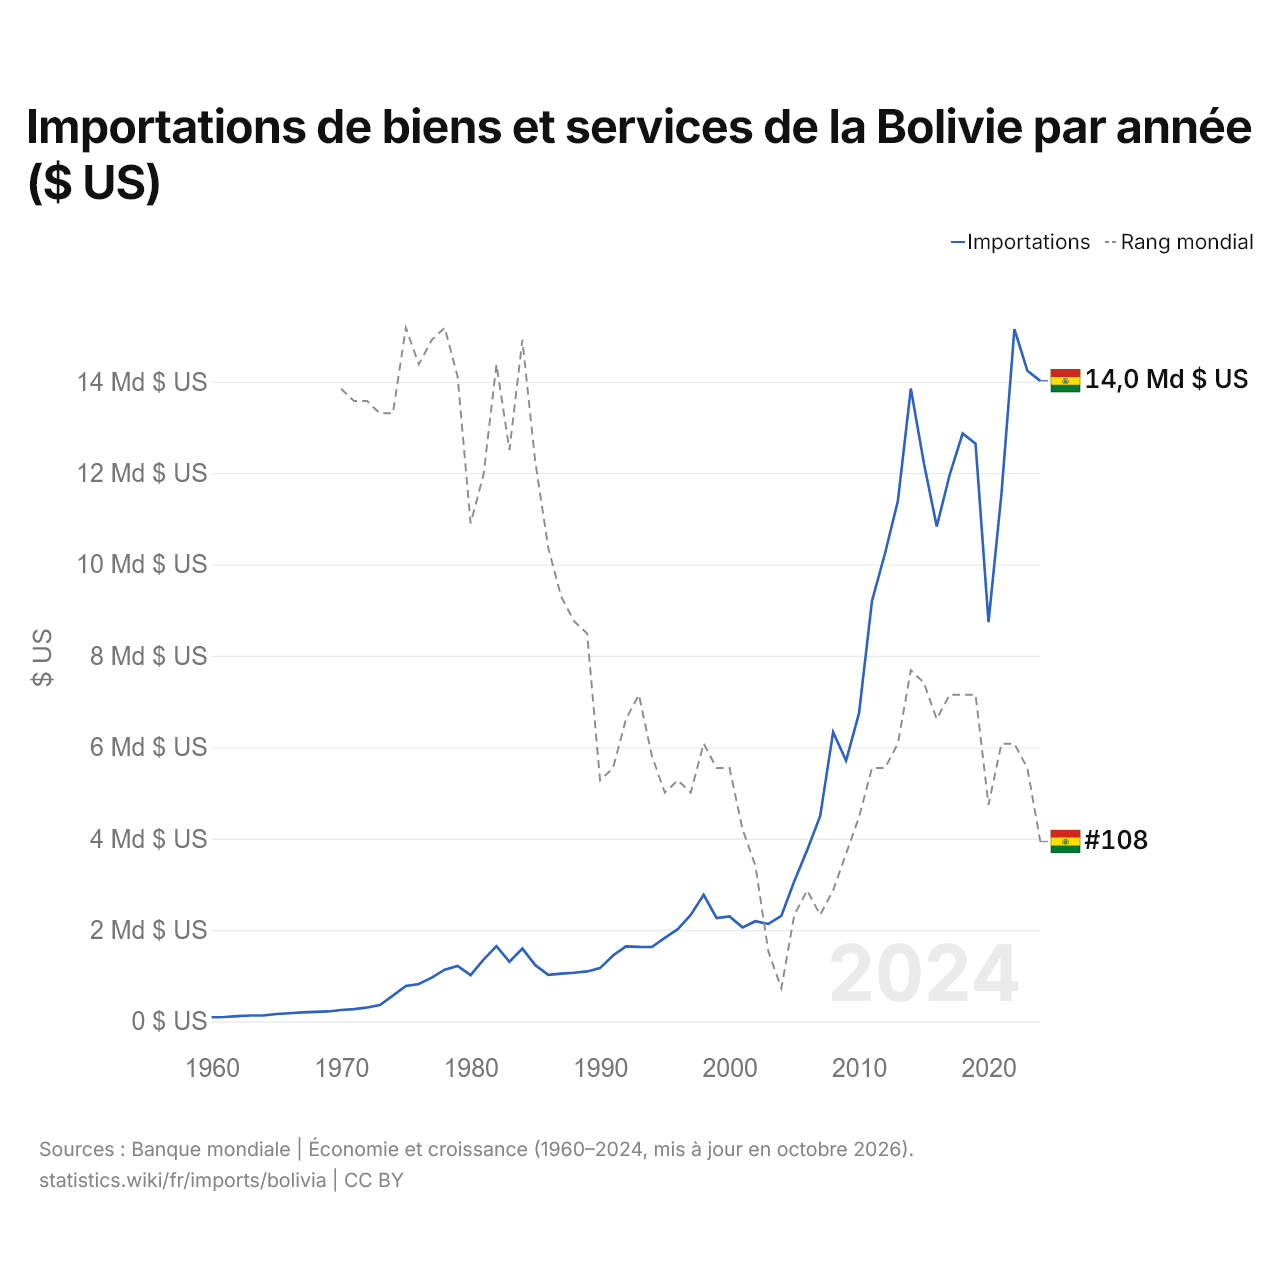
Importations de biens et services de la Bolivie par année ($ US)
| Année | $ US | Rang mondial |
|---|---|---|
| Importations | Rang mondial | |
| 2024 | 14 018 232 750 $ US | #108 |
| 2023 | 14 239 423 386 $ US | #102 |
| 2022 | 15 150 615 137 $ US | #100 |
| 2021 | 11 545 547 250 $ US | #100 |
| 2020 | 8 735 545 774 $ US | #105 |
| 2019 | 12 643 630 391 $ US | #96 |
| 2018 | 12 864 160 304 $ US | #96 |
| 2017 | 11 958 240 289 $ US | #96 |
| 2016 | 10 831 641 433 $ US | #98 |
| 2015 | 12 231 374 703 $ US | #95 |
| 2014 | 13 848 955 977 $ US | #94 |
| 2013 | 11 386 396 498 $ US | #100 |
| 2012 | 10 233 217 742 $ US | #102 |
| 2011 | 9 199 145 865 $ US | #102 |
| 2010 | 6 744 604 596 $ US | #106 |
| 2009 | 5 705 628 903 $ US | #109 |
| 2008 | 6 329 632 797 $ US | #112 |
| 2007 | 4 495 769 626 $ US | #114 |
| 2006 | 3 752 326 865 $ US | #112 |
| 2005 | 3 064 676 257 $ US | #114 |
| 2004 | 2 309 687 991 $ US | #120 |
| 2003 | 2 131 094 556 $ US | #117 |
| 2002 | 2 191 068 870 $ US | #110 |
| 2001 | 2 056 194 909 $ US | #107 |
| 2000 | 2 294 548 577 $ US | #102 |
| 1999 | 2 260 775 121 $ US | #102 |
| 1998 | 2 768 694 331 $ US | #100 |
| 1997 | 2 326 921 822 $ US | #104 |
| 1996 | 2 017 475 031 $ US | #103 |
| 1995 | 1 825 621 841 $ US | #104 |
| 1994 | 1 626 745 405 $ US | #101 |
| 1993 | 1 627 872 470 $ US | #96 |
| 1992 | 1 640 395 876 $ US | #98 |
| 1991 | 1 440 843 957 $ US | #102 |
| 1990 | 1 164 631 950 $ US | #103 |
| 1989 | 1 092 052 947 $ US | #91 |
| 1988 | 1 063 832 558 $ US | #90 |
| 1987 | 1 043 169 567 $ US | #88 |
| 1986 | 1 017 852 210 $ US | #84 |
| 1985 | 1 228 323 633 $ US | #77 |
| 1984 | 1 592 952 389 $ US | #67 |
| 1983 | 1 303 553 080 $ US | #76 |
| 1982 | 1 644 892 438 $ US | #69 |
| 1981 | 1 352 324 633 $ US | #78 |
| 1980 | 1 011 215 334 $ US | #82 |
| 1979 | 1 211 272 668 $ US | #70 |
| 1978 | 1 131 534 233 $ US | #66 |
| 1977 | 956 771 614 $ US | #67 |
| 1976 | 816 491 754 $ US | #69 |
| 1975 | 774 712 644 $ US | #66 |
| 1974 | 562 818 591 $ US | #73 |
| 1973 | 357 671 164 $ US | #73 |
| 1972 | 302 068 447 $ US | #72 |
| 1971 | 267 340 067 $ US | #72 |
| 1970 | 247 727 273 $ US | #71 |
| 1969 | 216 161 616 $ US | - |
| 1968 | 206 228 956 $ US | - |
| 1967 | 196 632 997 $ US | - |
| 1966 | 177 188 552 $ US | - |
| 1965 | 161 279 461 $ US | - |
| 1964 | 127 693 603 $ US | - |
| 1963 | 127 188 552 $ US | - |
| 1962 | 114 814 815 $ US | - |
| 1961 | 95 707 071 $ US | - |
| 1960 | 90 235 690 $ US | - |
Les importations de biens et services de la Bolivie s'élèvent à 14 milliards de dollars (2024), contre 90,2 millions de dollars en 1960. Le maximum a été de 15,2 milliards de dollars, en 2022. Elles se classent au 108e rang mondial, en baisse par rapport au 102e rang l'année précédente. Leur meilleur rang a été le 66e, occupé pour la dernière fois en 1978.
Les importations de biens et services de la Bolivie sont les 16es plus élevées de 26 pays situés en Amérique latine. Les importations de la Bolivie dépassent ses exportations de 2,25 milliards de dollars, soit un déficit commercial (2024). Le commerce de la Bolivie, exportations et importations réunies, équivaut à 47,0 % de son PIB (2024), au 139e rang mondial.
Importations de biens de la Bolivie par catégorie, 2025
Importations de biens, 2025: 10,0 Md $US
En 2025, la première catégorie des importations de biens de la Bolivie était « pétrole, gaz, minerais et autres matières premières », avec 34,0 %, suivie de « machines, électronique et véhicules », avec 24,2 %.
Origines des importations de biens de la Bolivie : les 10 premières, 2025
| Rang | Pays | Importations de biens | Part | |
|---|---|---|---|---|
| 1 |
 Chine |
2,41 Md $US | 24 % | |
| 2 |
 Brésil |
1,42 Md $US | 14,2 % | |
| 3 |
 Argentine |
827 M $US | 8,25 % | |
| 4 |
 Chili |
772 M $US | 7,7 % | |
| 5 |
 Pérou |
753 M $US | 7,51 % | |
| 6 |
 Paraguay |
515 M $US | 5,14 % | |
| 7 |
 États-Unis |
494 M $US | 4,93 % | |
| 8 |
 Belgique |
479 M $US | 4,78 % | |
| 9 |
 Japon |
226 M $US | 2,26 % | |
| 10 |
 Russie |
222 M $US | 2,21 % | |
| Autres partenaires et non précisés | 1,91 Md $US | 19 % |
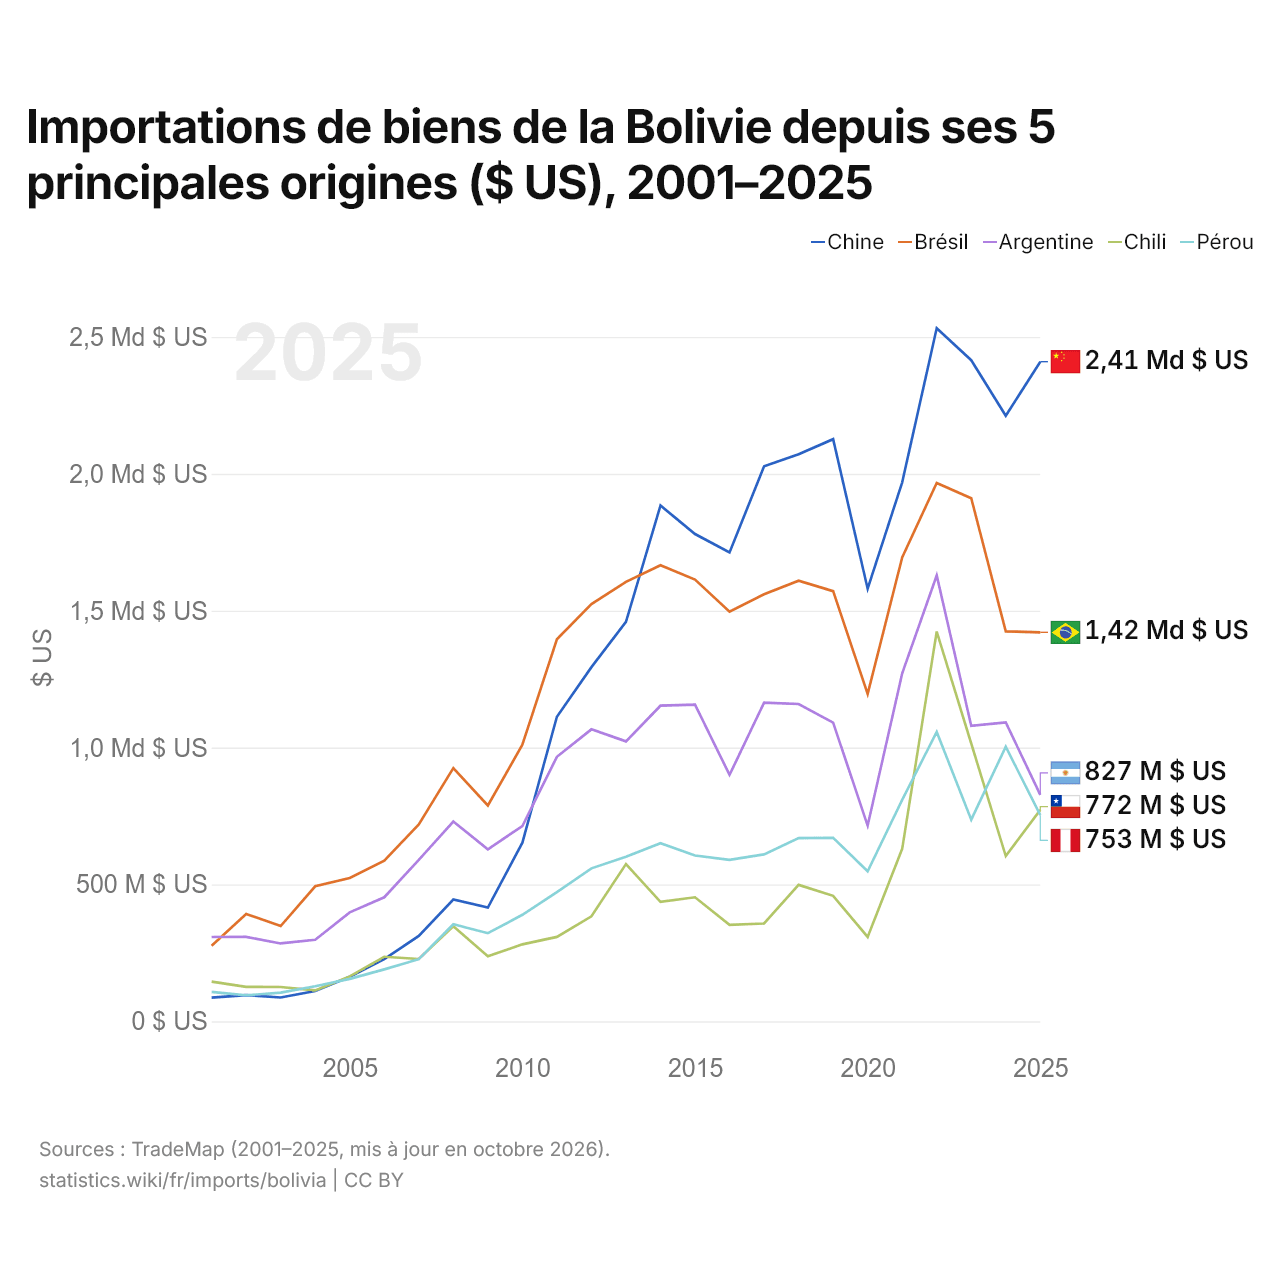
Importations de biens de la Bolivie depuis ses 5 principales origines ($ US), 2001–2025
| Année | $ US | ||||
|---|---|---|---|---|---|
| Chine | Brésil | Argentine | Chili | Pérou | |
| 2025 | 2 409 574 000 $ US | 1 420 934 000 $ US | 827 350 000 $ US | 772 216 000 $ US | 753 244 000 $ US |
| 2024 | 2 212 076 000 $ US | 1 424 670 000 $ US | 1 091 884 000 $ US | 603 787 000 $ US | 1 003 053 000 $ US |
| 2023 | 2 415 099 000 $ US | 1 910 834 000 $ US | 1 079 849 000 $ US | 1 014 926 000 $ US | 736 705 000 $ US |
| 2022 | 2 532 163 000 $ US | 1 966 775 000 $ US | 1 628 849 000 $ US | 1 423 770 000 $ US | 1 057 362 000 $ US |
| 2021 | 1 968 946 000 $ US | 1 694 911 000 $ US | 1 270 917 000 $ US | 630 005 000 $ US | 808 651 000 $ US |
| 2020 | 1 580 142 000 $ US | 1 195 920 000 $ US | 714 970 000 $ US | 308 256 000 $ US | 547 922 000 $ US |
| 2019 | 2 126 481 000 $ US | 1 571 502 000 $ US | 1 091 165 000 $ US | 458 428 000 $ US | 670 710 000 $ US |
| 2018 | 2 071 159 000 $ US | 1 609 333 000 $ US | 1 159 262 000 $ US | 498 500 000 $ US | 669 496 000 $ US |
| 2017 | 2 027 342 000 $ US | 1 559 955 000 $ US | 1 164 041 000 $ US | 357 298 000 $ US | 609 722 000 $ US |
| 2016 | 1 712 756 000 $ US | 1 496 050 000 $ US | 900 207 000 $ US | 352 565 000 $ US | 590 097 000 $ US |
| 2015 | 1 780 156 000 $ US | 1 613 531 000 $ US | 1 157 045 000 $ US | 453 153 000 $ US | 605 881 000 $ US |
| 2014 | 1 884 290 000 $ US | 1 665 958 000 $ US | 1 153 035 000 $ US | 436 586 000 $ US | 650 738 000 $ US |
| 2013 | 1 459 054 000 $ US | 1 605 220 000 $ US | 1 022 719 000 $ US | 574 438 000 $ US | 601 593 000 $ US |
| 2012 | 1 293 710 000 $ US | 1 524 450 000 $ US | 1 066 615 000 $ US | 383 560 000 $ US | 558 825 000 $ US |
| 2011 | 1 112 707 000 $ US | 1 395 476 000 $ US | 966 372 000 $ US | 308 507 000 $ US | 472 343 000 $ US |
| 2010 | 652 851 000 $ US | 1 010 167 000 $ US | 713 518 000 $ US | 281 202 000 $ US | 389 123 000 $ US |
| 2009 | 415 592 000 $ US | 788 575 000 $ US | 628 454 000 $ US | 237 831 000 $ US | 321 994 000 $ US |
| 2008 | 445 113 000 $ US | 925 257 000 $ US | 729 785 000 $ US | 347 521 000 $ US | 354 443 000 $ US |
| 2007 | 312 150 000 $ US | 719 120 000 $ US | 589 886 000 $ US | 227 842 000 $ US | 227 084 000 $ US |
| 2006 | 227 004 000 $ US | 587 126 000 $ US | 453 185 000 $ US | 235 987 000 $ US | 189 915 000 $ US |
| 2005 | 163 064 000 $ US | 523 527 000 $ US | 397 967 000 $ US | 164 188 000 $ US | 155 177 000 $ US |
| 2004 | 110 796 000 $ US | 493 447 000 $ US | 298 076 000 $ US | 113 079 000 $ US | 128 373 000 $ US |
| 2003 | 87 112 000 $ US | 347 958 000 $ US | 284 516 000 $ US | 125 453 000 $ US | 104 759 000 $ US |
| 2002 | 95 893 000 $ US | 392 450 000 $ US | 308 501 000 $ US | 126 120 000 $ US | 94 980 000 $ US |
| 2001 | 86 344 000 $ US | 276 444 000 $ US | 307 947 000 $ US | 144 802 000 $ US | 107 875 000 $ US |
En 2025, les importations de biens s'élevaient à 2,41 milliards de dollars en provenance de la Chine, 1,42 milliard de dollars en provenance du Brésil, 827 millions de dollars en provenance de l'Argentine, 772 millions de dollars en provenance du Chili et 753 millions de dollars en provenance du Pérou. Le premier rang des cinq fournisseurs de la Bolivie est occupé par la Chine depuis 2014. Le changement le plus récent dans leur ordre remonte à 2025, quand les importations de la Bolivie en provenance du Chili ont dépassé celles en provenance du Pérou.
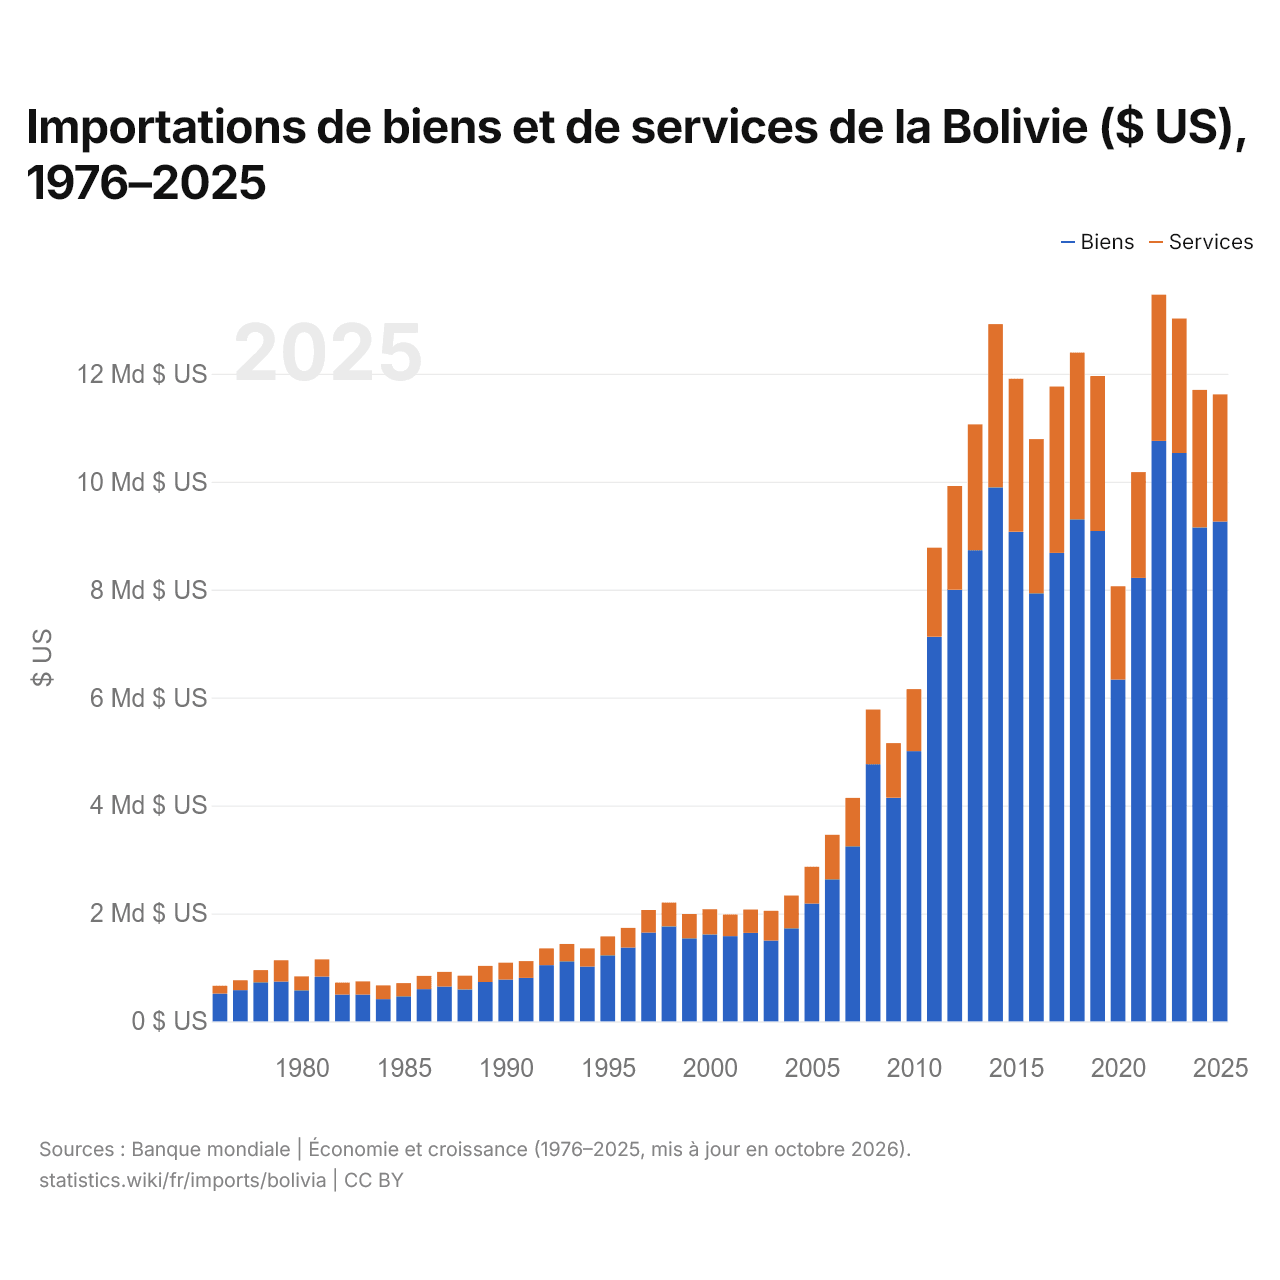
Importations de biens et de services de la Bolivie ($ US), 1976–2025
| Année | $ US | |
|---|---|---|
| Biens | Services | |
| 2025 | 9 260 576 132 $ US | 2 356 466 025 $ US |
| 2024 | 9 151 819 124 $ US | 2 548 507 762 $ US |
| 2023 | 10 531 914 109 $ US | 2 490 219 579 $ US |
| 2022 | 10 755 744 305 $ US | 2 709 212 343 $ US |
| 2021 | 8 216 070 562 $ US | 1 960 590 716 $ US |
| 2020 | 6 333 861 464 $ US | 1 728 570 356 $ US |
| 2019 | 9 085 852 594 $ US | 2 871 435 058 $ US |
| 2018 | 9 301 944 792 $ US | 3 089 472 123 $ US |
| 2017 | 8 680 869 448 $ US | 3 081 140 402 $ US |
| 2016 | 7 930 773 107 $ US | 2 857 927 957 $ US |
| 2015 | 9 071 898 887 $ US | 2 835 251 388 $ US |
| 2014 | 9 893 765 587 $ US | 3 024 822 580 $ US |
| 2013 | 8 729 181 721 $ US | 2 331 501 739 $ US |
| 2012 | 7 997 488 635 $ US | 1 921 422 622 $ US |
| 2011 | 7 126 366 595 $ US | 1 650 733 456 $ US |
| 2010 | 5 006 774 120 $ US | 1 148 813 465 $ US |
| 2009 | 4 143 570 000 $ US | 1 012 220 000 $ US |
| 2008 | 4 764 087 001 $ US | 1 014 028 000 $ US |
| 2007 | 3 243 473 509 $ US | 896 731 586 $ US |
| 2006 | 2 632 100 970 $ US | 824 794 485 $ US |
| 2005 | 2 182 590 109 $ US | 681 954 426 $ US |
| 2004 | 1 724 732 878 $ US | 606 221 071 $ US |
| 2003 | 1 497 372 825 $ US | 550 740 000 $ US |
| 2002 | 1 638 700 000 $ US | 433 295 000 $ US |
| 2001 | 1 580 000 000 $ US | 399 443 800 $ US |
| 2000 | 1 610 160 000 $ US | 467 680 000 $ US |
| 1999 | 1 539 000 000 $ US | 449 700 000 $ US |
| 1998 | 1 759 500 000 $ US | 440 500 000 $ US |
| 1997 | 1 643 600 000 $ US | 418 740 000 $ US |
| 1996 | 1 368 000 000 $ US | 363 420 000 $ US |
| 1995 | 1 223 700 000 $ US | 350 200 000 $ US |
| 1994 | 1 015 300 000 $ US | 337 500 000 $ US |
| 1993 | 1 111 700 000 $ US | 321 700 000 $ US |
| 1992 | 1 040 800 000 $ US | 311 000 000 $ US |
| 1991 | 804 200 000 $ US | 311 200 000 $ US |
| 1990 | 775 600 000 $ US | 310 600 000 $ US |
| 1989 | 729 500 000 $ US | 298 200 000 $ US |
| 1988 | 590 900 000 $ US | 254 800 000 $ US |
| 1987 | 646 300 000 $ US | 270 200 000 $ US |
| 1986 | 596 500 000 $ US | 245 800 000 $ US |
| 1985 | 462 800 000 $ US | 246 100 000 $ US |
| 1984 | 412 300 000 $ US | 253 500 000 $ US |
| 1983 | 496 000 000 $ US | 244 600 000 $ US |
| 1982 | 496 000 000 $ US | 221 700 000 $ US |
| 1981 | 827 700 000 $ US | 319 800 000 $ US |
| 1980 | 574 400 000 $ US | 258 500 000 $ US |
| 1979 | 738 400 000 $ US | 392 500 000 $ US |
| 1978 | 723 900 000 $ US | 224 200 000 $ US |
| 1977 | 579 000 000 $ US | 181 900 000 $ US |
| 1976 | 512 300 000 $ US | 147 100 000 $ US |
En 2025, les importations de biens de la Bolivie s'élevaient à 9,26 milliards de dollars et celles de services à 2,36 milliards de dollars ; les services représentaient 20,3 % du total, contre 22,3 % en 1976.
La Bolivie dans le classement mondial des importations
| Rang | Pays | Importations | Part mondiale | |
|---|---|---|---|---|
| 105 |
 Sénégal |
14,3 Md $US (2025) | 0,04 % | |
| 106 |
 Angola |
14,3 Md $US (2025) | 0,04 % | |
| 107 |
 Macédoine du Nord |
14,0 Md $US (2025) | 0,04 % | |
| 108 |
 Bolivie |
14,0 Md $US | 0,04 % | |
| 109 |
 Albanie |
13,0 Md $US (2025) | 0,04 % | |
| 110 |
 Somalie |
12,8 Md $US (2025) | 0,04 % | |
| 111 |
 Mozambique |
12,4 Md $US (2025) | 0,04 % |
Importations de biens et services de la Bolivie, % du PIB
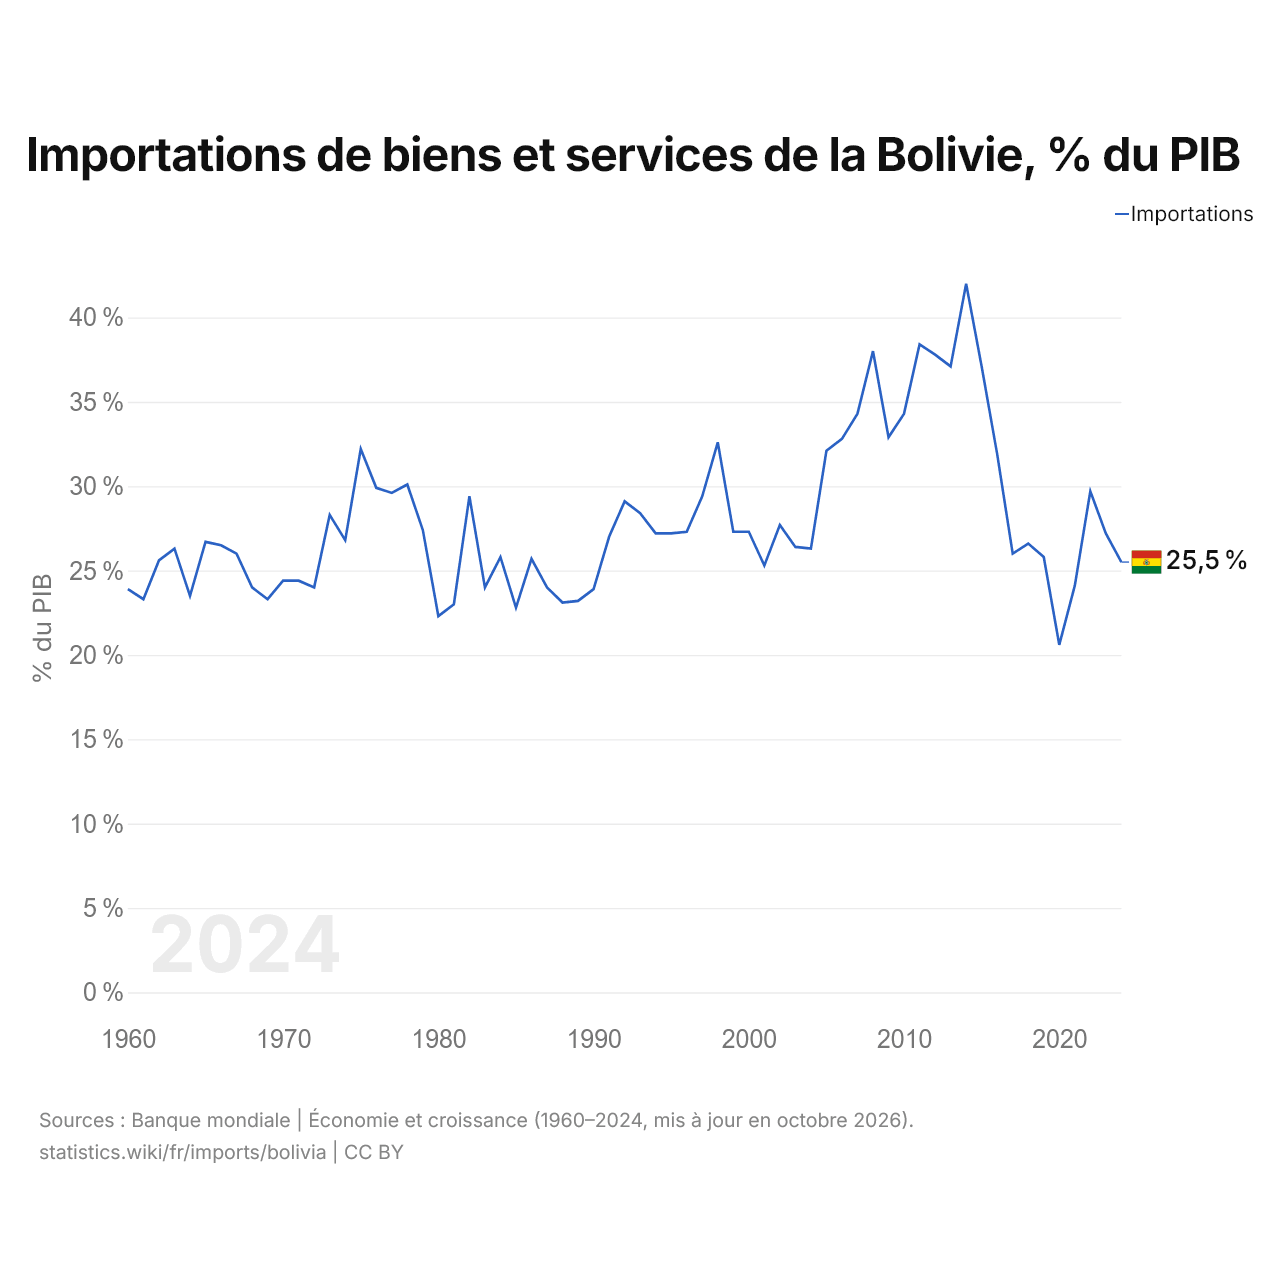
Les importations de biens et services de la Bolivie équivalent à 25,5 % de son PIB (2024), contre 23,9 % en 1960. La part la plus élevée a été de 42,0 %, en 2014.
Comparer les importations de la Bolivie avec celles d'autres pays
Sources :
- Banque mondiale | Économie et croissance (1960–2025, mis à jour en octobre 2026)
- TradeMap (2001–2025, mis à jour en octobre 2026)
Creative Commons Attribution (CC BY) : vous pouvez copier, partager, adapter et réutiliser ce contenu, y compris à des fins commerciales, à condition de citer statistics.wiki et d’indiquer les modifications apportées. Les sources citées ci-dessus peuvent avoir leurs propres conditions de licence.