
Importations de biens et services du Brésil par année ($ US), 1960–2025
| Année | $ US | Rang mondial |
|---|---|---|
| Importations | Rang mondial | |
| 2025 | 398 319 353 081 $ US | #24 |
| 2024 | 385 708 868 264 $ US | #23 |
| 2023 | 343 939 883 229 $ US | #24 |
| 2022 | 374 482 483 051 $ US | #22 |
| 2021 | 309 853 308 959 $ US | #23 |
| 2020 | 233 941 246 230 $ US | #24 |
| 2019 | 276 634 813 667 $ US | #23 |
| 2018 | 272 994 464 677 $ US | #24 |
| 2017 | 243 510 584 263 $ US | #25 |
| 2016 | 216 686 387 070 $ US | #25 |
| 2015 | 253 272 712 378 $ US | #22 |
| 2014 | 335 826 230 157 $ US | #19 |
| 2013 | 347 276 016 899 $ US | #19 |
| 2012 | 326 315 660 071 $ US | #20 |
| 2011 | 323 144 804 340 $ US | #19 |
| 2010 | 262 997 327 804 $ US | #19 |
| 2009 | 187 613 855 713 $ US | #21 |
| 2008 | 232 731 840 905 $ US | #20 |
| 2007 | 167 163 857 933 $ US | #25 |
| 2006 | 129 231 037 311 $ US | #28 |
| 2005 | 105 595 891 948 $ US | #28 |
| 2004 | 87 894 373 255 $ US | #28 |
| 2003 | 72 344 866 165 $ US | #28 |
| 2002 | 68 250 204 101 $ US | #26 |
| 2001 | 81 559 232 850 $ US | #22 |
| 2000 | 81 614 535 020 $ US | #21 |
| 1999 | 68 462 738 260 $ US | #22 |
| 1998 | 81 258 638 865 $ US | #20 |
| 1997 | 84 722 079 941 $ US | #20 |
| 1996 | 75 733 720 724 $ US | #23 |
| 1995 | 72 744 940 267 $ US | #23 |
| 1994 | 48 132 687 111 $ US | #24 |
| 1993 | 33 500 023 513 $ US | #28 |
| 1992 | 27 519 098 822 $ US | #33 |
| 1991 | 27 109 659 091 $ US | #30 |
| 1990 | 26 786 900 000 $ US | #31 |
| 1989 | 22 554 535 409 $ US | #29 |
| 1988 | 18 780 447 290 $ US | #29 |
| 1987 | 18 211 637 170 $ US | #25 |
| 1986 | 17 038 985 026 $ US | #26 |
| 1985 | 15 818 492 521 $ US | #26 |
| 1984 | 16 563 864 377 $ US | #27 |
| 1983 | 18 314 364 419 $ US | #24 |
| 1982 | 23 307 743 171 $ US | #20 |
| 1981 | 25 827 534 749 $ US | #19 |
| 1980 | 26 571 483 280 $ US | #16 |
| 1979 | 20 642 227 950 $ US | #18 |
| 1978 | 15 791 774 011 $ US | #19 |
| 1977 | 13 948 797 700 $ US | #19 |
| 1976 | 14 401 534 168 $ US | #17 |
| 1975 | 14 233 481 673 $ US | #15 |
| 1974 | 14 596 797 400 $ US | #13 |
| 1973 | 7 532 763 885 $ US | #16 |
| 1972 | 5 177 234 172 $ US | #17 |
| 1971 | 4 004 245 614 $ US | #18 |
| 1970 | 3 153 304 260 $ US | #19 |
| 1969 | 2 454 948 720 $ US | - |
| 1968 | 2 239 326 015 $ US | - |
| 1967 | 1 764 834 055 $ US | - |
| 1966 | 1 621 508 461 $ US | - |
| 1965 | 1 210 637 974 $ US | - |
| 1964 | 1 204 326 396 $ US | - |
| 1963 | 2 097 486 801 $ US | - |
| 1962 | 1 033 970 196 $ US | - |
| 1961 | 1 118 302 726 $ US | - |
| 1960 | 1 078 651 437 $ US | - |
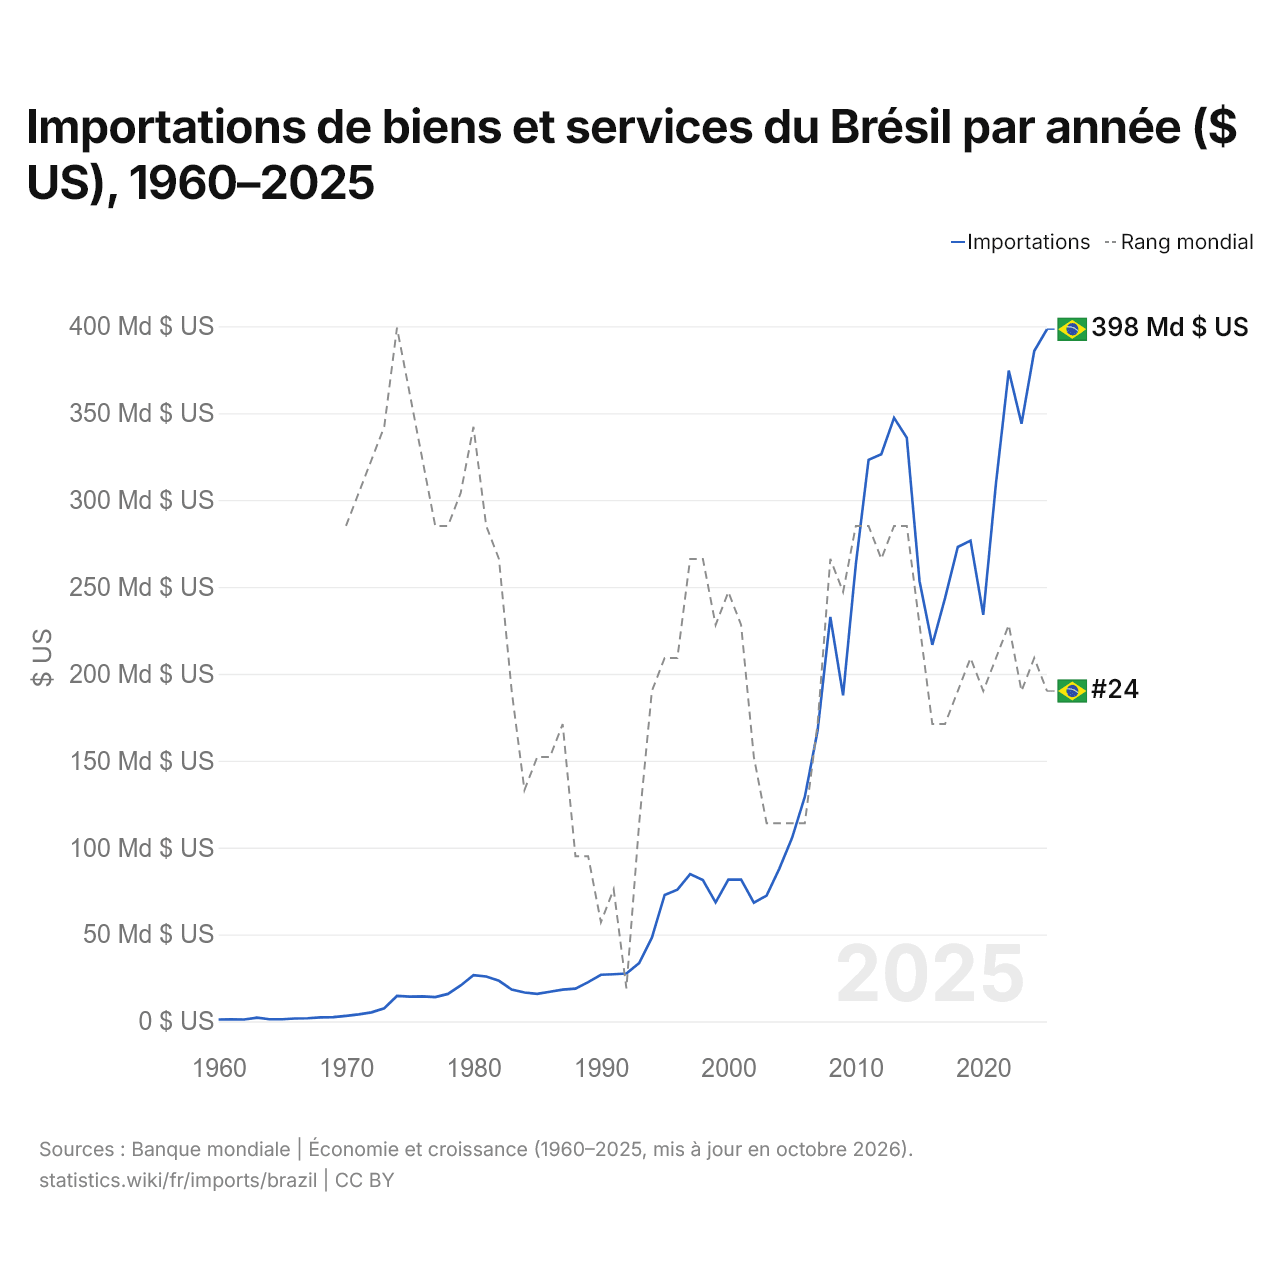
En 2025, les importations de biens et services du Brésil s'élevaient à 398 milliards de dollars, contre 1,08 milliard de dollars en 1960. Le minimum a été de 1,03 milliard de dollars, en 1962. Elles se classaient au 24e rang mondial, en baisse par rapport au 23e rang en 2024. Leur meilleur rang a été le 13e, occupé pour la dernière fois en 1974.
En 2025, les importations de biens et services du Brésil étaient les 2es plus élevées de 26 pays situés en Amérique latine, après celles du Mexique. En 2025, les exportations du Brésil dépassaient ses importations de 7,98 milliards de dollars, soit un excédent commercial. Le commerce du Brésil, exportations et importations réunies, équivalait à 35,3 % de son PIB en 2025, au 160e rang mondial.
Importations de biens du Brésil par catégorie, 2025
Importations de biens, 2025: 280 Md $US
En 2025, la première catégorie des importations de biens du Brésil était « machines, électronique et véhicules », avec 42,9 %, suivie de « pétrole, gaz, minerais et autres matières premières », avec 20,1 %.
Origines des importations de biens du Brésil : les 10 premières, 2025
| Rang | Pays | Importations de biens | Part | |
|---|---|---|---|---|
| 1 |
 Chine |
70,9 Md $US | 25,3 % | vs Chine |
| 2 |
 États-Unis |
46,0 Md $US | 16,4 % | vs USA |
| 3 |
 Allemagne |
14,4 Md $US | 5,14 % | vs Allemagne |
| 4 |
 Argentine |
12,9 Md $US | 4,61 % | vs Argentine |
| 5 |
 Russie |
9,41 Md $US | 3,36 % | vs Russie |
| 6 |
 Inde |
8,35 Md $US | 2,98 % | vs Inde |
| 7 |
 France |
7,21 Md $US | 2,57 % | vs France |
| 8 |
 Italie |
7,07 Md $US | 2,52 % | vs Italie |
| 9 |
 Mexique |
6,22 Md $US | 2,22 % | vs Mexique |
| 10 |
 Japon |
6,05 Md $US | 2,16 % | vs Japon |
| Autres partenaires et non précisés | 91,8 Md $US | 32,7 % |
Importations de biens du Brésil depuis ses 5 principales origines ($ US), 2001–2025
| Année | $ US | ||||
|---|---|---|---|---|---|
| Chine | États-Unis | Allemagne | Argentine | Russie | |
| 2025 | 70 929 742 000 $ US | 45 973 504 000 $ US | 14 407 949 000 $ US | 12 934 608 000 $ US | 9 409 029 000 $ US |
| 2024 | 63 636 346 000 $ US | 41 397 923 000 $ US | 13 783 197 000 $ US | 13 577 045 000 $ US | 10 965 470 000 $ US |
| 2023 | 53 175 757 000 $ US | 38 413 296 000 $ US | 13 147 237 000 $ US | 11 997 507 000 $ US | 10 012 628 000 $ US |
| 2022 | 60 744 585 000 $ US | 51 705 602 000 $ US | 12 806 357 000 $ US | 13 099 915 000 $ US | 7 852 300 000 $ US |
| 2021 | 47 650 946 000 $ US | 39 692 465 000 $ US | 11 346 499 000 $ US | 11 948 896 000 $ US | 5 698 759 000 $ US |
| 2020 | 34 778 441 000 $ US | 28 207 119 000 $ US | 9 369 073 000 $ US | 7 897 096 000 $ US | 2 747 251 000 $ US |
| 2019 | 35 270 401 000 $ US | 30 413 154 000 $ US | 10 280 096 000 $ US | 10 552 254 000 $ US | 3 680 500 000 $ US |
| 2018 | 34 730 027 000 $ US | 29 350 064 000 $ US | 10 557 305 000 $ US | 11 051 063 000 $ US | 3 373 742 000 $ US |
| 2017 | 27 321 484 000 $ US | 25 086 247 000 $ US | 9 227 150 000 $ US | 9 435 192 000 $ US | 2 644 883 000 $ US |
| 2016 | 23 363 995 000 $ US | 24 073 556 000 $ US | 9 130 742 000 $ US | 9 084 494 000 $ US | 2 021 090 000 $ US |
| 2015 | 30 719 405 000 $ US | 26 761 484 000 $ US | 10 379 563 000 $ US | 10 284 589 000 $ US | 2 220 890 000 $ US |
| 2014 | 39 351 981 000 $ US | 36 939 349 000 $ US | 14 324 750 000 $ US | 14 574 262 000 $ US | 3 220 485 000 $ US |
| 2013 | 39 632 452 000 $ US | 37 962 240 000 $ US | 15 738 602 000 $ US | 16 977 425 000 $ US | 2 878 657 000 $ US |
| 2012 | 36 467 431 000 $ US | 34 234 737 000 $ US | 14 718 630 000 $ US | 16 997 932 000 $ US | 2 990 299 000 $ US |
| 2011 | 35 022 851 000 $ US | 35 868 190 000 $ US | 15 776 947 000 $ US | 17 489 815 000 $ US | 3 174 923 000 $ US |
| 2010 | 27 829 290 000 $ US | 28 714 540 000 $ US | 12 988 654 000 $ US | 14 941 275 000 $ US | 2 099 434 000 $ US |
| 2009 | 16 937 000 000 $ US | 21 188 183 000 $ US | 10 150 372 000 $ US | 11 719 597 000 $ US | 1 536 527 000 $ US |
| 2008 | 21 737 742 000 $ US | 27 236 708 000 $ US | 12 463 098 000 $ US | 13 859 239 000 $ US | 3 542 340 000 $ US |
| 2007 | 13 660 897 000 $ US | 19 702 438 000 $ US | 8 979 766 000 $ US | 10 905 822 000 $ US | 1 834 039 000 $ US |
| 2006 | 8 581 338 000 $ US | 15 361 322 000 $ US | 6 724 993 000 $ US | 8 474 135 000 $ US | 1 026 258 000 $ US |
| 2005 | 5 820 711 000 $ US | 13 419 945 000 $ US | 6 361 684 000 $ US | 6 596 074 000 $ US | 805 945 000 $ US |
| 2004 | 4 047 080 000 $ US | 12 079 317 000 $ US | 5 284 809 000 $ US | 5 902 966 000 $ US | 910 580 000 $ US |
| 2003 | 2 326 252 000 $ US | 10 175 264 000 $ US | 4 368 470 000 $ US | 4 949 242 000 $ US | 598 436 000 $ US |
| 2002 | 1 690 790 000 $ US | 10 866 579 000 $ US | 4 603 487 000 $ US | 5 012 686 000 $ US | 460 474 000 $ US |
| 2001 | 1 460 496 000 $ US | 13 568 917 000 $ US | 5 052 170 000 $ US | 6 528 715 000 $ US | 498 550 000 $ US |
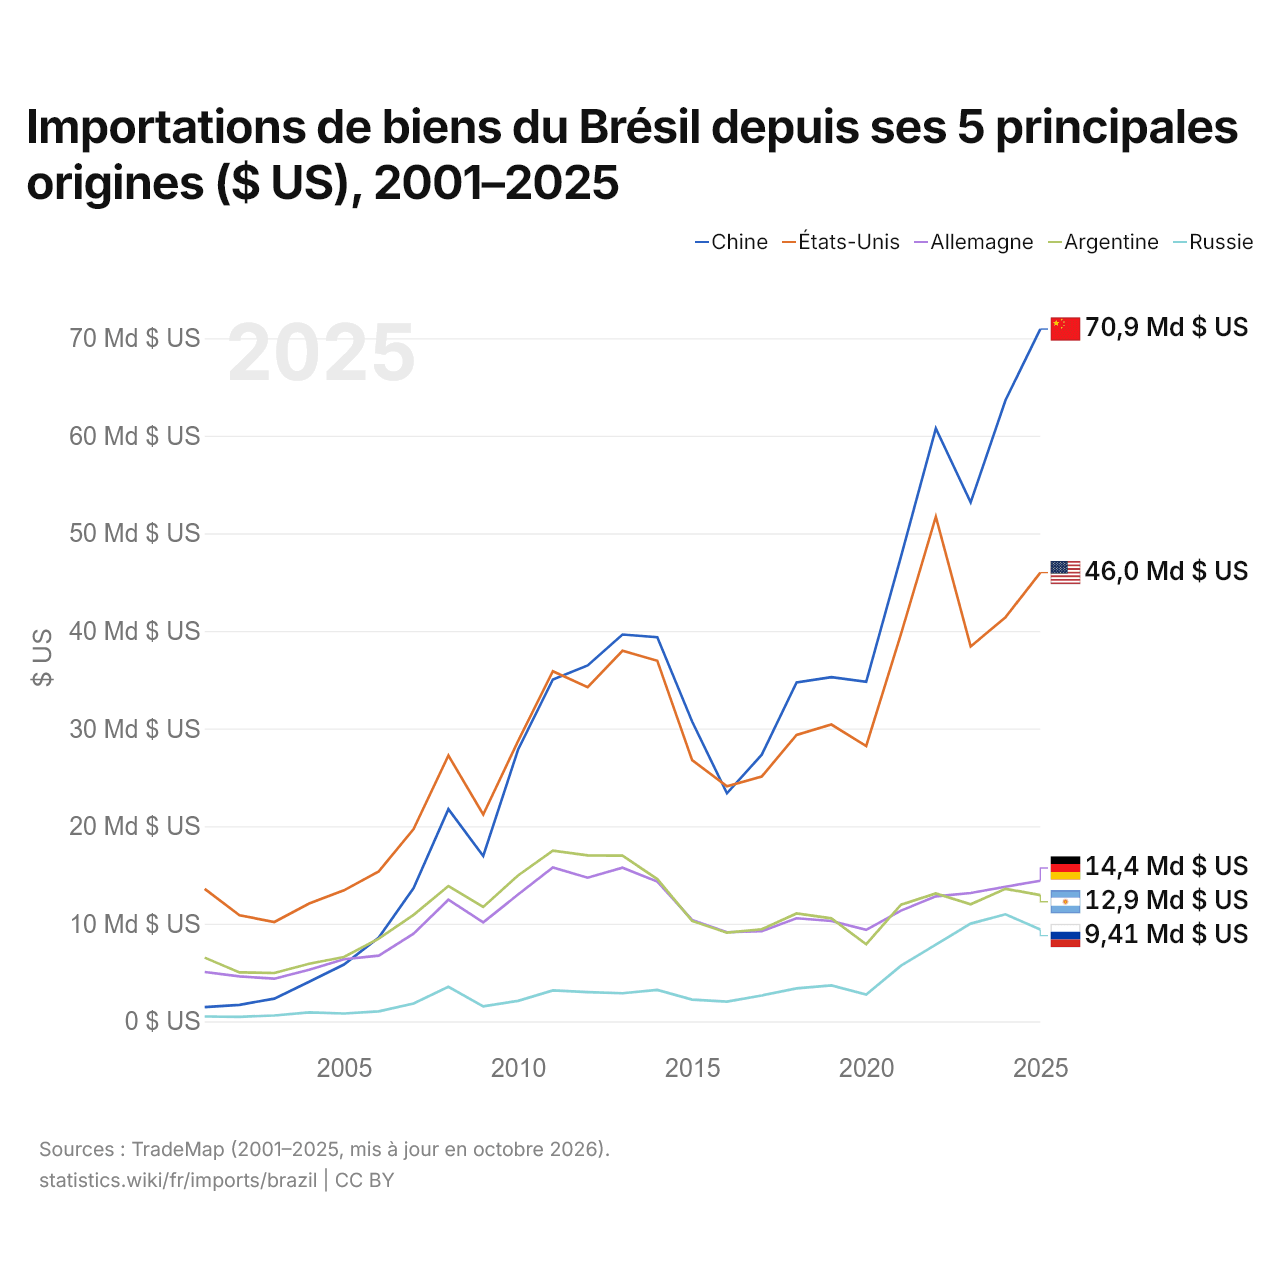
En 2025, les importations de biens s'élevaient à 70,9 milliards de dollars en provenance de la Chine, 46 milliards de dollars en provenance des États-Unis, 14,4 milliards de dollars en provenance de l'Allemagne, 12,9 milliards de dollars en provenance de l'Argentine et 9,41 milliards de dollars en provenance de la Russie. Le premier rang des cinq fournisseurs du Brésil est occupé par la Chine depuis 2017. Le changement le plus récent dans leur ordre remonte à 2023, quand les importations du Brésil en provenance de l'Allemagne ont dépassé celles en provenance de l'Argentine.
Importations de biens et de services du Brésil ($ US), 1975–2025
| Année | $ US | |
|---|---|---|
| Biens | Services | |
| 2025 | 290 772 330 974 $ US | 105 062 326 202 $ US |
| 2024 | 274 014 372 506 $ US | 103 446 668 985 $ US |
| 2023 | 251 543 801 525 $ US | 89 191 424 797 $ US |
| 2022 | 288 679 313 074 $ US | 82 169 713 348 $ US |
| 2021 | 241 652 469 513 $ US | 58 438 818 791 $ US |
| 2020 | 175 026 917 790 $ US | 52 171 019 945 $ US |
| 2019 | 196 225 661 700 $ US | 71 514 059 957 $ US |
| 2018 | 195 169 889 961 $ US | 73 372 063 942 $ US |
| 2017 | 160 601 641 065 $ US | 74 885 706 234 $ US |
| 2016 | 139 722 649 355 $ US | 69 709 687 668 $ US |
| 2015 | 172 469 005 396 $ US | 79 344 622 828 $ US |
| 2014 | 230 710 248 095 $ US | 96 550 493 584 $ US |
| 2013 | 241 142 079 248 $ US | 92 582 975 075 $ US |
| 2012 | 225 074 043 960 $ US | 86 743 703 529 $ US |
| 2011 | 227 877 500 710 $ US | 80 791 503 107 $ US |
| 2010 | 182 839 148 395 $ US | 67 787 693 030 $ US |
| 2009 | 128 734 946 323 $ US | 47 668 974 452 $ US |
| 2008 | 174 707 087 626 $ US | 49 512 301 828 $ US |
| 2007 | 122 041 949 120 $ US | 38 105 043 596 $ US |
| 2006 | 92 531 096 870 $ US | 29 455 720 391 $ US |
| 2005 | 74 692 215 554 $ US | 24 810 057 562 $ US |
| 2004 | 63 813 636 668 $ US | 18 003 234 962 $ US |
| 2003 | 49 307 163 152 $ US | 15 692 722 690 $ US |
| 2002 | 48 274 763 553 $ US | 14 794 488 607 $ US |
| 2001 | 56 569 020 182 $ US | 17 313 048 717 $ US |
| 2000 | 56 976 350 170 $ US | 17 178 159 613 $ US |
| 1999 | 50 259 540 356 $ US | 14 227 396 435 $ US |
| 1998 | 58 672 860 908 $ US | 18 175 911 006 $ US |
| 1997 | 60 537 962 059 $ US | 17 800 190 910 $ US |
| 1996 | 53 301 000 000 $ US | 12 717 000 000 $ US |
| 1995 | 49 663 000 000 $ US | 13 630 000 000 $ US |
| 1994 | 33 241 000 000 $ US | 10 254 000 000 $ US |
| 1993 | 25 301 000 000 $ US | 9 555 000 000 $ US |
| 1992 | 20 554 000 000 $ US | 7 430 000 000 $ US |
| 1991 | 21 041 000 000 $ US | 7 210 000 000 $ US |
| 1990 | 20 661 000 000 $ US | 7 523 000 000 $ US |
| 1989 | 18 263 000 000 $ US | 5 917 000 000 $ US |
| 1988 | 14 605 000 000 $ US | 5 302 000 000 $ US |
| 1987 | 15 052 000 000 $ US | 4 316 000 000 $ US |
| 1986 | 14 044 000 000 $ US | 4 389 000 000 $ US |
| 1985 | 13 168 000 000 $ US | 3 790 000 000 $ US |
| 1984 | 13 916 000 000 $ US | 3 696 000 000 $ US |
| 1983 | 15 429 000 000 $ US | 4 131 000 000 $ US |
| 1982 | 19 395 000 000 $ US | 5 397 000 000 $ US |
| 1981 | 22 091 000 000 $ US | 5 138 000 000 $ US |
| 1980 | 22 955 000 000 $ US | 4 871 000 000 $ US |
| 1979 | 17 961 000 000 $ US | 3 799 000 000 $ US |
| 1978 | 13 631 000 000 $ US | 3 074 000 000 $ US |
| 1977 | 12 023 000 000 $ US | 2 793 000 000 $ US |
| 1976 | 12 347 000 000 $ US | 2 603 000 000 $ US |
| 1975 | 12 042 000 000 $ US | 2 504 000 000 $ US |
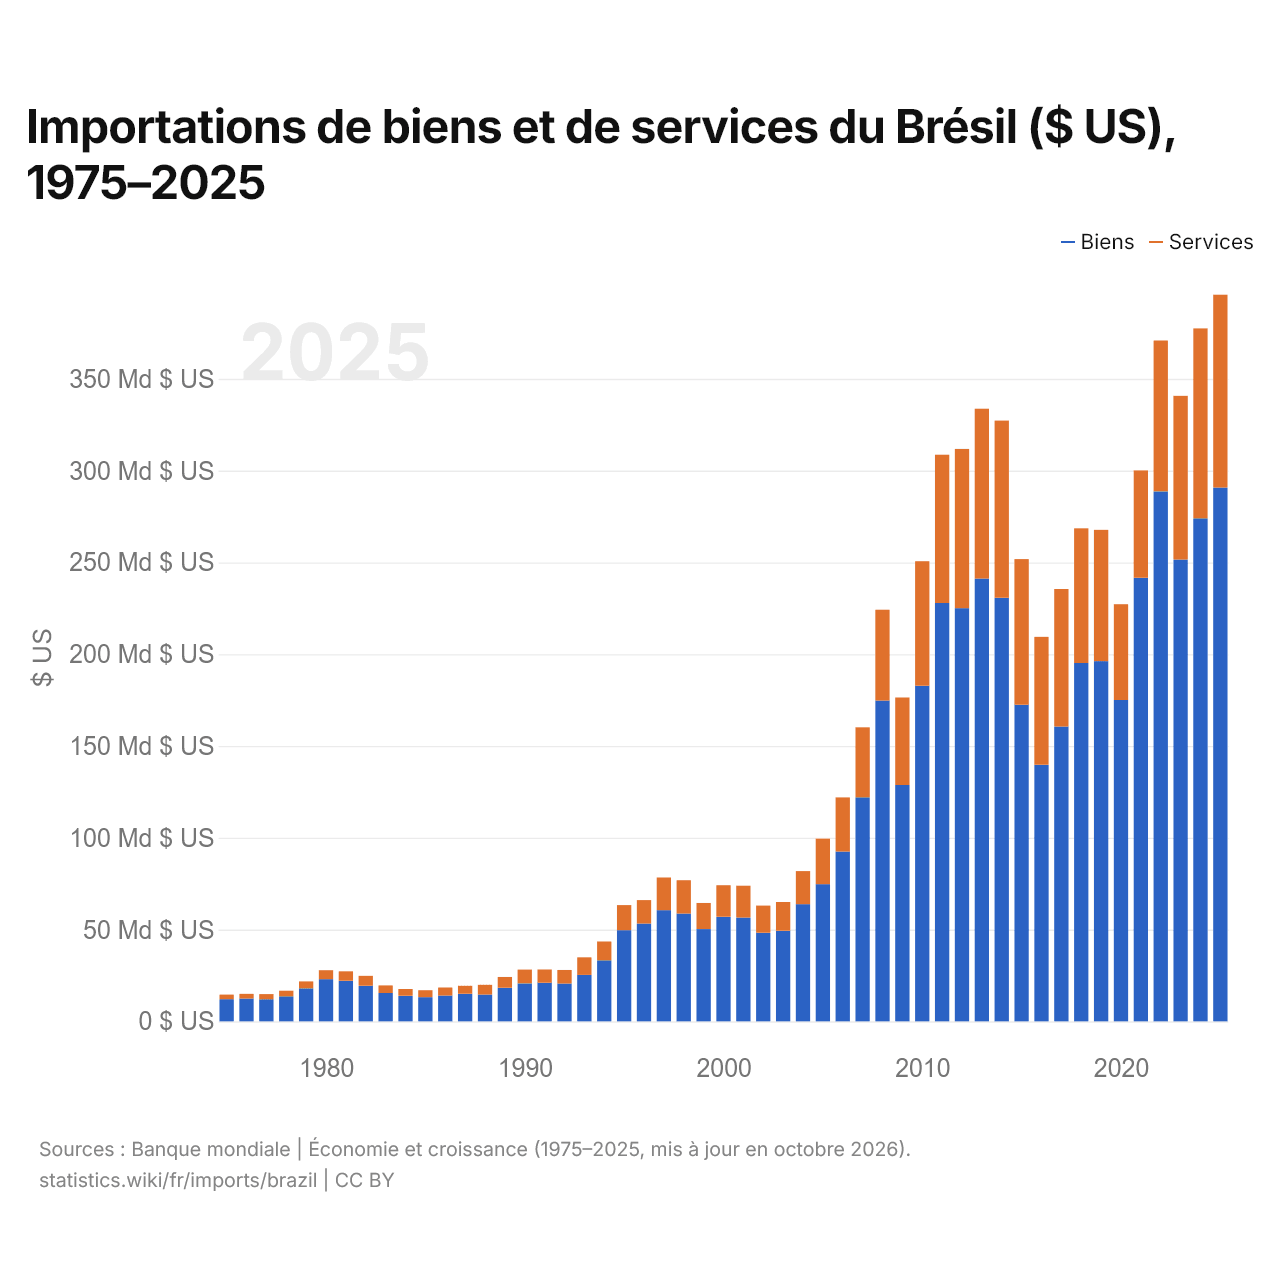
En 2025, les importations de biens du Brésil s'élevaient à 291 milliards de dollars et celles de services à 105 milliards de dollars ; les services représentaient 26,5 % du total, contre 17,2 % en 1975.
Le Brésil dans le classement mondial des importations, 2025
| Rang | Pays | Importations | Part mondiale | |
|---|---|---|---|---|
| 21 |
 Vietnam |
474 Md $US | 1,41 % | |
| 22 |
 Australie |
407 Md $US | 1,21 % | vs Australie |
| 23 |
 Turquie |
401 Md $US | 1,19 % | vs Turquie |
| 24 |
 Brésil |
398 Md $US | 1,18 % | |
| 25 |
Russie
|
397 Md $US | 1,18 % | vs Russie |
| 26 |
 Thaïlande |
388 Md $US | 1,15 % | vs Thaïlande |
| 27 |
 Arabie saoudite |
360 Md $US | 1,07 % |
Importations de biens et services du Brésil, % du PIB, 1960–2025
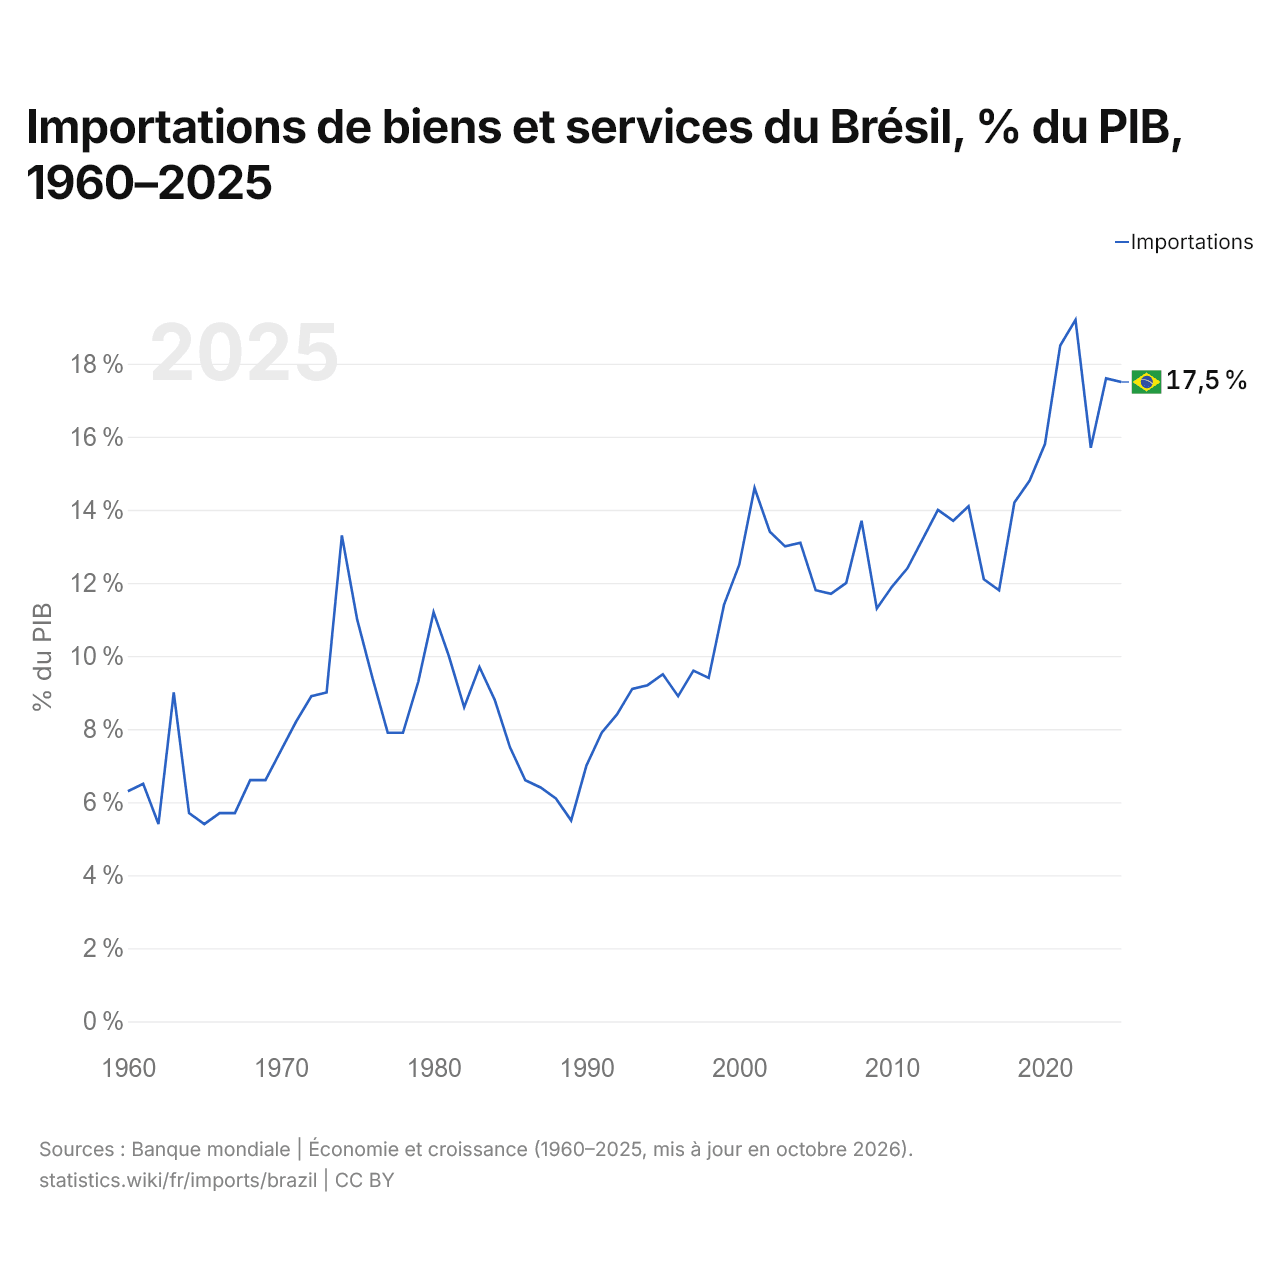
En 2025, les importations de biens et services du Brésil équivalaient à 17,5 % de son PIB, contre 6,3 % en 1960. La part la plus élevée a été de 19,2 %, en 2022.
Comparer les importations du Brésil avec celles d'autres pays
Sources :
- TradeMap (2001–2025, mis à jour en octobre 2026)
- Banque mondiale | Économie et croissance (1960–2025, mis à jour en octobre 2026)
Creative Commons Attribution (CC BY) : vous pouvez copier, partager, adapter et réutiliser ce contenu, y compris à des fins commerciales, à condition de citer statistics.wiki et d’indiquer les modifications apportées. Les sources citées ci-dessus peuvent avoir leurs propres conditions de licence.