
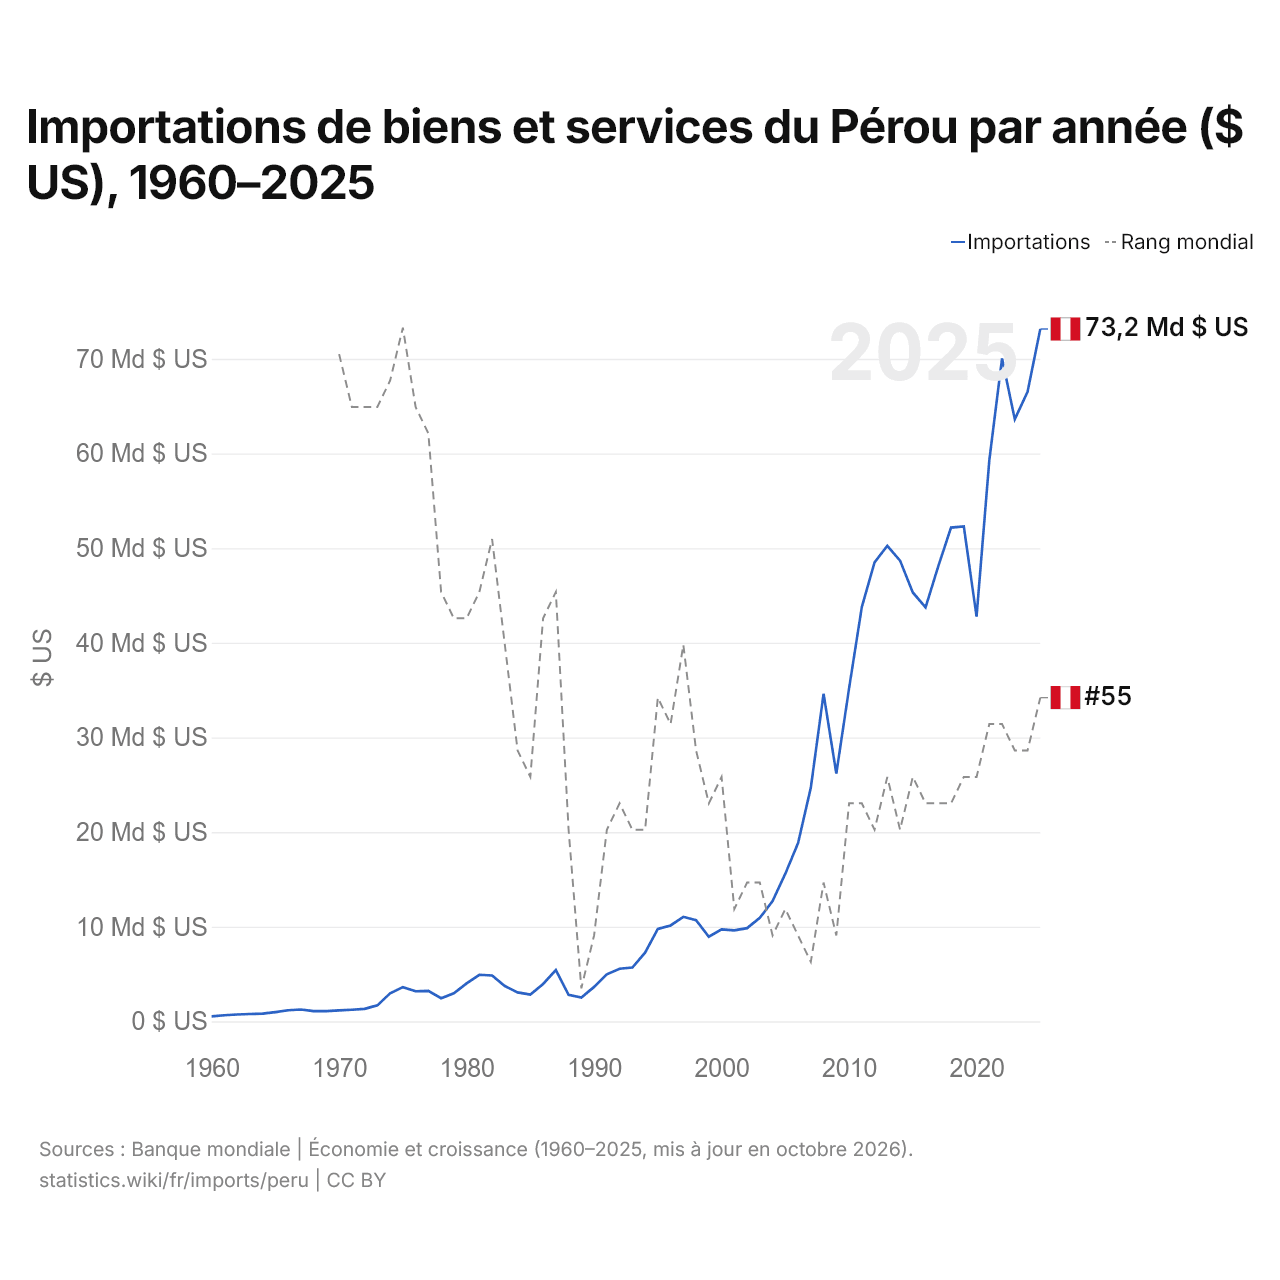
Importations de biens et services du Pérou par année ($ US), 1960–2025
| Année | $ US | Rang mondial |
|---|---|---|
| Importations | Rang mondial | |
| 2025 | 73 151 196 614 $ US | #55 |
| 2024 | 66 511 219 153 $ US | #57 |
| 2023 | 63 620 745 195 $ US | #57 |
| 2022 | 70 042 848 043 $ US | #56 |
| 2021 | 59 278 649 389 $ US | #56 |
| 2020 | 42 768 390 082 $ US | #58 |
| 2019 | 52 301 323 566 $ US | #58 |
| 2018 | 52 175 148 626 $ US | #59 |
| 2017 | 48 096 481 263 $ US | #59 |
| 2016 | 43 730 752 205 $ US | #59 |
| 2015 | 45 316 302 181 $ US | #58 |
| 2014 | 48 682 936 932 $ US | #60 |
| 2013 | 50 251 323 236 $ US | #58 |
| 2012 | 48 490 551 588 $ US | #60 |
| 2011 | 43 774 372 753 $ US | #59 |
| 2010 | 35 180 390 248 $ US | #59 |
| 2009 | 26 182 192 418 $ US | #64 |
| 2008 | 34 605 420 554 $ US | #62 |
| 2007 | 24 690 635 986 $ US | #65 |
| 2006 | 18 835 277 591 $ US | #64 |
| 2005 | 15 598 932 266 $ US | #63 |
| 2004 | 12 701 974 339 $ US | #64 |
| 2003 | 10 929 811 451 $ US | #62 |
| 2002 | 9 845 922 051 $ US | #62 |
| 2001 | 9 606 339 614 $ US | #63 |
| 2000 | 9 712 312 674 $ US | #58 |
| 1999 | 8 937 804 698 $ US | #59 |
| 1998 | 10 684 099 133 $ US | #57 |
| 1997 | 11 043 543 544 $ US | #53 |
| 1996 | 10 132 013 201 $ US | #56 |
| 1995 | 9 770 813 015 $ US | #55 |
| 1994 | 7 249 134 948 $ US | #60 |
| 1993 | 5 683 170 881 $ US | #60 |
| 1992 | 5 561 752 159 $ US | #59 |
| 1991 | 4 964 700 219 $ US | #60 |
| 1990 | 3 637 366 699 $ US | #64 |
| 1989 | 2 521 553 466 $ US | #66 |
| 1988 | 2 797 976 000 $ US | #60 |
| 1987 | 5 417 433 054 $ US | #51 |
| 1986 | 3 950 815 558 $ US | #52 |
| 1985 | 2 824 798 399 $ US | #58 |
| 1984 | 3 057 815 383 $ US | #57 |
| 1983 | 3 729 505 450 $ US | #53 |
| 1982 | 4 849 715 099 $ US | #49 |
| 1981 | 4 918 094 895 $ US | #51 |
| 1980 | 4 012 390 289 $ US | #52 |
| 1979 | 2 964 592 488 $ US | #52 |
| 1978 | 2 439 416 948 $ US | #51 |
| 1977 | 3 217 196 370 $ US | #45 |
| 1976 | 3 176 349 370 $ US | #44 |
| 1975 | 3 616 472 288 $ US | #41 |
| 1974 | 2 958 656 331 $ US | #43 |
| 1973 | 1 687 338 580 $ US | #44 |
| 1972 | 1 322 997 436 $ US | #44 |
| 1971 | 1 224 806 241 $ US | #44 |
| 1970 | 1 157 622 719 $ US | #42 |
| 1969 | 1 080 103 339 $ US | - |
| 1968 | 1 082 687 378 $ US | - |
| 1967 | 1 249 655 603 $ US | - |
| 1966 | 1 170 768 069 $ US | - |
| 1965 | 980 611 456 $ US | - |
| 1964 | 818 467 051 $ US | - |
| 1963 | 776 482 909 $ US | - |
| 1962 | 721 234 799 $ US | - |
| 1961 | 643 328 376 $ US | - |
| 1960 | 521 357 001 $ US | - |
En 2025, les importations de biens et services du Pérou s'élevaient à 73,2 milliards de dollars, contre 521 millions de dollars en 1960. Elles se classaient au 55e rang mondial, en hausse par rapport au 57e rang en 2024. Leur meilleur rang a été le 41e, occupé pour la dernière fois en 1975.
En 2025, les importations de biens et services du Pérou étaient les 6es plus élevées de 26 pays situés en Amérique latine. En 2025, les exportations du Pérou dépassaient ses importations de 27,2 milliards de dollars, soit un excédent commercial. Le commerce du Pérou, exportations et importations réunies, équivalait à 51,8 % de son PIB en 2025, au 130e rang mondial.
Importations de biens du Pérou par catégorie, 2025
Importations de biens, 2025: 61,0 Md $US
En 2025, la première catégorie des importations de biens du Pérou était « machines, électronique et véhicules », avec 34,7 %, suivie de « pétrole, gaz, minerais et autres matières premières », avec 20,1 %.
Origines des importations de biens du Pérou : les 10 premières, 2025
| Rang | Pays | Importations de biens | Part | |
|---|---|---|---|---|
| 1 |
 Chine |
19,0 Md $US | 31,2 % | |
| 2 |
 États-Unis |
10,9 Md $US | 18 % | |
| 3 |
 Brésil |
3,54 Md $US | 5,8 % | |
| 4 |
 Argentine |
3,00 Md $US | 4,92 % | vs Argentine |
| 5 |
 Colombie |
2,06 Md $US | 3,38 % | vs Colombie |
| 6 |
 Mexique |
1,67 Md $US | 2,73 % | vs Mexique |
| 7 |
 Allemagne |
1,39 Md $US | 2,28 % | |
| 8 |
 Inde |
1,39 Md $US | 2,28 % | |
| 9 |
 Équateur |
1,38 Md $US | 2,27 % | vs Équateur |
| 10 |
 Chili |
1,32 Md $US | 2,17 % | vs Chili |
| Autres partenaires et non précisés | 15,2 Md $US | 25 % |
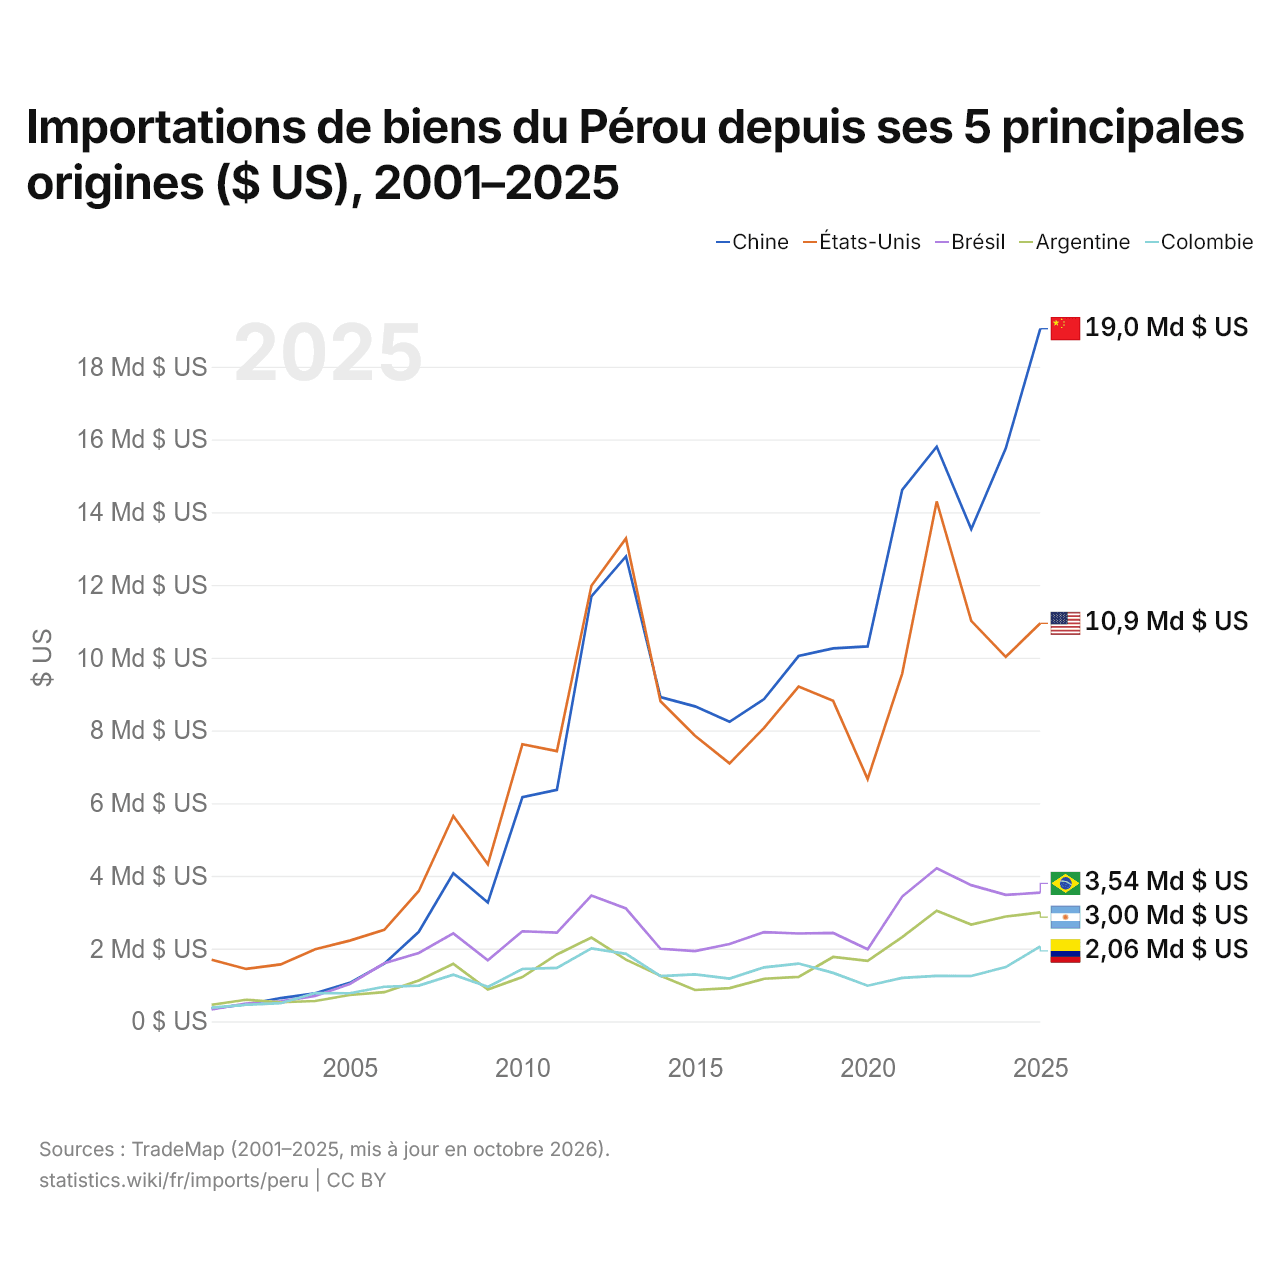
Importations de biens du Pérou depuis ses 5 principales origines ($ US), 2001–2025
| Année | $ US | ||||
|---|---|---|---|---|---|
| Chine | États-Unis | Brésil | Argentine | Colombie | |
| 2025 | 19 045 060 000 $ US | 10 943 335 000 $ US | 3 536 890 000 $ US | 2 997 415 000 $ US | 2 061 839 000 $ US |
| 2024 | 15 754 237 000 $ US | 10 022 895 000 $ US | 3 476 479 000 $ US | 2 881 558 000 $ US | 1 491 414 000 $ US |
| 2023 | 13 533 579 000 $ US | 11 011 558 000 $ US | 3 744 450 000 $ US | 2 661 349 000 $ US | 1 247 271 000 $ US |
| 2022 | 15 801 093 000 $ US | 14 295 569 000 $ US | 4 207 252 000 $ US | 3 042 162 000 $ US | 1 249 455 000 $ US |
| 2021 | 14 611 643 000 $ US | 9 562 256 000 $ US | 3 430 911 000 $ US | 2 313 802 000 $ US | 1 193 521 000 $ US |
| 2020 | 10 310 219 000 $ US | 6 661 440 000 $ US | 1 982 016 000 $ US | 1 665 493 000 $ US | 979 540 000 $ US |
| 2019 | 10 255 204 000 $ US | 8 811 480 000 $ US | 2 429 905 000 $ US | 1 769 451 000 $ US | 1 332 330 000 $ US |
| 2018 | 10 044 887 000 $ US | 9 204 681 000 $ US | 2 414 395 000 $ US | 1 223 485 000 $ US | 1 588 814 000 $ US |
| 2017 | 8 861 241 000 $ US | 8 070 160 000 $ US | 2 452 729 000 $ US | 1 170 639 000 $ US | 1 482 458 000 $ US |
| 2016 | 8 235 308 000 $ US | 7 092 639 000 $ US | 2 127 055 000 $ US | 912 523 000 $ US | 1 176 473 000 $ US |
| 2015 | 8 660 462 000 $ US | 7 853 500 000 $ US | 1 931 717 000 $ US | 862 184 000 $ US | 1 292 182 000 $ US |
| 2014 | 8 914 608 000 $ US | 8 799 923 000 $ US | 1 994 461 000 $ US | 1 250 619 000 $ US | 1 243 530 000 $ US |
| 2013 | 12 784 565 000 $ US | 13 278 428 000 $ US | 3 102 279 000 $ US | 1 695 816 000 $ US | 1 856 520 000 $ US |
| 2012 | 11 687 132 000 $ US | 11 975 360 000 $ US | 3 457 370 000 $ US | 2 304 495 000 $ US | 2 005 694 000 $ US |
| 2011 | 6 364 754 000 $ US | 7 429 787 000 $ US | 2 439 665 000 $ US | 1 839 605 000 $ US | 1 467 712 000 $ US |
| 2010 | 6 162 458 000 $ US | 7 618 122 000 $ US | 2 477 115 000 $ US | 1 218 325 000 $ US | 1 438 522 000 $ US |
| 2009 | 3 266 503 000 $ US | 4 315 354 000 $ US | 1 680 677 000 $ US | 874 811 000 $ US | 947 225 000 $ US |
| 2008 | 4 069 490 000 $ US | 5 647 494 000 $ US | 2 417 838 000 $ US | 1 581 999 000 $ US | 1 282 953 000 $ US |
| 2007 | 2 462 958 000 $ US | 3 584 155 000 $ US | 1 879 292 000 $ US | 1 123 269 000 $ US | 983 565 000 $ US |
| 2006 | 1 583 656 000 $ US | 2 515 691 000 $ US | 1 597 224 000 $ US | 802 374 000 $ US | 950 688 000 $ US |
| 2005 | 1 057 932 000 $ US | 2 220 133 000 $ US | 1 028 360 000 $ US | 724 497 000 $ US | 772 644 000 $ US |
| 2004 | 768 124 000 $ US | 1 981 512 000 $ US | 698 456 000 $ US | 560 110 000 $ US | 779 439 000 $ US |
| 2003 | 639 980 000 $ US | 1 565 757 000 $ US | 549 379 000 $ US | 525 502 000 $ US | 498 671 000 $ US |
| 2002 | 463 439 000 $ US | 1 440 472 000 $ US | 489 461 000 $ US | 593 685 000 $ US | 456 494 000 $ US |
| 2001 | 353 626 000 $ US | 1 691 491 000 $ US | 327 707 000 $ US | 455 022 000 $ US | 378 566 000 $ US |
En 2025, les importations de biens s'élevaient à 19 milliards de dollars en provenance de la Chine, 10,9 milliards de dollars en provenance des États-Unis, 3,54 milliards de dollars en provenance du Brésil, 3 milliards de dollars en provenance de l'Argentine et 2,06 milliards de dollars en provenance de la Colombie. Le premier rang des cinq fournisseurs du Pérou est occupé par la Chine depuis 2014. Le changement le plus récent dans leur ordre remonte à 2019, quand les importations du Pérou en provenance de l'Argentine ont dépassé celles en provenance de la Colombie.
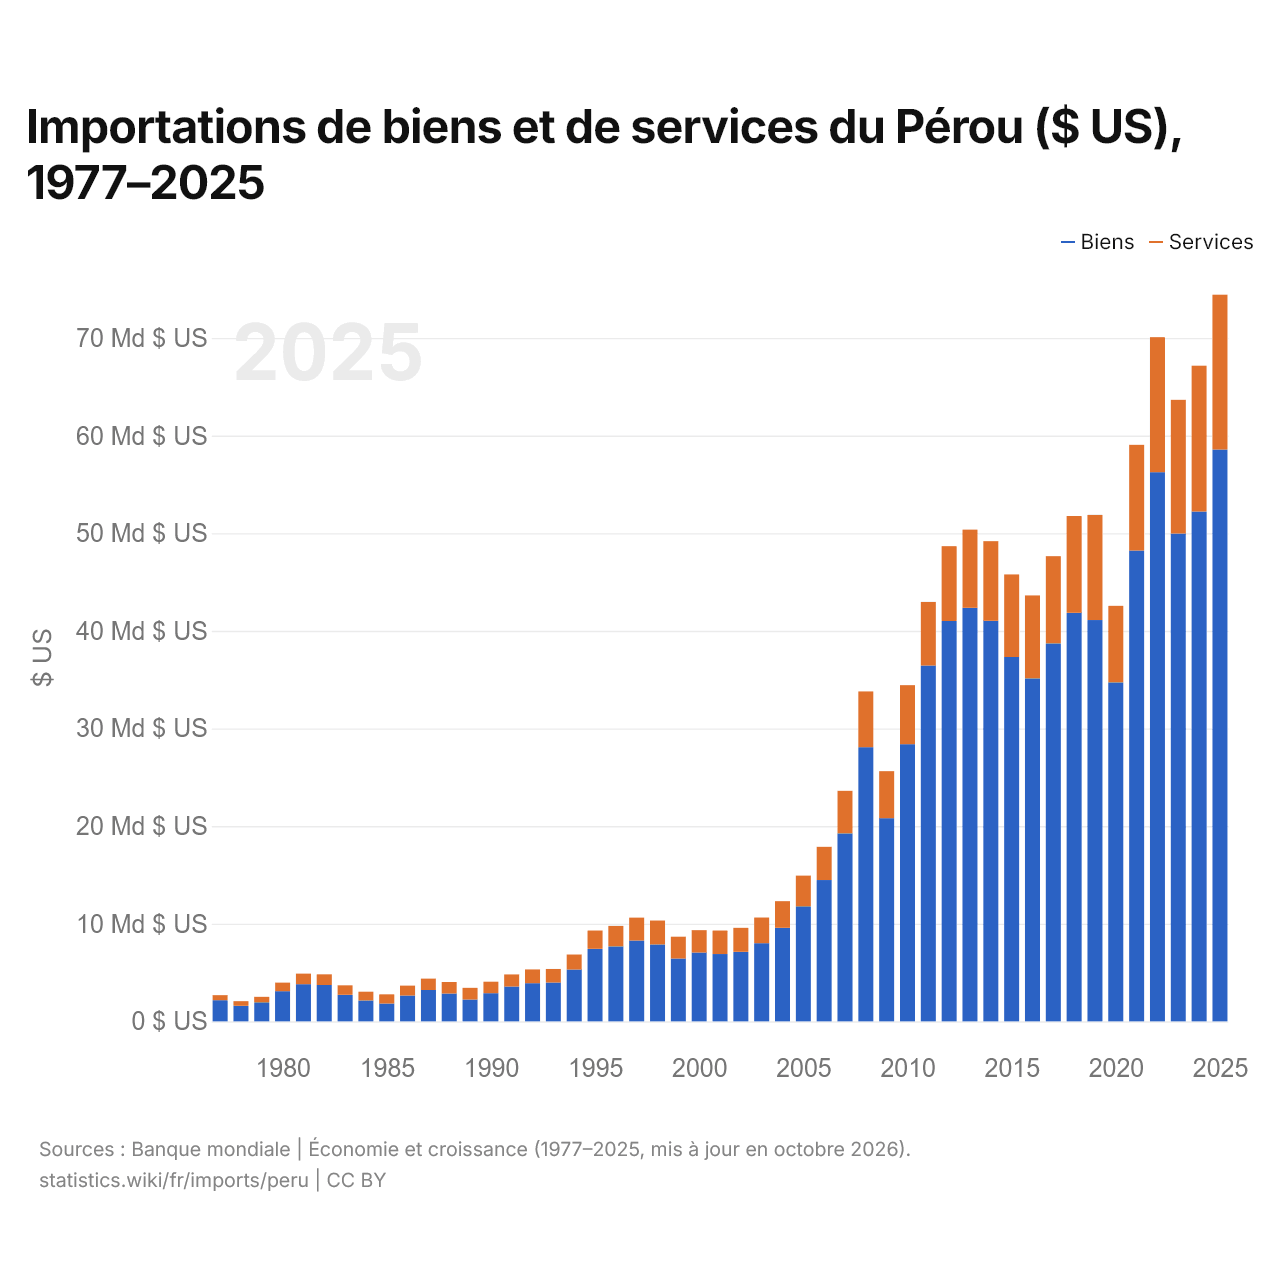
Importations de biens et de services du Pérou ($ US), 1977–2025
| Année | $ US | |
|---|---|---|
| Biens | Services | |
| 2025 | 58 560 344 634 $ US | 15 873 421 015 $ US |
| 2024 | 52 212 672 060 $ US | 14 942 655 936 $ US |
| 2023 | 49 957 667 336 $ US | 13 705 499 586 $ US |
| 2022 | 56 245 123 827 $ US | 13 829 267 099 $ US |
| 2021 | 48 220 341 796 $ US | 10 831 130 927 $ US |
| 2020 | 34 723 999 957 $ US | 7 832 223 835 $ US |
| 2019 | 41 102 327 158 $ US | 10 772 238 475 $ US |
| 2018 | 41 857 222 150 $ US | 9 900 003 750 $ US |
| 2017 | 38 718 555 955 $ US | 8 924 738 808 $ US |
| 2016 | 35 126 016 123 $ US | 8 504 663 640 $ US |
| 2015 | 37 326 458 938 $ US | 8 448 381 911 $ US |
| 2014 | 41 037 808 511 $ US | 8 149 498 533 $ US |
| 2013 | 42 350 814 214 $ US | 8 014 983 684 $ US |
| 2012 | 41 014 525 377 $ US | 7 652 904 040 $ US |
| 2011 | 36 448 776 805 $ US | 6 512 429 466 $ US |
| 2010 | 28 391 271 228 $ US | 6 050 070 699 $ US |
| 2009 | 20 808 084 071 $ US | 4 817 683 319 $ US |
| 2008 | 28 078 161 332 $ US | 5 714 832 958 $ US |
| 2007 | 19 257 946 576 $ US | 4 354 526 759 $ US |
| 2006 | 14 468 113 512 $ US | 3 408 395 348 $ US |
| 2005 | 11 782 184 510 $ US | 3 147 395 415 $ US |
| 2004 | 9 582 510 666 $ US | 2 733 715 012 $ US |
| 2003 | 8 010 809 634 $ US | 2 622 023 744 $ US |
| 2002 | 7 116 971 796 $ US | 2 459 692 765 $ US |
| 2001 | 6 893 554 115 $ US | 2 404 523 781 $ US |
| 2000 | 7 046 877 429 $ US | 2 295 594 803 $ US |
| 1999 | 6 440 563 648 $ US | 2 226 421 231 $ US |
| 1998 | 7 877 174 408 $ US | 2 453 296 076 $ US |
| 1997 | 8 271 791 463 $ US | 2 349 766 284 $ US |
| 1996 | 7 682 342 841 $ US | 2 094 626 263 $ US |
| 1995 | 7 422 812 071 $ US | 1 874 965 758 $ US |
| 1994 | 5 307 377 197 $ US | 1 541 371 049 $ US |
| 1993 | 3 971 524 864 $ US | 1 392 686 063 $ US |
| 1992 | 3 900 000 000 $ US | 1 420 000 000 $ US |
| 1991 | 3 562 000 000 $ US | 1 242 000 000 $ US |
| 1990 | 2 889 000 000 $ US | 1 170 000 000 $ US |
| 1989 | 2 233 190 000 $ US | 1 196 400 000 $ US |
| 1988 | 2 854 070 000 $ US | 1 175 110 000 $ US |
| 1987 | 3 215 080 000 $ US | 1 163 670 000 $ US |
| 1986 | 2 649 290 000 $ US | 1 012 520 000 $ US |
| 1985 | 1 830 000 000 $ US | 934 000 000 $ US |
| 1984 | 2 140 000 000 $ US | 890 900 000 $ US |
| 1983 | 2 722 000 000 $ US | 965 000 000 $ US |
| 1982 | 3 721 000 000 $ US | 1 098 000 000 $ US |
| 1981 | 3 802 000 000 $ US | 1 087 000 000 $ US |
| 1980 | 3 090 000 000 $ US | 879 700 000 $ US |
| 1979 | 1 951 300 000 $ US | 559 900 000 $ US |
| 1978 | 1 600 500 000 $ US | 469 600 000 $ US |
| 1977 | 2 164 000 000 $ US | 523 200 000 $ US |
En 2025, les importations de biens du Pérou s'élevaient à 58,6 milliards de dollars et celles de services à 15,9 milliards de dollars ; les services représentaient 21,3 % du total, contre 19,5 % en 1977.
Le Pérou dans le classement mondial des importations, 2025
| Rang | Pays | Importations | Part mondiale | |
|---|---|---|---|---|
| 52 |
Colombie
|
93,2 Md $US | 0,28 % | vs Colombie |
| 53 |
 Kazakhstan |
80,3 Md $US | 0,24 % | |
| 54 |
 Bangladesh |
76,8 Md $US | 0,23 % | |
| 55 |
 Pérou |
73,2 Md $US | 0,22 % | |
| 56 |
 Pakistan |
70,1 Md $US | 0,21 % | |
| 57 |
 Nouvelle-Zélande |
68,4 Md $US | 0,2 % | |
| 58 |
 Bulgarie |
67,7 Md $US | 0,2 % |
Importations de biens et services du Pérou, % du PIB, 1960–2025
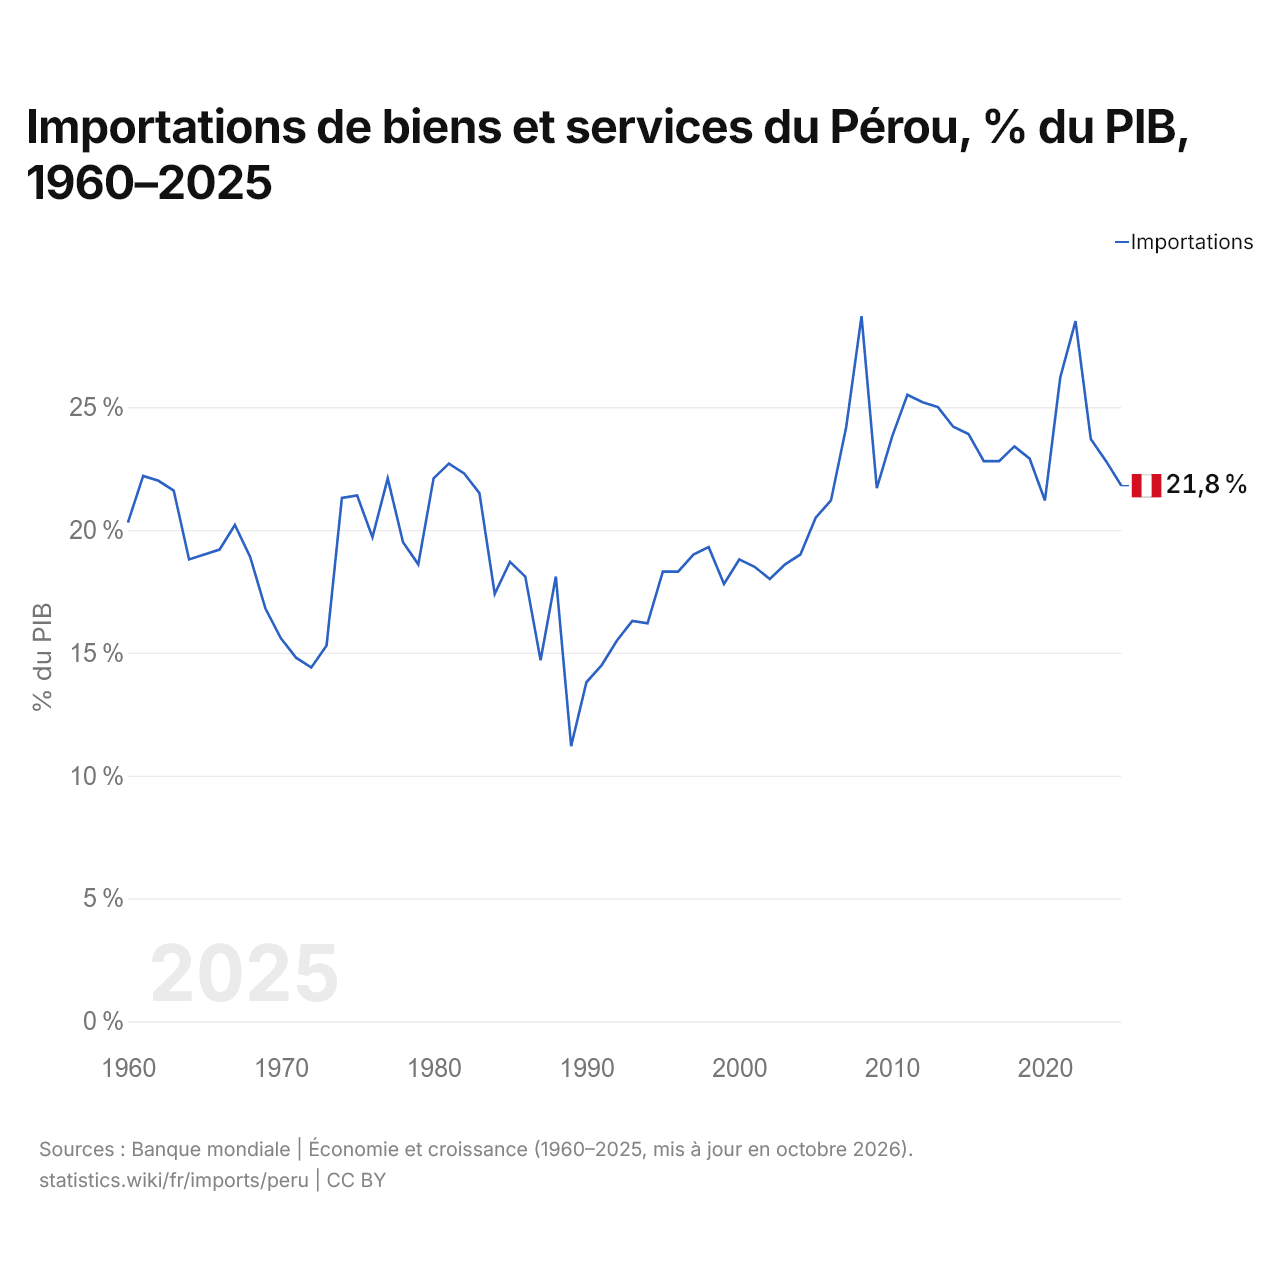
En 2025, les importations de biens et services du Pérou équivalaient à 21,8 % de son PIB, contre 20,3 % en 1960. La part la plus élevée a été de 28,7 %, en 2008.
Comparer les importations du Pérou avec celles d'autres pays
Sources :
- Banque mondiale | Économie et croissance (1960–2025, mis à jour en octobre 2026)
- TradeMap (2001–2025, mis à jour en octobre 2026)
Creative Commons Attribution (CC BY) : vous pouvez copier, partager, adapter et réutiliser ce contenu, y compris à des fins commerciales, à condition de citer statistics.wiki et d’indiquer les modifications apportées. Les sources citées ci-dessus peuvent avoir leurs propres conditions de licence.