
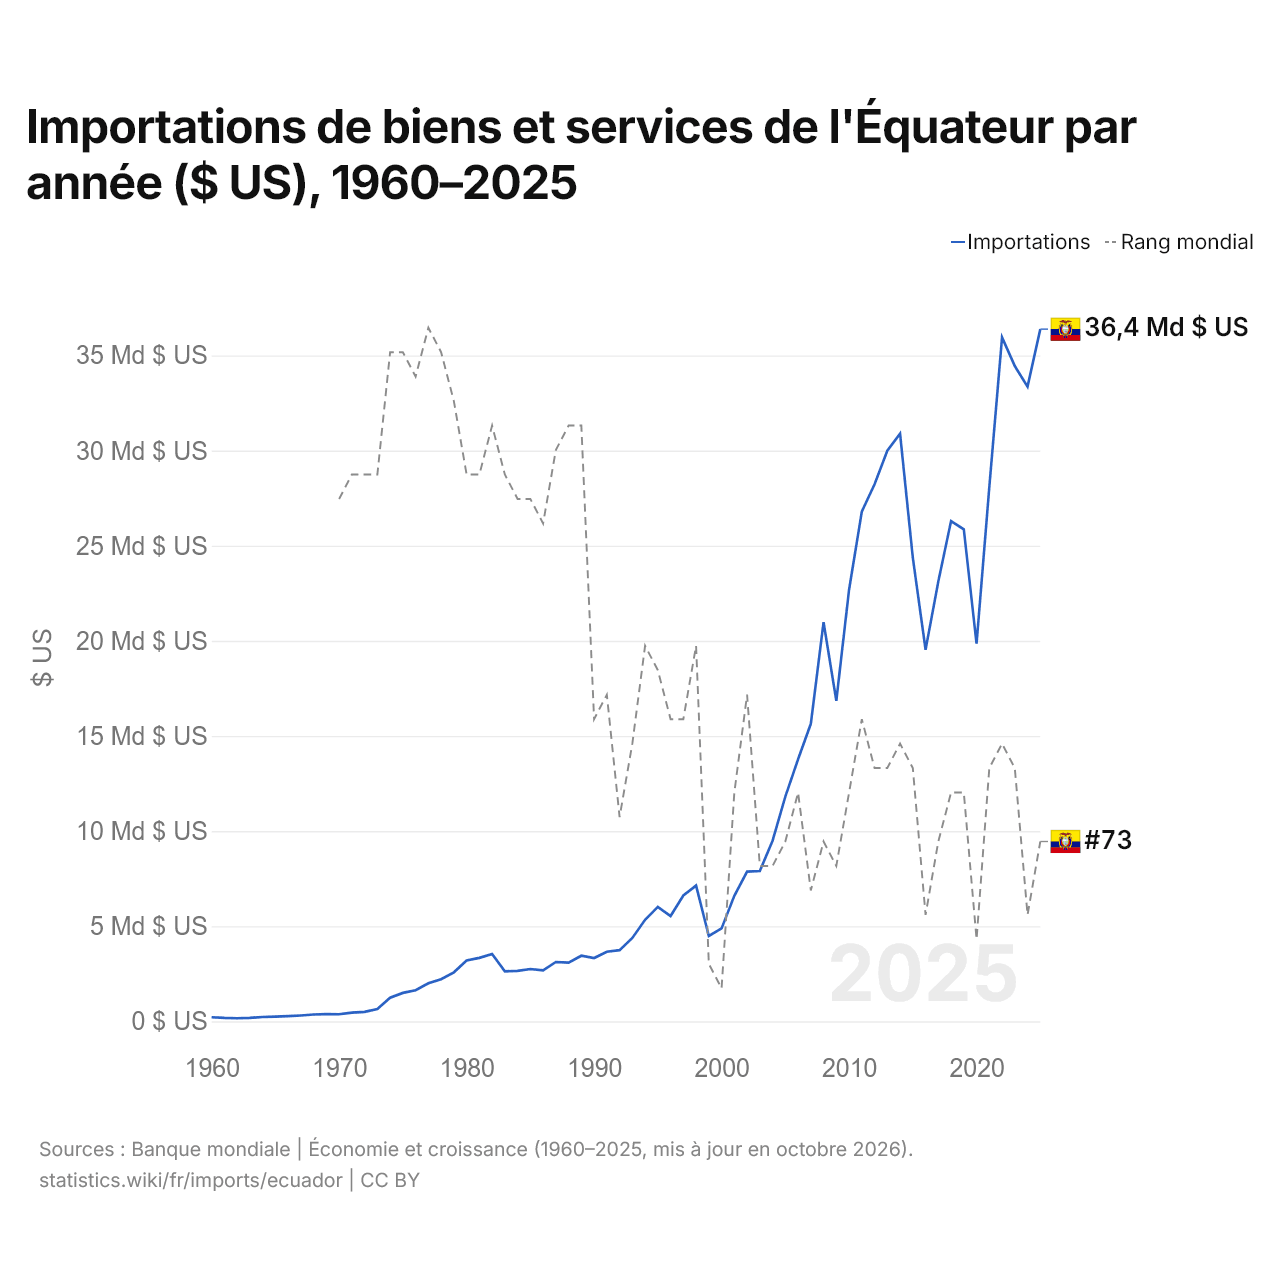
Importations de biens et services de l'Équateur par année ($ US), 1960–2025
| Année | $ US | Rang mondial |
|---|---|---|
| Importations | Rang mondial | |
| 2025 | 36 383 153 500 $ US | #73 |
| 2024 | 33 359 499 000 $ US | #76 |
| 2023 | 34 441 841 000 $ US | #70 |
| 2022 | 35 949 643 000 $ US | #69 |
| 2021 | 28 075 880 000 $ US | #70 |
| 2020 | 19 849 664 000 $ US | #77 |
| 2019 | 25 859 813 000 $ US | #71 |
| 2018 | 26 295 241 000 $ US | #71 |
| 2017 | 23 120 886 000 $ US | #73 |
| 2016 | 19 529 599 000 $ US | #76 |
| 2015 | 24 373 891 000 $ US | #70 |
| 2014 | 30 888 617 000 $ US | #69 |
| 2013 | 29 992 847 000 $ US | #70 |
| 2012 | 28 225 697 000 $ US | #70 |
| 2011 | 26 794 099 000 $ US | #68 |
| 2010 | 22 688 729 000 $ US | #71 |
| 2009 | 16 849 260 000 $ US | #74 |
| 2008 | 20 979 384 000 $ US | #73 |
| 2007 | 15 636 624 000 $ US | #75 |
| 2006 | 13 771 502 000 $ US | #71 |
| 2005 | 11 814 190 000 $ US | #73 |
| 2004 | 9 493 787 000 $ US | #74 |
| 2003 | 7 901 011 000 $ US | #74 |
| 2002 | 7 867 963 000 $ US | #67 |
| 2001 | 6 596 149 000 $ US | #71 |
| 2000 | 4 885 305 653 $ US | #79 |
| 1999 | 4 483 779 890 $ US | #78 |
| 1998 | 7 136 267 134 $ US | #65 |
| 1997 | 6 613 086 543 $ US | #68 |
| 1996 | 5 535 280 640 $ US | #68 |
| 1995 | 6 016 443 222 $ US | #66 |
| 1994 | 5 336 068 034 $ US | #65 |
| 1993 | 4 381 543 772 $ US | #69 |
| 1992 | 3 740 586 293 $ US | #72 |
| 1991 | 3 656 282 141 $ US | #67 |
| 1990 | 3 326 815 545 $ US | #68 |
| 1989 | 3 449 082 110 $ US | #56 |
| 1988 | 3 087 611 966 $ US | #56 |
| 1987 | 3 118 843 926 $ US | #57 |
| 1986 | 2 677 095 329 $ US | #60 |
| 1985 | 2 750 017 258 $ US | #59 |
| 1984 | 2 652 199 404 $ US | #59 |
| 1983 | 2 627 142 401 $ US | #58 |
| 1982 | 3 538 834 102 $ US | #56 |
| 1981 | 3 336 485 176 $ US | #58 |
| 1980 | 3 196 674 207 $ US | #58 |
| 1979 | 2 575 839 827 $ US | #55 |
| 1978 | 2 213 274 158 $ US | #53 |
| 1977 | 2 000 105 050 $ US | #52 |
| 1976 | 1 634 569 959 $ US | #54 |
| 1975 | 1 494 854 035 $ US | #53 |
| 1974 | 1 237 513 769 $ US | #53 |
| 1973 | 648 350 560 $ US | #58 |
| 1972 | 495 423 308 $ US | #58 |
| 1971 | 459 682 188 $ US | #58 |
| 1970 | 372 412 386 $ US | #59 |
| 1969 | 376 645 413 $ US | - |
| 1968 | 359 393 149 $ US | - |
| 1967 | 307 238 167 $ US | - |
| 1966 | 270 002 331 $ US | - |
| 1965 | 245 638 661 $ US | - |
| 1964 | 227 656 462 $ US | - |
| 1963 | 181 649 471 $ US | - |
| 1962 | 163 881 255 $ US | - |
| 1961 | 178 045 081 $ US | - |
| 1960 | 214 480 836 $ US | - |
En 2025, les importations de biens et services de l'Équateur s'élevaient à 36,4 milliards de dollars, contre 214 millions de dollars en 1960. Le minimum a été de 164 millions de dollars, en 1962. Elles se classaient au 73e rang mondial, en hausse par rapport au 76e rang en 2024. Leur meilleur rang a été le 52e, occupé pour la dernière fois en 1977.
En 2025, les importations de biens et services de l'Équateur étaient les 8es plus élevées de 26 pays situés en Amérique latine. En 2025, les exportations de l'Équateur dépassaient ses importations de 4,59 milliards de dollars, soit un excédent commercial. Le commerce de l'Équateur, exportations et importations réunies, équivalait à 59,4 % de son PIB en 2025, au 121e rang mondial.
Importations de biens de l'Équateur par catégorie, 2025
Importations de biens, 2025: 32,6 Md $US
En 2025, la première catégorie des importations de biens de l'Équateur était « machines, électronique et véhicules », avec 28,8 %, suivie de « pétrole, gaz, minerais et autres matières premières », avec 26,0 %.
Origines des importations de biens de l'Équateur : les 10 premières, 2025
| Rang | Pays | Importations de biens | Part | |
|---|---|---|---|---|
| 1 |
 États-Unis |
9,16 Md $US | 28,1 % | |
| 2 |
 Chine |
8,44 Md $US | 25,9 % | |
| 3 |
 Colombie |
1,96 Md $US | 6 % | vs Colombie |
| 4 |
 Brésil |
1,13 Md $US | 3,45 % | |
| 5 |
 Pérou |
1,11 Md $US | 3,4 % | vs Pérou |
| 6 |
 Argentine |
910 M $US | 2,79 % | |
| 7 |
 Espagne |
743 M $US | 2,28 % | |
| 8 |
 Allemagne |
734 M $US | 2,25 % | |
| 9 |
 Corée du Sud |
684 M $US | 2,09 % | |
| 10 |
 Mexique |
626 M $US | 1,92 % | vs Mexique |
| Autres partenaires et non précisés | 7,15 Md $US | 21,9 % |
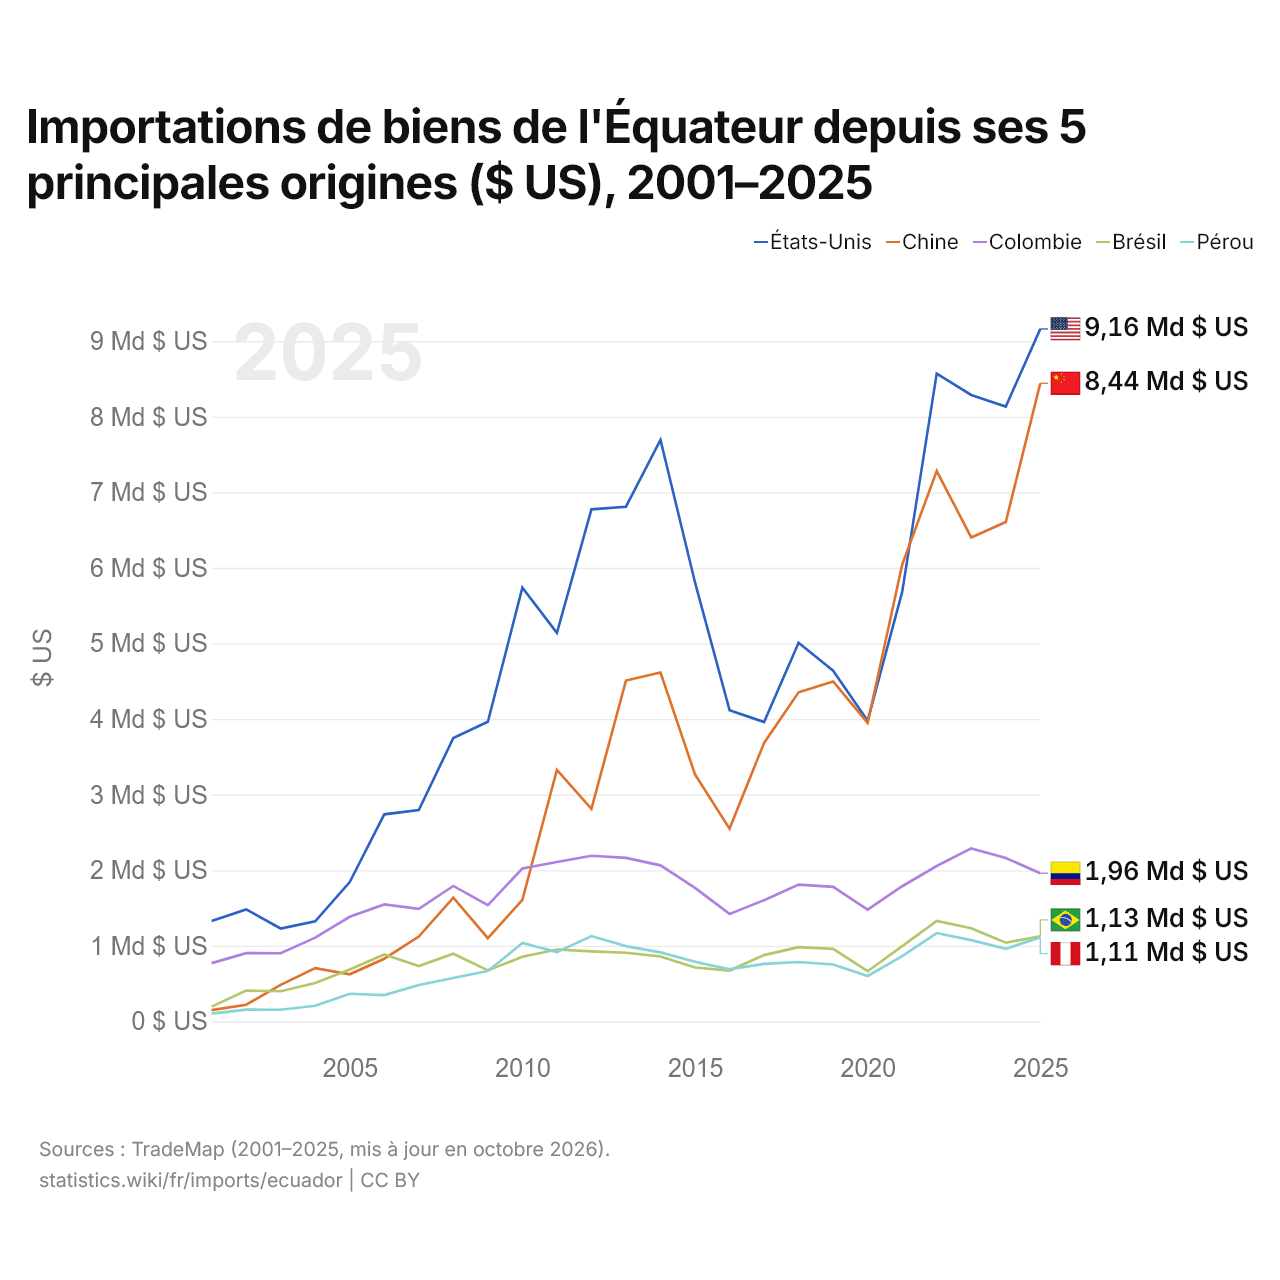
Importations de biens de l'Équateur depuis ses 5 principales origines ($ US), 2001–2025
| Année | $ US | ||||
|---|---|---|---|---|---|
| États-Unis | Chine | Colombie | Brésil | Pérou | |
| 2025 | 9 160 689 000 $ US | 8 441 081 000 $ US | 1 959 882 000 $ US | 1 125 766 000 $ US | 1 110 745 000 $ US |
| 2024 | 8 133 108 000 $ US | 6 606 564 000 $ US | 2 161 984 000 $ US | 1 039 764 000 $ US | 959 481 000 $ US |
| 2023 | 8 286 773 000 $ US | 6 401 109 000 $ US | 2 288 597 000 $ US | 1 232 256 000 $ US | 1 074 798 000 $ US |
| 2022 | 8 568 789 000 $ US | 7 280 526 000 $ US | 2 055 109 000 $ US | 1 328 187 000 $ US | 1 167 960 000 $ US |
| 2021 | 5 681 096 000 $ US | 6 040 378 000 $ US | 1 787 197 000 $ US | 994 904 000 $ US | 862 228 000 $ US |
| 2020 | 3 977 717 000 $ US | 3 947 269 000 $ US | 1 477 577 000 $ US | 662 991 000 $ US | 599 950 000 $ US |
| 2019 | 4 637 379 000 $ US | 4 496 520 000 $ US | 1 779 175 000 $ US | 959 509 000 $ US | 752 531 000 $ US |
| 2018 | 5 008 223 000 $ US | 4 352 612 000 $ US | 1 809 245 000 $ US | 981 400 000 $ US | 785 003 000 $ US |
| 2017 | 3 959 825 000 $ US | 3 683 819 000 $ US | 1 603 024 000 $ US | 876 309 000 $ US | 759 249 000 $ US |
| 2016 | 4 116 538 000 $ US | 2 549 410 000 $ US | 1 421 097 000 $ US | 671 949 000 $ US | 688 703 000 $ US |
| 2015 | 5 806 194 000 $ US | 3 265 628 000 $ US | 1 765 472 000 $ US | 712 309 000 $ US | 788 490 000 $ US |
| 2014 | 7 692 957 000 $ US | 4 614 573 000 $ US | 2 063 229 000 $ US | 858 536 000 $ US | 912 304 000 $ US |
| 2013 | 6 807 961 000 $ US | 4 508 391 000 $ US | 2 162 908 000 $ US | 907 768 000 $ US | 995 155 000 $ US |
| 2012 | 6 773 934 000 $ US | 2 810 684 000 $ US | 2 190 194 000 $ US | 925 333 000 $ US | 1 127 950 000 $ US |
| 2011 | 5 138 353 000 $ US | 3 326 991 000 $ US | 2 108 100 000 $ US | 949 896 000 $ US | 915 136 000 $ US |
| 2010 | 5 736 443 000 $ US | 1 606 562 000 $ US | 2 022 329 000 $ US | 853 815 000 $ US | 1 035 594 000 $ US |
| 2009 | 3 962 365 000 $ US | 1 100 283 000 $ US | 1 537 899 000 $ US | 673 461 000 $ US | 665 684 000 $ US |
| 2008 | 3 748 244 000 $ US | 1 636 363 000 $ US | 1 791 373 000 $ US | 894 281 000 $ US | 572 934 000 $ US |
| 2007 | 2 794 782 000 $ US | 1 121 735 000 $ US | 1 488 837 000 $ US | 730 927 000 $ US | 481 089 000 $ US |
| 2006 | 2 738 812 000 $ US | 828 182 000 $ US | 1 546 543 000 $ US | 883 961 000 $ US | 347 253 000 $ US |
| 2005 | 1 842 725 000 $ US | 621 733 000 $ US | 1 383 168 000 $ US | 685 183 000 $ US | 364 862 000 $ US |
| 2004 | 1 323 167 000 $ US | 703 798 000 $ US | 1 107 490 000 $ US | 508 067 000 $ US | 206 003 000 $ US |
| 2003 | 1 227 570 000 $ US | 481 850 000 $ US | 901 055 000 $ US | 398 193 000 $ US | 153 688 000 $ US |
| 2002 | 1 480 872 000 $ US | 219 748 000 $ US | 902 348 000 $ US | 405 932 000 $ US | 154 812 000 $ US |
| 2001 | 1 326 442 000 $ US | 148 635 000 $ US | 770 400 000 $ US | 194 622 000 $ US | 101 725 000 $ US |
En 2025, les importations de biens s'élevaient à 9,16 milliards de dollars en provenance des États-Unis, 8,44 milliards de dollars en provenance de la Chine, 1,96 milliard de dollars en provenance de la Colombie, 1,13 milliard de dollars en provenance du Brésil et 1,11 milliard de dollars en provenance du Pérou. Le premier rang des cinq fournisseurs de l'Équateur est occupé par les États-Unis depuis 2022.
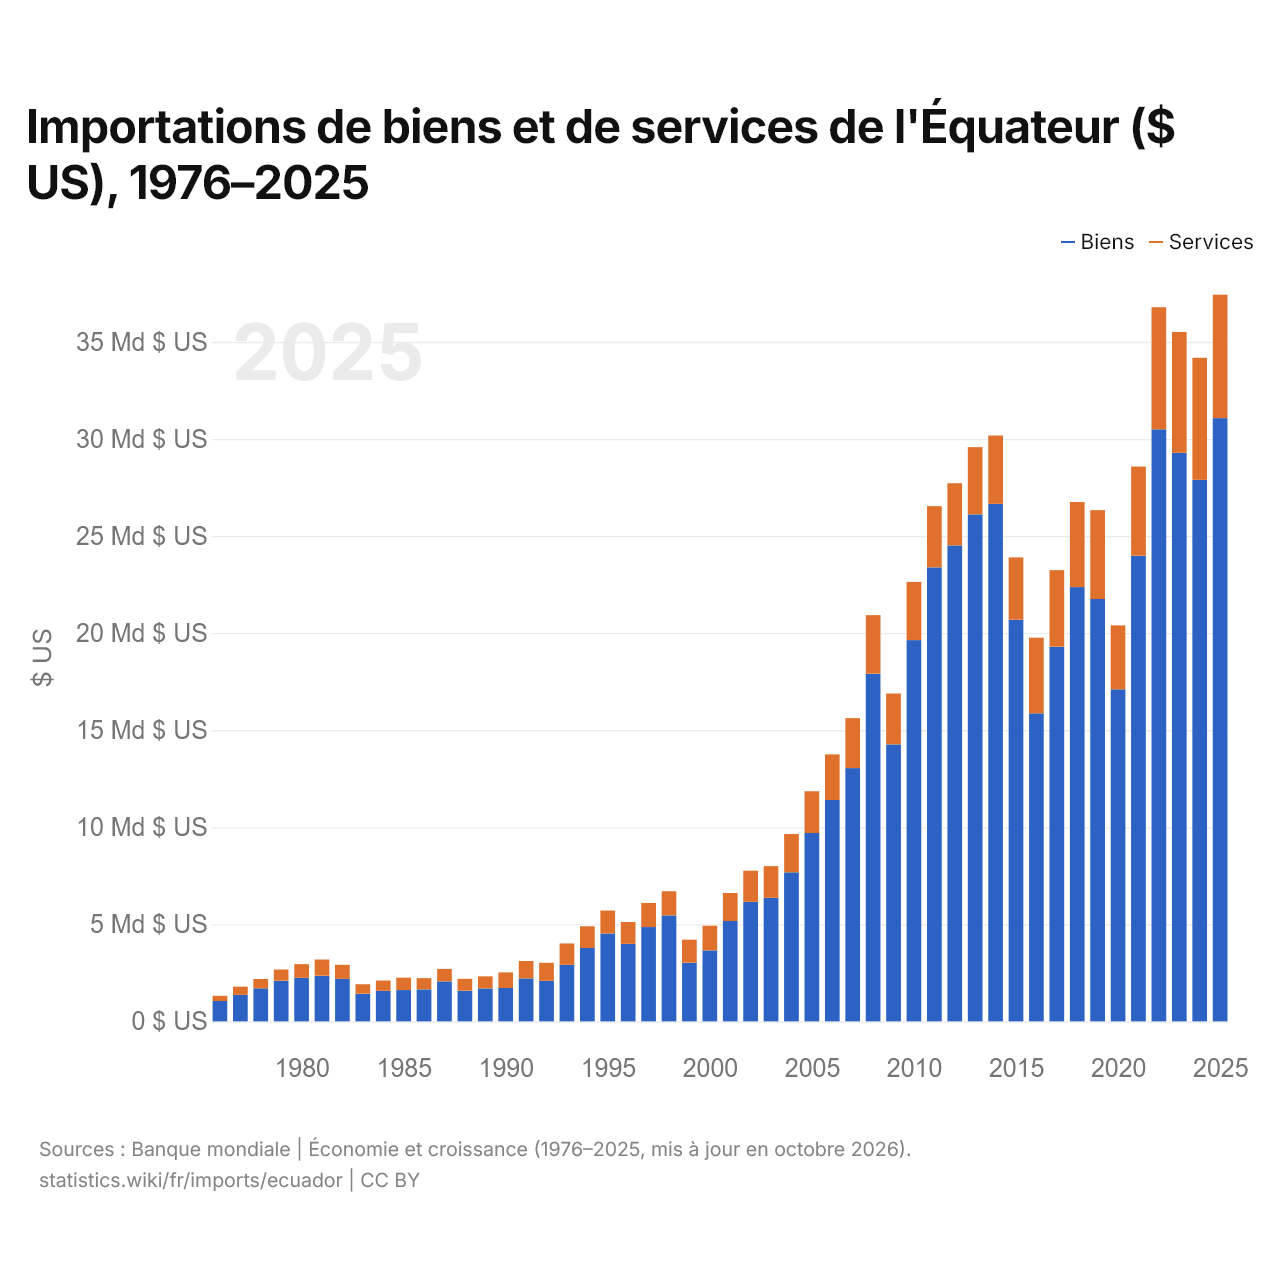
Importations de biens et de services de l'Équateur ($ US), 1976–2025
| Année | $ US | |
|---|---|---|
| Biens | Services | |
| 2025 | 31 066 638 478 $ US | 6 361 954 091 $ US |
| 2024 | 27 893 289 547 $ US | 6 282 232 018 $ US |
| 2023 | 29 283 213 175 $ US | 6 225 979 784 $ US |
| 2022 | 30 495 114 349 $ US | 6 285 940 187 $ US |
| 2021 | 23 980 961 798 $ US | 4 597 784 094 $ US |
| 2020 | 17 100 254 762 $ US | 3 293 569 592 $ US |
| 2019 | 21 752 620 048 $ US | 4 578 423 736 $ US |
| 2018 | 22 366 438 411 $ US | 4 379 334 824 $ US |
| 2017 | 19 301 191 090 $ US | 3 936 044 188 $ US |
| 2016 | 15 866 563 728 $ US | 3 894 437 529 $ US |
| 2015 | 20 692 541 799 $ US | 3 202 558 983 $ US |
| 2014 | 26 653 974 326 $ US | 3 522 965 121 $ US |
| 2013 | 26 109 329 087 $ US | 3 466 935 470 $ US |
| 2012 | 24 512 948 909 $ US | 3 204 352 072 $ US |
| 2011 | 23 378 937 193 $ US | 3 156 171 307 $ US |
| 2010 | 19 635 073 726 $ US | 3 000 671 379 $ US |
| 2009 | 14 262 445 547 $ US | 2 624 310 923 $ US |
| 2008 | 17 906 102 793 $ US | 3 019 019 450 $ US |
| 2007 | 13 041 130 432 $ US | 2 577 562 936 $ US |
| 2006 | 11 401 685 522 $ US | 2 347 270 187 $ US |
| 2005 | 9 703 350 172 $ US | 2 147 954 890 $ US |
| 2004 | 7 673 390 755 $ US | 1 977 923 034 $ US |
| 2003 | 6 361 006 680 $ US | 1 629 798 451 $ US |
| 2002 | 6 153 683 277 $ US | 1 605 859 544 $ US |
| 2001 | 5 170 046 790 $ US | 1 441 589 129 $ US |
| 2000 | 3 653 382 345 $ US | 1 273 302 686 $ US |
| 1999 | 3 024 910 000 $ US | 1 183 660 000 $ US |
| 1998 | 5 452 930 000 $ US | 1 246 430 000 $ US |
| 1997 | 4 856 050 000 $ US | 1 242 550 000 $ US |
| 1996 | 3 993 090 000 $ US | 1 125 460 000 $ US |
| 1995 | 4 522 570 000 $ US | 1 185 290 000 $ US |
| 1994 | 3 776 980 000 $ US | 1 117 450 000 $ US |
| 1993 | 2 912 210 000 $ US | 1 099 490 000 $ US |
| 1992 | 2 083 000 000 $ US | 933 000 000 $ US |
| 1991 | 2 208 000 000 $ US | 900 000 000 $ US |
| 1990 | 1 715 000 000 $ US | 804 000 000 $ US |
| 1989 | 1 692 000 000 $ US | 626 000 000 $ US |
| 1988 | 1 583 000 000 $ US | 606 000 000 $ US |
| 1987 | 2 054 000 000 $ US | 648 000 000 $ US |
| 1986 | 1 643 000 000 $ US | 583 000 000 $ US |
| 1985 | 1 611 000 000 $ US | 636 000 000 $ US |
| 1984 | 1 567 000 000 $ US | 535 000 000 $ US |
| 1983 | 1 421 000 000 $ US | 491 000 000 $ US |
| 1982 | 2 187 000 000 $ US | 723 000 000 $ US |
| 1981 | 2 353 000 000 $ US | 834 300 000 $ US |
| 1980 | 2 241 800 000 $ US | 703 900 000 $ US |
| 1979 | 2 096 800 000 $ US | 569 400 000 $ US |
| 1978 | 1 704 000 000 $ US | 474 900 000 $ US |
| 1977 | 1 360 500 000 $ US | 425 500 000 $ US |
| 1976 | 1 047 900 000 $ US | 268 200 000 $ US |
En 2025, les importations de biens de l'Équateur s'élevaient à 31,1 milliards de dollars et celles de services à 6,36 milliards de dollars ; les services représentaient 17,0 % du total, contre 20,4 % en 1976.
L'Équateur dans le classement mondial des importations, 2025
| Rang | Pays | Importations | Part mondiale | |
|---|---|---|---|---|
| 70 |
 Guatemala |
38,2 Md $US | 0,11 % | vs Guatemala |
| 71 |
 Chypre |
37,9 Md $US | 0,11 % | |
| 72 |
 Estonie |
36,4 Md $US | 0,11 % | |
| 73 |
 Équateur |
36,4 Md $US | 0,11 % | |
| 74 |
 Rép. dominicaine |
35,5 Md $US | 0,11 % | |
| 75 |
 Bahreïn |
34,6 Md $US | 0,1 % | |
| 76 |
 Cambodge |
34,6 Md $US | 0,1 % |
Importations de biens et services de l'Équateur, % du PIB, 1960–2025
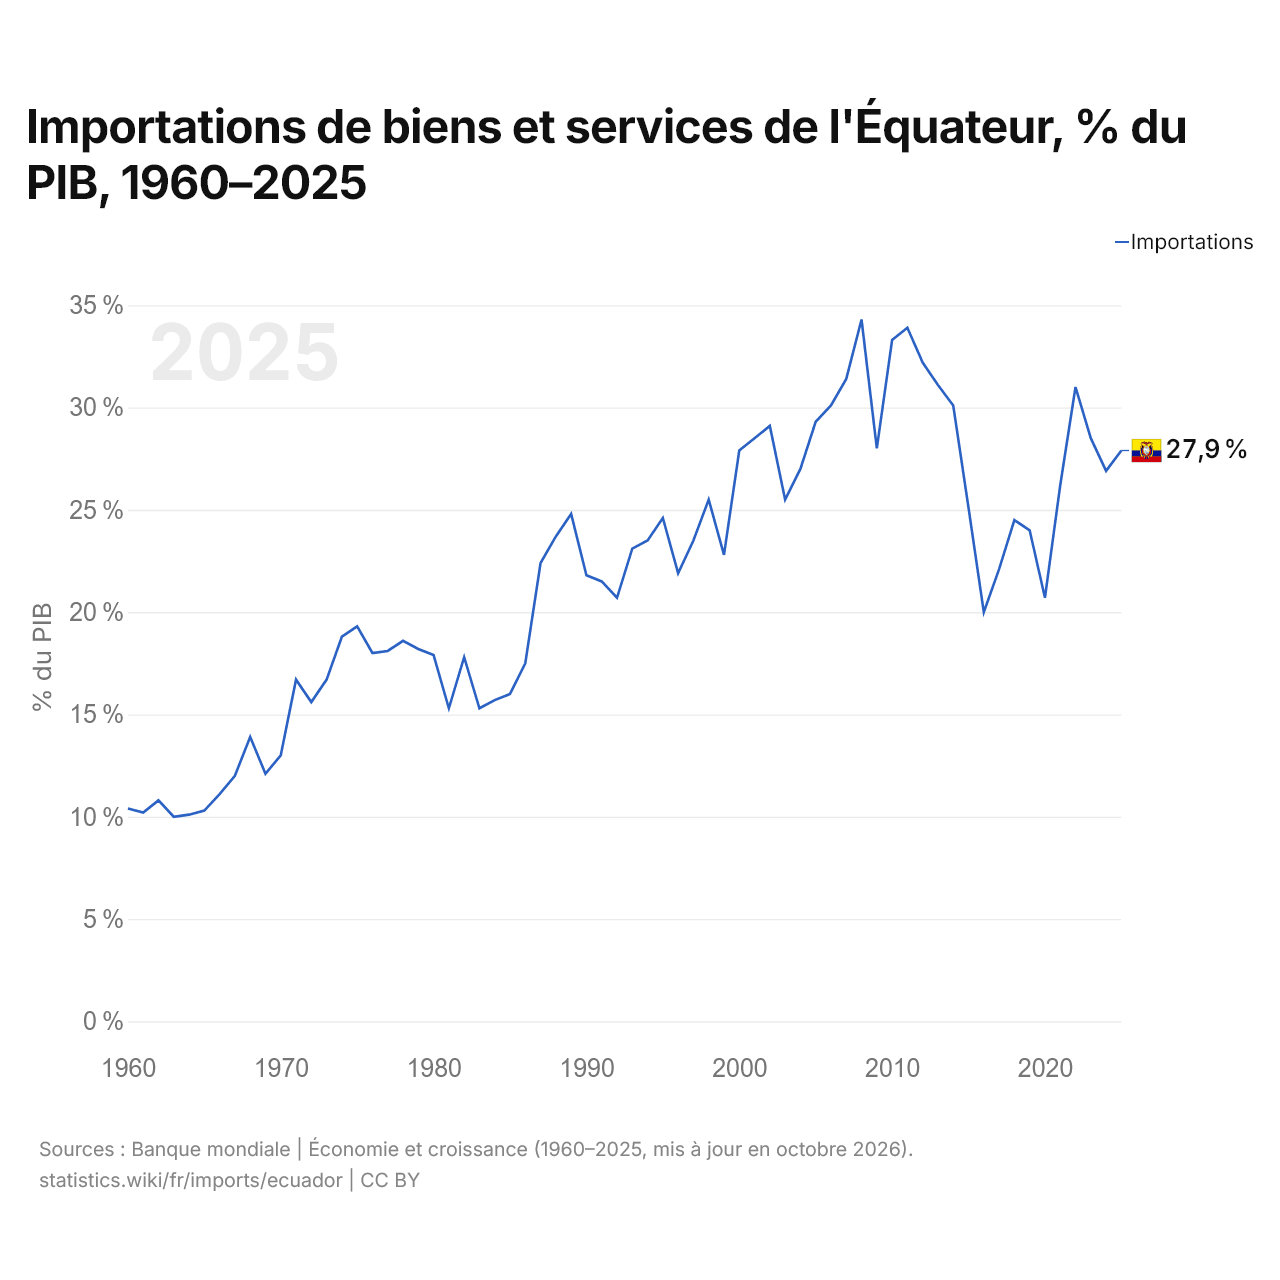
En 2025, les importations de biens et services de l'Équateur équivalaient à 27,9 % de son PIB, contre 10,4 % en 1960. La part la plus élevée a été de 34,3 %, en 2008.
Comparer les importations de l'Équateur avec celles d'autres pays
Sources :
- Banque mondiale | Économie et croissance (1960–2025, mis à jour en octobre 2026)
- TradeMap (2001–2025, mis à jour en octobre 2026)
Creative Commons Attribution (CC BY) : vous pouvez copier, partager, adapter et réutiliser ce contenu, y compris à des fins commerciales, à condition de citer statistics.wiki et d’indiquer les modifications apportées. Les sources citées ci-dessus peuvent avoir leurs propres conditions de licence.