
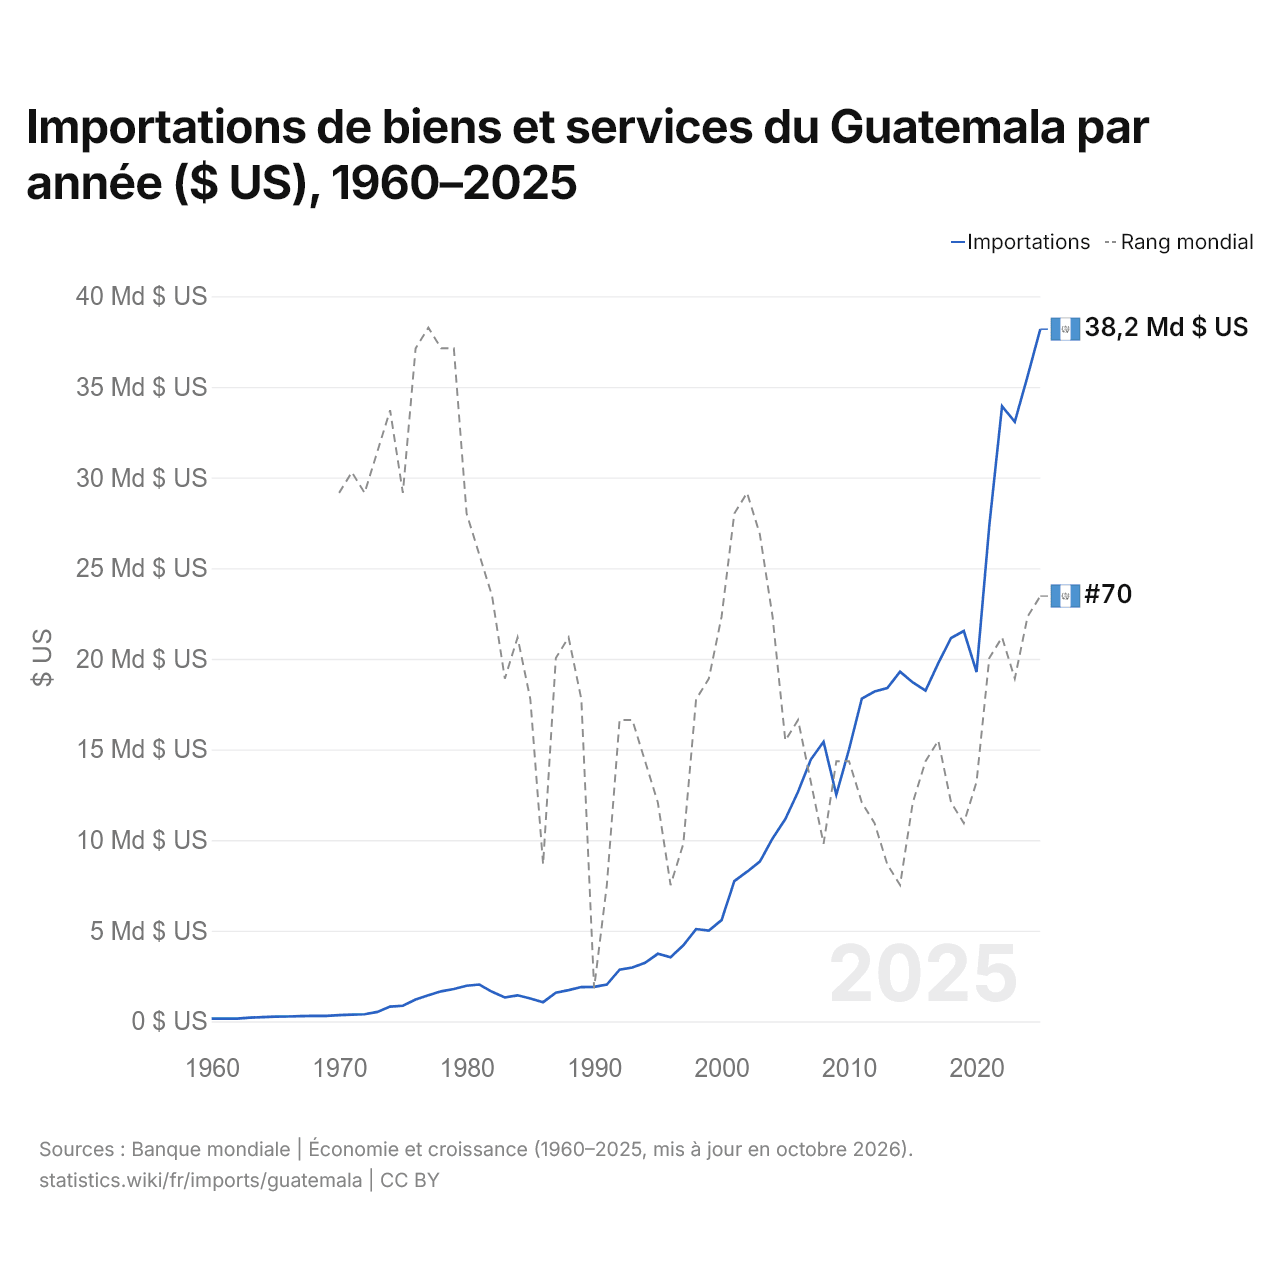
Importations de biens et services du Guatemala par année ($ US), 1960–2025
| Année | $ US | Rang mondial |
|---|---|---|
| Importations | Rang mondial | |
| 2025 | 38 185 944 239 $ US | #70 |
| 2024 | 35 574 411 055 $ US | #71 |
| 2023 | 33 075 327 753 $ US | #74 |
| 2022 | 33 938 882 281 $ US | #72 |
| 2021 | 27 347 172 006 $ US | #73 |
| 2020 | 19 272 211 250 $ US | #79 |
| 2019 | 21 534 755 034 $ US | #81 |
| 2018 | 21 149 628 050 $ US | #80 |
| 2017 | 19 758 074 339 $ US | #77 |
| 2016 | 18 243 717 810 $ US | #78 |
| 2015 | 18 695 335 942 $ US | #80 |
| 2014 | 19 287 280 919 $ US | #84 |
| 2013 | 18 382 911 954 $ US | #83 |
| 2012 | 18 197 166 630 $ US | #81 |
| 2011 | 17 803 200 265 $ US | #80 |
| 2010 | 15 009 546 896 $ US | #78 |
| 2009 | 12 501 436 111 $ US | #78 |
| 2008 | 15 422 428 184 $ US | #82 |
| 2007 | 14 441 173 646 $ US | #79 |
| 2006 | 12 662 747 620 $ US | #76 |
| 2005 | 11 154 959 730 $ US | #77 |
| 2004 | 10 090 013 800 $ US | #71 |
| 2003 | 8 807 734 237 $ US | #67 |
| 2002 | 8 255 070 816 $ US | #65 |
| 2001 | 7 731 202 010 $ US | #66 |
| 2000 | 5 584 251 720 $ US | #71 |
| 1999 | 5 011 108 418 $ US | #74 |
| 1998 | 5 091 730 420 $ US | #75 |
| 1997 | 4 197 706 681 $ US | #82 |
| 1996 | 3 539 822 367 $ US | #84 |
| 1995 | 3 726 925 963 $ US | #80 |
| 1994 | 3 226 456 526 $ US | #78 |
| 1993 | 2 972 656 775 $ US | #76 |
| 1992 | 2 849 942 850 $ US | #76 |
| 1991 | 2 028 682 331 $ US | #84 |
| 1990 | 1 900 459 187 $ US | #89 |
| 1989 | 1 890 234 375 $ US | #75 |
| 1988 | 1 720 152 710 $ US | #72 |
| 1987 | 1 579 400 000 $ US | #73 |
| 1986 | 1 055 296 758 $ US | #83 |
| 1985 | 1 262 260 870 $ US | #75 |
| 1984 | 1 434 800 000 $ US | #72 |
| 1983 | 1 316 999 900 $ US | #74 |
| 1982 | 1 628 999 900 $ US | #70 |
| 1981 | 2 031 500 000 $ US | #68 |
| 1980 | 1 963 300 000 $ US | #66 |
| 1979 | 1 784 400 000 $ US | #58 |
| 1978 | 1 655 000 100 $ US | #58 |
| 1977 | 1 439 000 100 $ US | #57 |
| 1976 | 1 204 100 000 $ US | #58 |
| 1975 | 858 000 000 $ US | #65 |
| 1974 | 811 400 000 $ US | #61 |
| 1973 | 519 100 000 $ US | #63 |
| 1972 | 389 500 000 $ US | #65 |
| 1971 | 371 100 000 $ US | #64 |
| 1970 | 338 500 000 $ US | #65 |
| 1969 | 299 000 000 $ US | - |
| 1968 | 296 600 000 $ US | - |
| 1967 | 283 600 000 $ US | - |
| 1966 | 266 100 000 $ US | - |
| 1965 | 261 100 000 $ US | - |
| 1964 | 235 000 000 $ US | - |
| 1963 | 201 200 000 $ US | - |
| 1962 | 153 500 000 $ US | - |
| 1961 | 145 300 000 $ US | - |
| 1960 | 151 700 000 $ US | - |
En 2025, les importations de biens et services du Guatemala s'élevaient à 38,2 milliards de dollars, contre 152 millions de dollars en 1960. Le minimum a été de 145 millions de dollars, en 1961. Elles se classaient au 70e rang mondial, en hausse par rapport au 71e rang en 2024. Leur meilleur rang a été le 57e, occupé pour la dernière fois en 1977.
En 2025, les importations de biens et services du Guatemala étaient les 7es plus élevées de 26 pays situés en Amérique latine. En 2025, les importations du Guatemala dépassaient ses exportations de 19 milliards de dollars, soit un déficit commercial. Le commerce du Guatemala, exportations et importations réunies, équivalait à 46,5 % de son PIB en 2025, au 141e rang mondial.
Importations de biens du Guatemala par catégorie, 2025
Importations de biens, 2025: 34,6 Md $US
En 2025, la première catégorie des importations de biens du Guatemala était « machines, électronique et véhicules », avec 27,8 %, suivie de « pétrole, gaz, minerais et autres matières premières », avec 18,0 %.
Origines des importations de biens du Guatemala : les 10 premières, 2025
| Rang | Pays | Importations de biens | Part | |
|---|---|---|---|---|
| 1 |
 États-Unis |
10,9 Md $US | 31,5 % | |
| 2 |
 Chine |
5,50 Md $US | 15,9 % | |
| 3 |
 Mexique |
3,43 Md $US | 9,91 % | vs Mexique |
| 4 |
 Salvador |
1,62 Md $US | 4,69 % | vs Salvador |
| 5 |
 Panama |
1,28 Md $US | 3,69 % | |
| 6 |
 Costa Rica |
1,19 Md $US | 3,45 % | |
| 7 |
 Honduras |
954 M $US | 2,75 % | vs Honduras |
| 8 |
 Inde |
766 M $US | 2,21 % | |
| 9 |
 Brésil |
685 M $US | 1,98 % | |
| 10 |
 Colombie |
652 M $US | 1,88 % | vs Colombie |
| Autres partenaires et non précisés | 7,62 Md $US | 22 % |
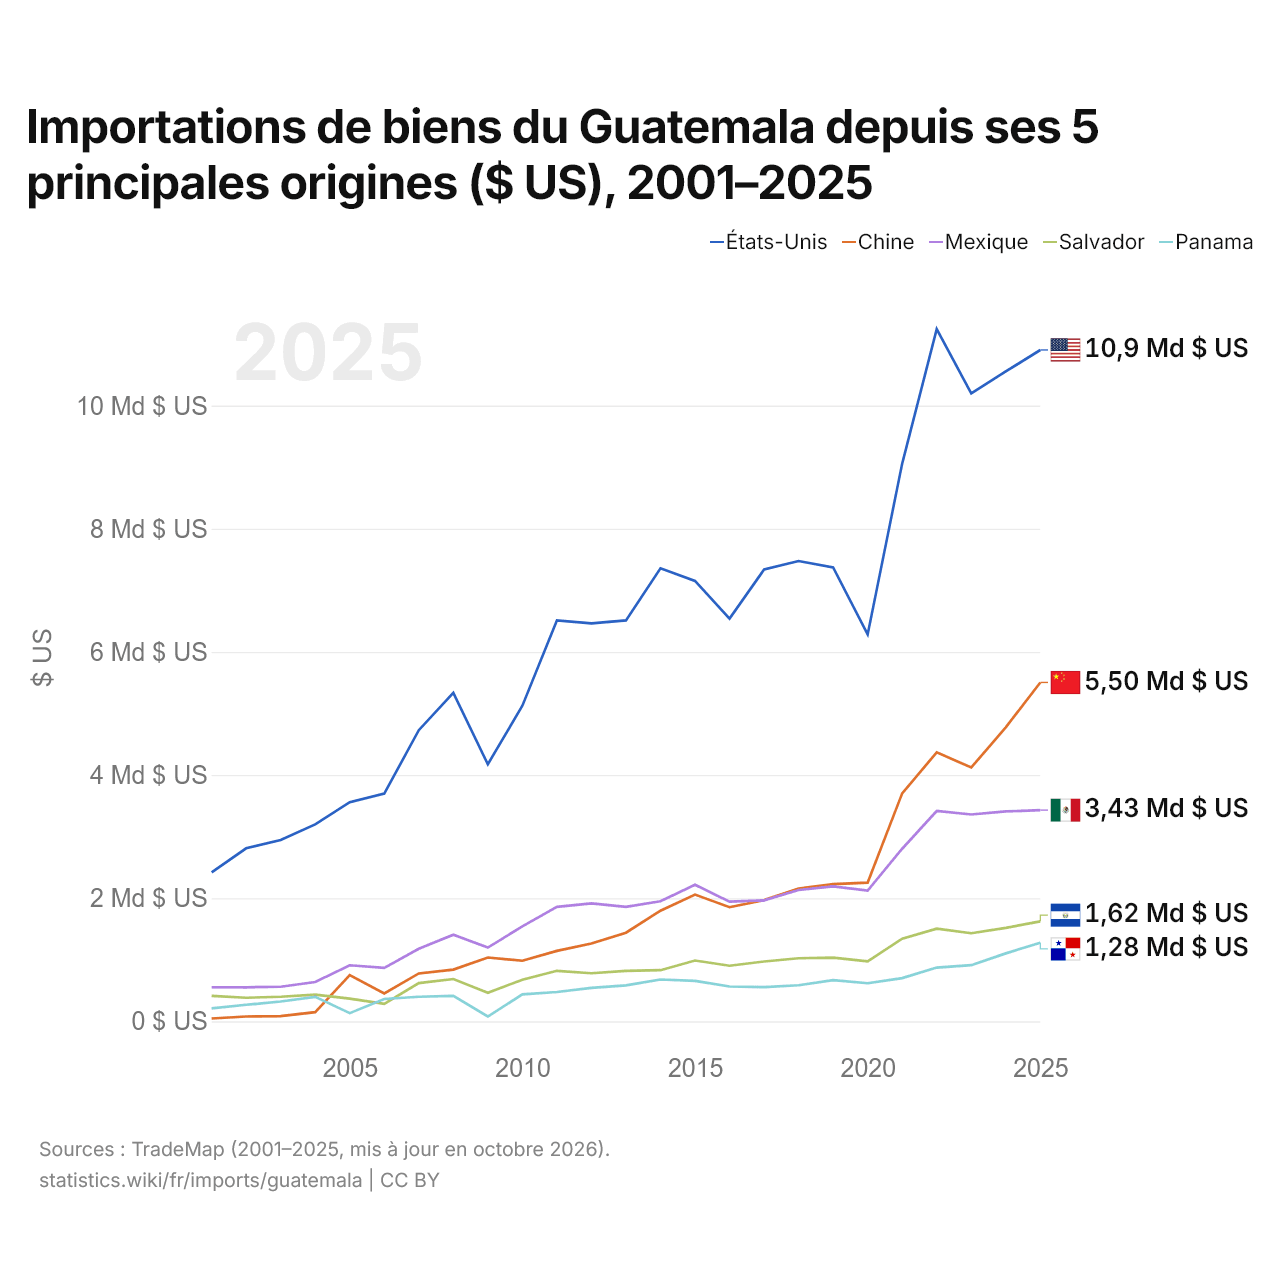
Importations de biens du Guatemala depuis ses 5 principales origines ($ US), 2001–2025
| Année | $ US | ||||
|---|---|---|---|---|---|
| États-Unis | Chine | Mexique | Salvador | Panama | |
| 2025 | 10 903 058 000 $ US | 5 503 339 000 $ US | 3 430 258 000 $ US | 1 624 251 000 $ US | 1 276 066 000 $ US |
| 2024 | 10 553 835 000 $ US | 4 774 317 000 $ US | 3 408 806 000 $ US | 1 517 846 000 $ US | 1 103 921 000 $ US |
| 2023 | 10 198 565 000 $ US | 4 122 255 000 $ US | 3 359 753 000 $ US | 1 430 644 000 $ US | 912 162 000 $ US |
| 2022 | 11 241 619 000 $ US | 4 367 804 000 $ US | 3 415 971 000 $ US | 1 506 146 000 $ US | 873 492 000 $ US |
| 2021 | 9 058 147 000 $ US | 3 702 185 000 $ US | 2 803 262 000 $ US | 1 343 440 000 $ US | 701 555 000 $ US |
| 2020 | 6 283 903 000 $ US | 2 253 197 000 $ US | 2 124 390 000 $ US | 974 600 000 $ US | 619 211 000 $ US |
| 2019 | 7 370 988 000 $ US | 2 228 910 000 $ US | 2 192 483 000 $ US | 1 034 366 000 $ US | 669 288 000 $ US |
| 2018 | 7 476 078 000 $ US | 2 157 482 000 $ US | 2 133 570 000 $ US | 1 025 106 000 $ US | 586 555 000 $ US |
| 2017 | 7 337 755 000 $ US | 1 969 972 000 $ US | 1 964 468 000 $ US | 972 193 000 $ US | 556 639 000 $ US |
| 2016 | 6 540 021 000 $ US | 1 853 523 000 $ US | 1 942 944 000 $ US | 902 778 000 $ US | 565 671 000 $ US |
| 2015 | 7 153 154 000 $ US | 2 057 975 000 $ US | 2 217 626 000 $ US | 987 788 000 $ US | 657 537 000 $ US |
| 2014 | 7 357 977 000 $ US | 1 796 889 000 $ US | 1 950 049 000 $ US | 830 655 000 $ US | 679 748 000 $ US |
| 2013 | 6 510 815 000 $ US | 1 438 540 000 $ US | 1 860 241 000 $ US | 819 984 000 $ US | 584 875 000 $ US |
| 2012 | 6 461 996 000 $ US | 1 264 958 000 $ US | 1 915 632 000 $ US | 780 285 000 $ US | 543 402 000 $ US |
| 2011 | 6 510 430 000 $ US | 1 144 083 000 $ US | 1 859 015 000 $ US | 820 370 000 $ US | 476 969 000 $ US |
| 2010 | 5 125 632 000 $ US | 983 652 000 $ US | 1 542 538 000 $ US | 675 572 000 $ US | 438 373 000 $ US |
| 2009 | 4 174 415 000 $ US | 1 036 251 000 $ US | 1 198 655 000 $ US | 463 029 000 $ US | 78 096 000 $ US |
| 2008 | 5 334 624 000 $ US | 840 468 000 $ US | 1 405 431 000 $ US | 687 206 000 $ US | 412 007 000 $ US |
| 2007 | 4 728 229 000 $ US | 777 876 000 $ US | 1 179 594 000 $ US | 620 817 000 $ US | 399 562 000 $ US |
| 2006 | 3 698 169 000 $ US | 453 226 000 $ US | 868 972 000 $ US | 283 636 000 $ US | 363 331 000 $ US |
| 2005 | 3 558 261 000 $ US | 752 091 000 $ US | 910 163 000 $ US | 369 125 000 $ US | 132 945 000 $ US |
| 2004 | 3 198 855 000 $ US | 149 465 000 $ US | 637 570 000 $ US | 434 907 000 $ US | 398 075 000 $ US |
| 2003 | 2 944 267 000 $ US | 85 452 000 $ US | 561 900 000 $ US | 398 974 000 $ US | 322 260 000 $ US |
| 2002 | 2 810 525 000 $ US | 77 953 000 $ US | 552 573 000 $ US | 383 007 000 $ US | 268 599 000 $ US |
| 2001 | 2 418 891 000 $ US | 46 287 000 $ US | 553 161 000 $ US | 414 354 000 $ US | 211 239 000 $ US |
En 2025, les importations de biens s'élevaient à 10,9 milliards de dollars en provenance des États-Unis, 5,5 milliards de dollars en provenance de la Chine, 3,43 milliards de dollars en provenance du Mexique, 1,62 milliard de dollars en provenance du Salvador et 1,28 milliard de dollars en provenance du Panama. Le premier rang des cinq fournisseurs du Guatemala est occupé par les États-Unis chaque année depuis 2001. Le changement le plus récent dans leur ordre remonte à 2017, quand les importations du Guatemala en provenance de la Chine ont dépassé celles en provenance du Mexique.
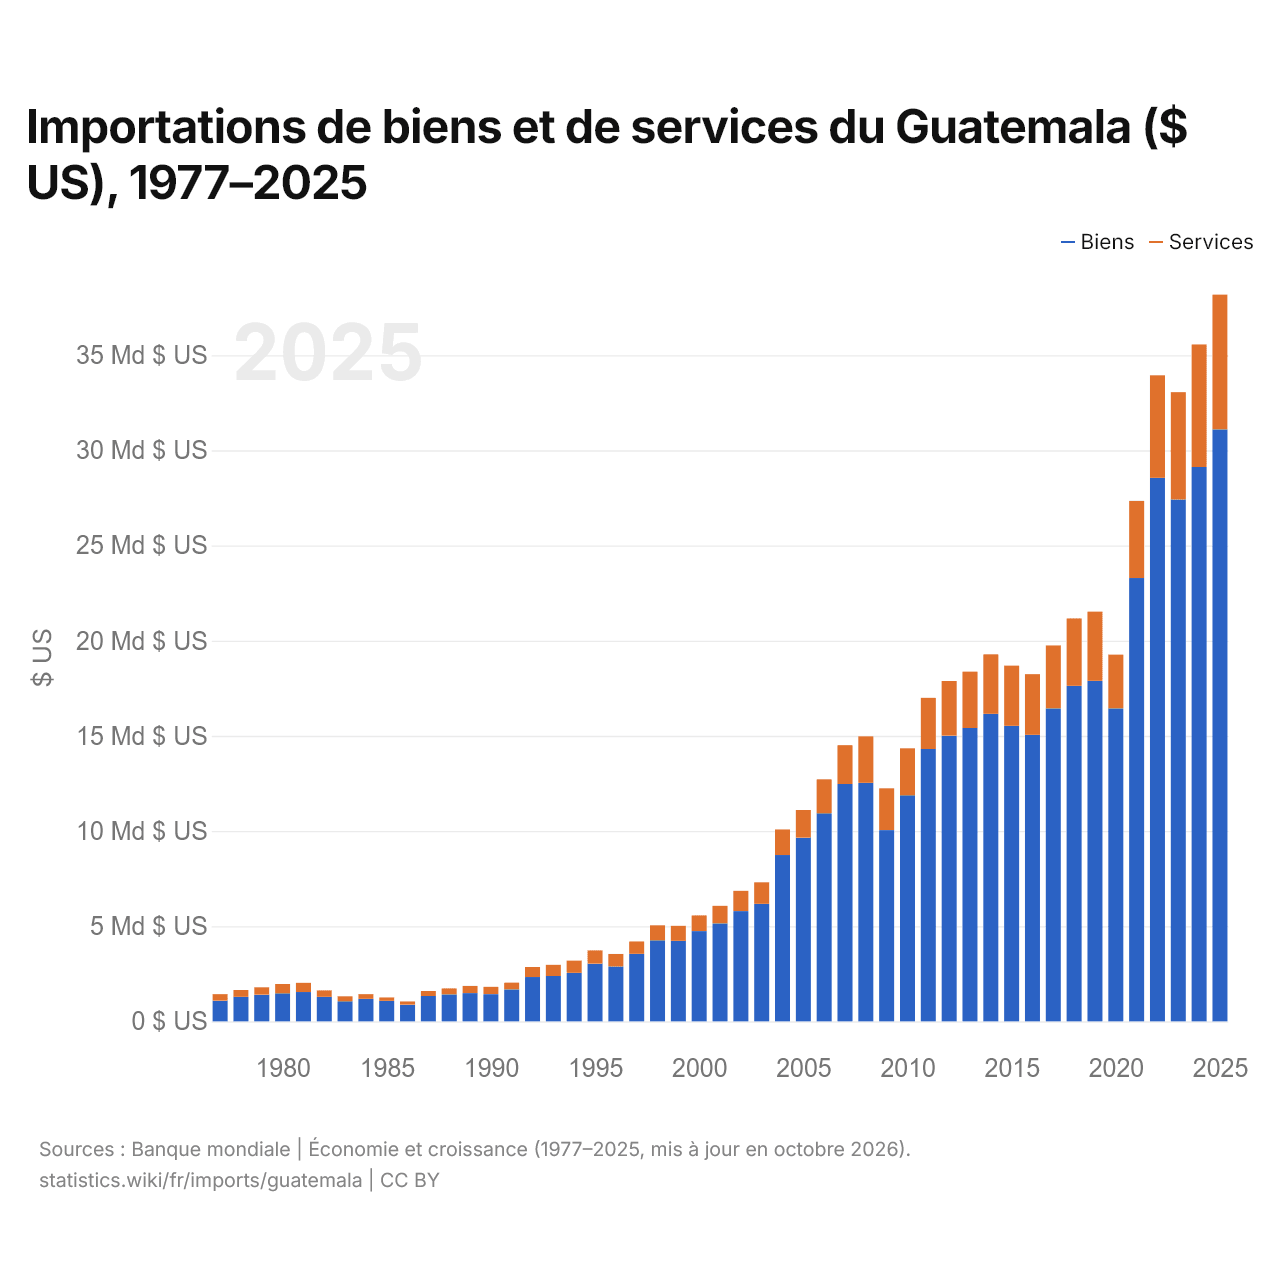
Importations de biens et de services du Guatemala ($ US), 1977–2025
| Année | $ US | |
|---|---|---|
| Biens | Services | |
| 2025 | 31 097 074 460 $ US | 7 081 189 910 $ US |
| 2024 | 29 124 150 290 $ US | 6 438 725 530 $ US |
| 2023 | 27 415 202 240 $ US | 5 640 641 800 $ US |
| 2022 | 28 557 977 750 $ US | 5 385 409 950 $ US |
| 2021 | 23 289 054 410 $ US | 4 054 028 280 $ US |
| 2020 | 16 440 813 870 $ US | 2 826 135 000 $ US |
| 2019 | 17 885 429 550 $ US | 3 641 127 600 $ US |
| 2018 | 17 628 849 920 $ US | 3 541 272 390 $ US |
| 2017 | 16 442 003 190 $ US | 3 308 646 950 $ US |
| 2016 | 15 049 605 910 $ US | 3 191 883 080 $ US |
| 2015 | 15 524 036 340 $ US | 3 161 877 300 $ US |
| 2014 | 16 157 399 240 $ US | 3 122 476 250 $ US |
| 2013 | 15 412 134 810 $ US | 2 962 972 200 $ US |
| 2012 | 15 007 840 310 $ US | 2 872 040 580 $ US |
| 2011 | 14 308 649 910 $ US | 2 685 169 550 $ US |
| 2010 | 11 878 178 960 $ US | 2 468 775 680 $ US |
| 2009 | 10 046 702 870 $ US | 2 197 705 210 $ US |
| 2008 | 12 529 109 120 $ US | 2 444 638 890 $ US |
| 2007 | 12 470 200 000 $ US | 2 041 200 000 $ US |
| 2006 | 10 934 400 000 $ US | 1 778 400 000 $ US |
| 2005 | 9 650 100 000 $ US | 1 449 600 000 $ US |
| 2004 | 8 737 000 000 $ US | 1 344 300 000 $ US |
| 2003 | 6 175 727 984 $ US | 1 126 115 940 $ US |
| 2002 | 5 791 006 299 $ US | 1 066 054 146 $ US |
| 2001 | 5 142 005 048 $ US | 926 211 081 $ US |
| 2000 | 4 742 000 000 $ US | 824 600 000 $ US |
| 1999 | 4 225 700 000 $ US | 790 700 000 $ US |
| 1998 | 4 255 700 000 $ US | 791 800 000 $ US |
| 1997 | 3 542 700 000 $ US | 650 500 000 $ US |
| 1996 | 2 880 300 000 $ US | 659 800 000 $ US |
| 1995 | 3 032 600 000 $ US | 695 000 000 $ US |
| 1994 | 2 546 600 000 $ US | 644 900 000 $ US |
| 1993 | 2 384 000 000 $ US | 586 100 000 $ US |
| 1992 | 2 327 800 000 $ US | 525 300 000 $ US |
| 1991 | 1 673 000 000 $ US | 356 400 000 $ US |
| 1990 | 1 428 000 000 $ US | 383 700 000 $ US |
| 1989 | 1 484 400 000 $ US | 376 900 000 $ US |
| 1988 | 1 413 200 000 $ US | 317 900 000 $ US |
| 1987 | 1 333 200 000 $ US | 259 500 000 $ US |
| 1986 | 875 700 000 $ US | 170 100 000 $ US |
| 1985 | 1 076 700 000 $ US | 180 000 000 $ US |
| 1984 | 1 182 200 000 $ US | 245 500 000 $ US |
| 1983 | 1 056 000 000 $ US | 257 800 000 $ US |
| 1982 | 1 284 300 000 $ US | 341 900 000 $ US |
| 1981 | 1 540 000 000 $ US | 484 300 000 $ US |
| 1980 | 1 472 600 000 $ US | 487 400 000 $ US |
| 1979 | 1 401 700 000 $ US | 383 100 000 $ US |
| 1978 | 1 283 800 000 $ US | 361 000 000 $ US |
| 1977 | 1 087 000 000 $ US | 339 500 000 $ US |
En 2025, les importations de biens du Guatemala s'élevaient à 31,1 milliards de dollars et celles de services à 7,08 milliards de dollars ; les services représentaient 18,5 % du total, contre 23,8 % en 1977.
Le Guatemala dans le classement mondial des importations, 2025
| Rang | Pays | Importations | Part mondiale | |
|---|---|---|---|---|
| 67 |
 Oman |
53,2 Md $US | 0,16 % | |
| 68 |
 Ouzbékistan |
52,0 Md $US | 0,15 % | |
| 69 |
 RDC |
40,0 Md $US | 0,12 % | |
| 70 |
 Guatemala |
38,2 Md $US | 0,11 % | |
| 71 |
 Chypre |
37,9 Md $US | 0,11 % | |
| 72 |
 Estonie |
36,4 Md $US | 0,11 % | |
| 73 |
 Équateur |
36,4 Md $US | 0,11 % | vs Équateur |
Importations de biens et services du Guatemala, % du PIB, 1960–2025
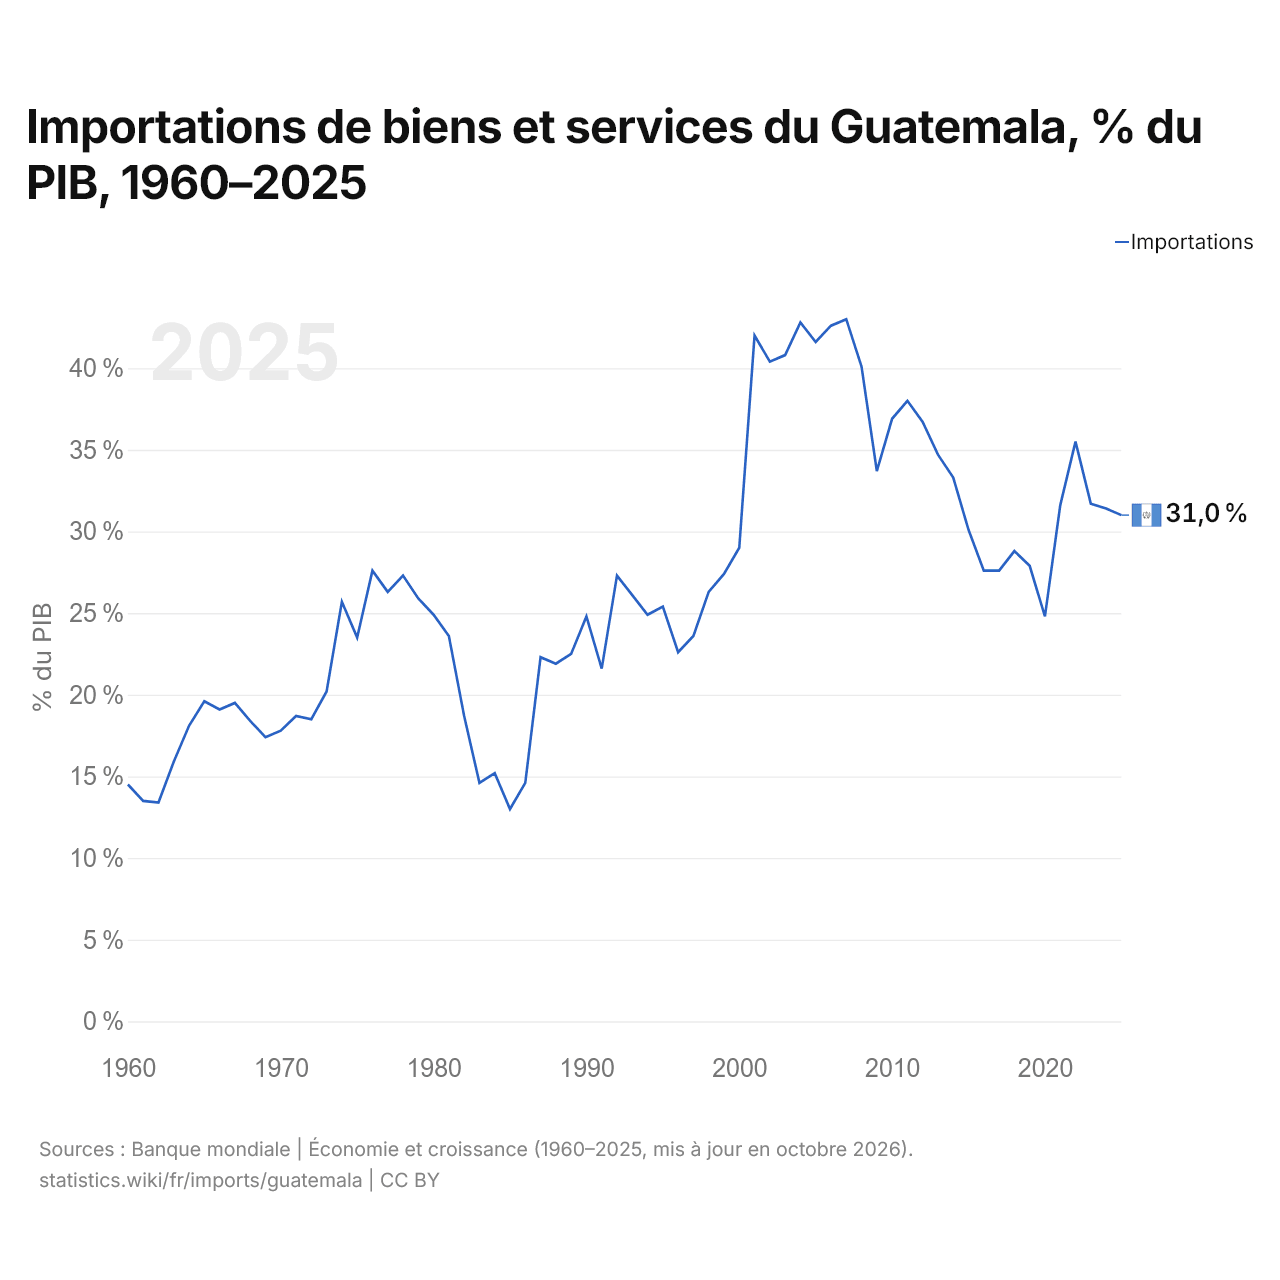
En 2025, les importations de biens et services du Guatemala équivalaient à 31,0 % de son PIB, contre 14,5 % en 1960. La part la plus élevée a été de 43,0 %, en 2007.
Comparer les importations du Guatemala avec celles d'autres pays
Sources :
- Banque mondiale | Économie et croissance (1960–2025, mis à jour en octobre 2026)
- TradeMap (2001–2025, mis à jour en octobre 2026)
Creative Commons Attribution (CC BY) : vous pouvez copier, partager, adapter et réutiliser ce contenu, y compris à des fins commerciales, à condition de citer statistics.wiki et d’indiquer les modifications apportées. Les sources citées ci-dessus peuvent avoir leurs propres conditions de licence.