
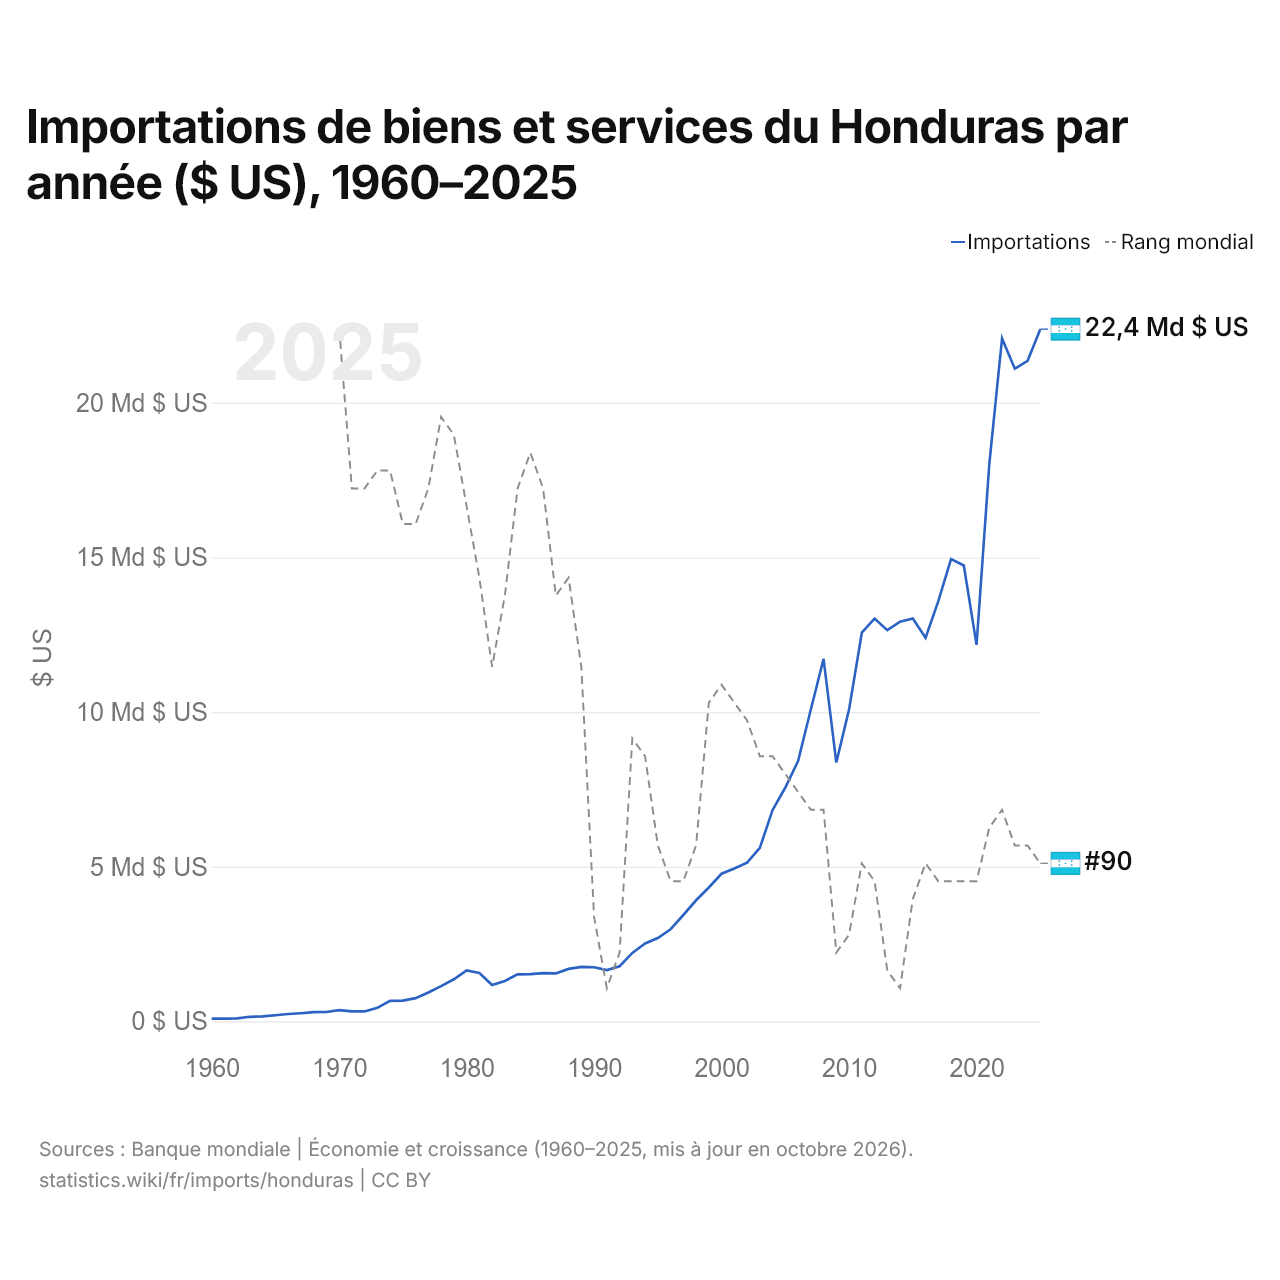
Importations de biens et services du Honduras par année ($ US), 1960–2025
| Année | $ US | Rang mondial |
|---|---|---|
| Importations | Rang mondial | |
| 2025 | 22 380 972 289 $ US | #90 |
| 2024 | 21 355 235 204 $ US | #89 |
| 2023 | 21 102 469 278 $ US | #89 |
| 2022 | 22 079 730 542 $ US | #87 |
| 2021 | 18 014 411 249 $ US | #88 |
| 2020 | 12 172 518 450 $ US | #91 |
| 2019 | 14 740 482 899 $ US | #91 |
| 2018 | 14 945 193 703 $ US | #91 |
| 2017 | 13 585 432 743 $ US | #91 |
| 2016 | 12 401 102 552 $ US | #90 |
| 2015 | 13 027 957 171 $ US | #92 |
| 2014 | 12 923 231 435 $ US | #97 |
| 2013 | 12 647 258 281 $ US | #96 |
| 2012 | 13 022 871 720 $ US | #91 |
| 2011 | 12 567 072 764 $ US | #90 |
| 2010 | 10 086 959 053 $ US | #94 |
| 2009 | 8 369 540 251 $ US | #95 |
| 2008 | 11 719 468 690 $ US | #87 |
| 2007 | 10 082 042 434 $ US | #87 |
| 2006 | 8 414 884 875 $ US | #86 |
| 2005 | 7 560 116 527 $ US | #85 |
| 2004 | 6 832 799 507 $ US | #84 |
| 2003 | 5 609 361 468 $ US | #84 |
| 2002 | 5 128 837 533 $ US | #82 |
| 2001 | 4 939 695 319 $ US | #81 |
| 2000 | 4 773 363 656 $ US | #80 |
| 1999 | 4 327 289 199 $ US | #81 |
| 1998 | 3 915 155 096 $ US | #89 |
| 1997 | 3 438 463 878 $ US | #91 |
| 1996 | 2 976 722 973 $ US | #91 |
| 1995 | 2 694 118 874 $ US | #89 |
| 1994 | 2 516 375 702 $ US | #84 |
| 1993 | 2 212 212 827 $ US | #83 |
| 1992 | 1 780 679 896 $ US | #95 |
| 1991 | 1 659 600 880 $ US | #97 |
| 1990 | 1 749 951 362 $ US | #93 |
| 1989 | 1 759 344 828 $ US | #79 |
| 1988 | 1 695 407 725 $ US | #74 |
| 1987 | 1 548 750 000 $ US | #75 |
| 1986 | 1 556 400 000 $ US | #69 |
| 1985 | 1 527 600 000 $ US | #67 |
| 1984 | 1 519 300 000 $ US | #69 |
| 1983 | 1 303 750 000 $ US | #75 |
| 1982 | 1 171 950 000 $ US | #79 |
| 1981 | 1 562 700 000 $ US | #74 |
| 1980 | 1 644 450 000 $ US | #70 |
| 1979 | 1 359 600 000 $ US | #66 |
| 1978 | 1 137 500 000 $ US | #65 |
| 1977 | 933 750 000 $ US | #69 |
| 1976 | 748 700 000 $ US | #71 |
| 1975 | 668 550 000 $ US | #71 |
| 1974 | 663 000 000 $ US | #68 |
| 1973 | 436 099 782 $ US | #68 |
| 1972 | 319 848 561 $ US | #69 |
| 1971 | 319 800 000 $ US | #69 |
| 1970 | 359 800 000 $ US | #60 |
| 1969 | 302 850 000 $ US | - |
| 1968 | 296 350 000 $ US | - |
| 1967 | 262 700 000 $ US | - |
| 1966 | 238 050 000 $ US | - |
| 1965 | 196 150 000 $ US | - |
| 1964 | 161 500 000 $ US | - |
| 1963 | 146 550 000 $ US | - |
| 1962 | 94 250 000 $ US | - |
| 1961 | 88 450 000 $ US | - |
| 1960 | 85 250 000 $ US | - |
En 2025, les importations de biens et services du Honduras s'élevaient à 22,4 milliards de dollars, contre 85,3 millions de dollars en 1960. Elles se classaient au 90e rang mondial, en baisse par rapport au 89e rang en 2024. Leur meilleur rang a été le 60e, occupé pour la dernière fois en 1970.
En 2025, les importations de biens et services du Honduras étaient les 12es plus élevées de 26 pays situés en Amérique latine. En 2025, les importations du Honduras dépassaient ses exportations de 8,52 milliards de dollars, soit un déficit commercial. Le commerce du Honduras, exportations et importations réunies, équivalait à 91,5 % de son PIB en 2025, au 74e rang mondial.
Importations de biens du Honduras par catégorie
Importations de biens, 2024: 14,5 Md $US
La première catégorie des importations de biens du Honduras est « machines, électronique et véhicules », avec 27,3 %, suivie de « pétrole, gaz, minerais et autres matières premières », avec 21,5 %.
Origines des importations de biens du Honduras : les 10 premières
| Rang | Pays | Importations de biens | Part | |
|---|---|---|---|---|
| 1 |
 États-Unis |
4,94 Md $US | 34,1 % | |
| 2 |
 Chine |
2,56 Md $US | 17,6 % | |
| 3 |
 Mexique |
1,06 Md $US | 7,31 % | vs Mexique |
| 4 |
 Guatemala |
750 M $US | 5,17 % | vs Guatemala |
| 5 |
 Salvador |
600 M $US | 4,14 % | vs Salvador |
| 6 |
 Costa Rica |
503 M $US | 3,47 % | |
| 7 |
 Brésil |
295 M $US | 2,03 % | |
| 8 |
 Inde |
264 M $US | 1,82 % | |
| 9 |
 Allemagne |
258 M $US | 1,78 % | |
| 10 |
 Japon |
247 M $US | 1,7 % | |
| Autres partenaires et non précisés | 3,03 Md $US | 20,9 % |
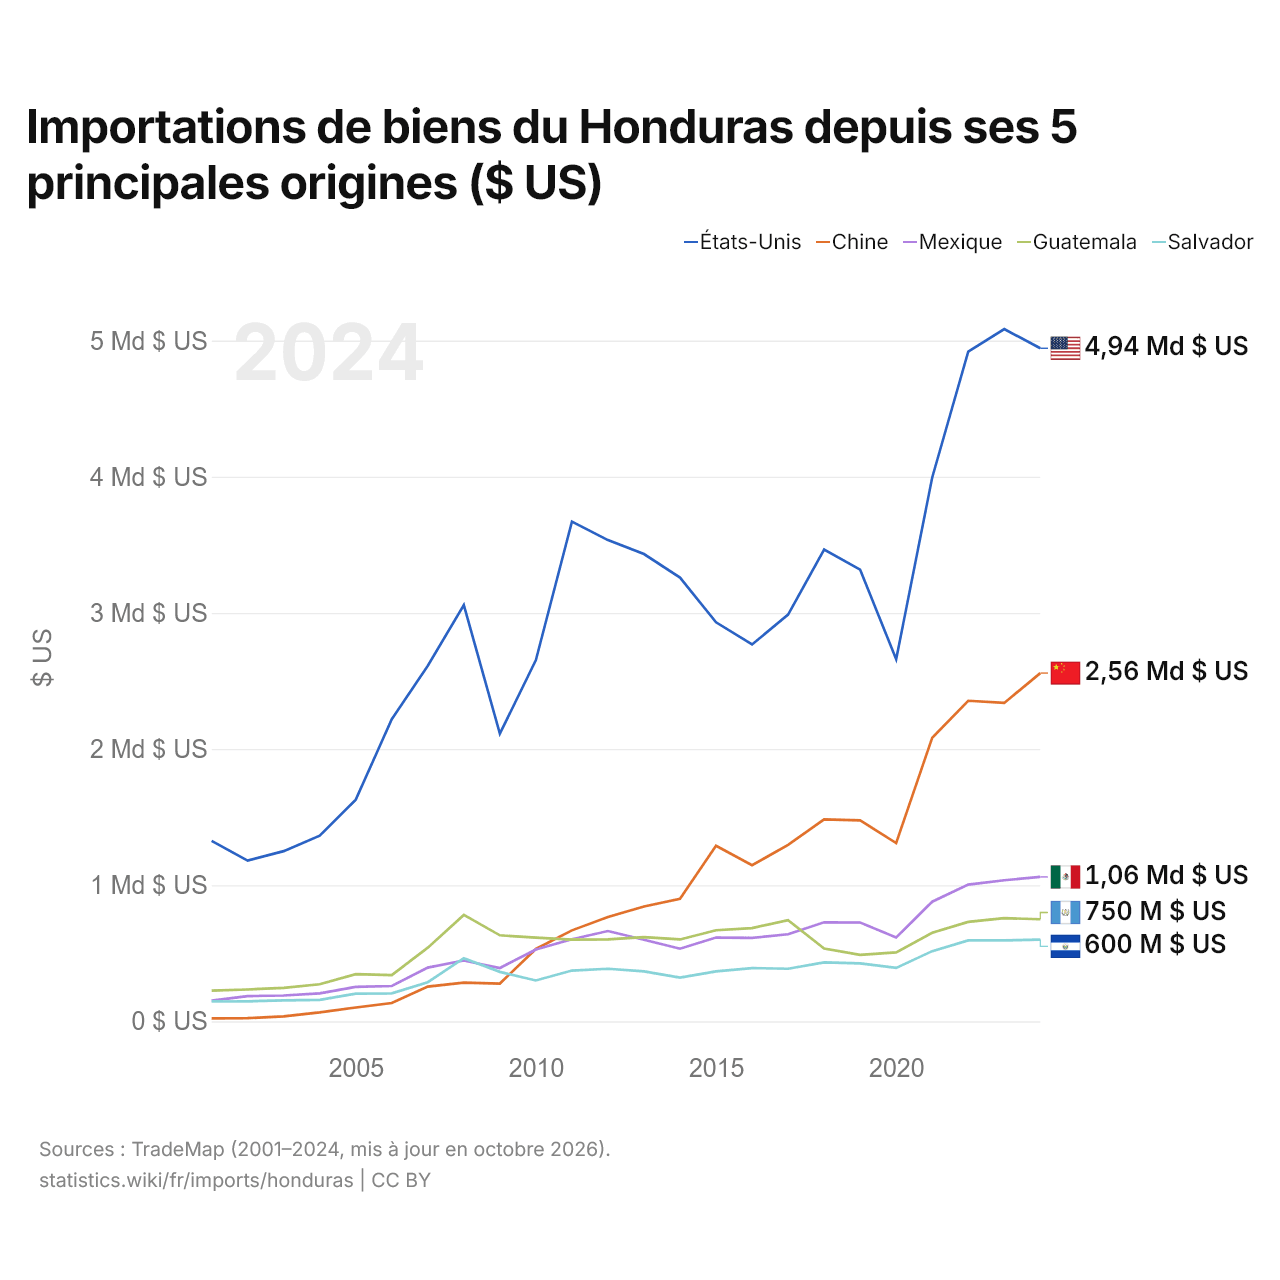
Importations de biens du Honduras depuis ses 5 principales origines ($ US)
| Année | $ US | ||||
|---|---|---|---|---|---|
| États-Unis | Chine | Mexique | Guatemala | Salvador | |
| 2024 | 4 943 700 000 $ US | 2 557 839 000 $ US | 1 060 607 000 $ US | 749 961 000 $ US | 600 358 000 $ US |
| 2023 | 5 084 213 000 $ US | 2 338 466 000 $ US | 1 036 283 000 $ US | 757 829 000 $ US | 594 974 000 $ US |
| 2022 | 4 919 451 000 $ US | 2 354 488 000 $ US | 1 003 954 000 $ US | 730 707 000 $ US | 594 088 000 $ US |
| 2021 | 3 994 778 000 $ US | 2 083 173 000 $ US | 878 912 000 $ US | 650 280 000 $ US | 515 553 000 $ US |
| 2020 | 2 659 488 000 $ US | 1 309 544 000 $ US | 615 274 000 $ US | 506 671 000 $ US | 392 790 000 $ US |
| 2019 | 3 317 690 000 $ US | 1 475 811 000 $ US | 725 860 000 $ US | 487 660 000 $ US | 425 939 000 $ US |
| 2018 | 3 464 852 000 $ US | 1 483 477 000 $ US | 727 337 000 $ US | 535 028 000 $ US | 432 702 000 $ US |
| 2017 | 2 987 364 000 $ US | 1 296 038 000 $ US | 639 566 000 $ US | 742 972 000 $ US | 386 263 000 $ US |
| 2016 | 2 767 977 000 $ US | 1 146 369 000 $ US | 612 565 000 $ US | 685 009 000 $ US | 391 315 000 $ US |
| 2015 | 2 930 670 000 $ US | 1 289 157 000 $ US | 615 186 000 $ US | 669 119 000 $ US | 366 931 000 $ US |
| 2014 | 3 259 438 000 $ US | 900 222 000 $ US | 533 304 000 $ US | 601 485 000 $ US | 321 303 000 $ US |
| 2013 | 3 432 417 000 $ US | 843 779 000 $ US | 599 687 000 $ US | 618 819 000 $ US | 367 325 000 $ US |
| 2012 | 3 534 694 000 $ US | 766 968 000 $ US | 663 486 000 $ US | 602 170 000 $ US | 386 506 000 $ US |
| 2011 | 3 670 458 000 $ US | 668 127 000 $ US | 603 268 000 $ US | 599 982 000 $ US | 372 774 000 $ US |
| 2010 | 2 653 454 000 $ US | 531 751 000 $ US | 527 269 000 $ US | 614 760 000 $ US | 300 429 000 $ US |
| 2009 | 2 112 565 000 $ US | 277 645 000 $ US | 391 481 000 $ US | 631 831 000 $ US | 363 416 000 $ US |
| 2008 | 3 057 611 000 $ US | 284 601 000 $ US | 446 602 000 $ US | 781 543 000 $ US | 463 958 000 $ US |
| 2007 | 2 611 706 000 $ US | 254 798 000 $ US | 394 470 000 $ US | 540 830 000 $ US | 287 115 000 $ US |
| 2006 | 2 218 510 000 $ US | 134 495 000 $ US | 259 322 000 $ US | 339 981 000 $ US | 205 817 000 $ US |
| 2005 | 1 628 232 000 $ US | 101 937 000 $ US | 253 121 000 $ US | 346 490 000 $ US | 203 087 000 $ US |
| 2004 | 1 363 433 000 $ US | 66 204 000 $ US | 205 689 000 $ US | 272 217 000 $ US | 157 811 000 $ US |
| 2003 | 1 250 113 000 $ US | 36 772 000 $ US | 189 537 000 $ US | 245 871 000 $ US | 153 436 000 $ US |
| 2002 | 1 180 159 000 $ US | 23 372 000 $ US | 185 065 000 $ US | 233 953 000 $ US | 146 887 000 $ US |
| 2001 | 1 325 177 000 $ US | 22 023 000 $ US | 151 879 000 $ US | 226 012 000 $ US | 145 517 000 $ US |
Les importations de biens s'élèvent à 4,94 milliards de dollars en provenance des États-Unis (2024), 2,56 milliards de dollars en provenance de la Chine (2024), 1,06 milliard de dollars en provenance du Mexique (2024), 750 millions de dollars en provenance du Guatemala (2024) et 600 millions de dollars en provenance du Salvador (2024). Le premier rang des cinq fournisseurs du Honduras est occupé par les États-Unis chaque année depuis 2001. Le changement le plus récent dans leur ordre remonte à 2018, quand les importations du Honduras en provenance du Mexique ont dépassé celles en provenance du Guatemala.
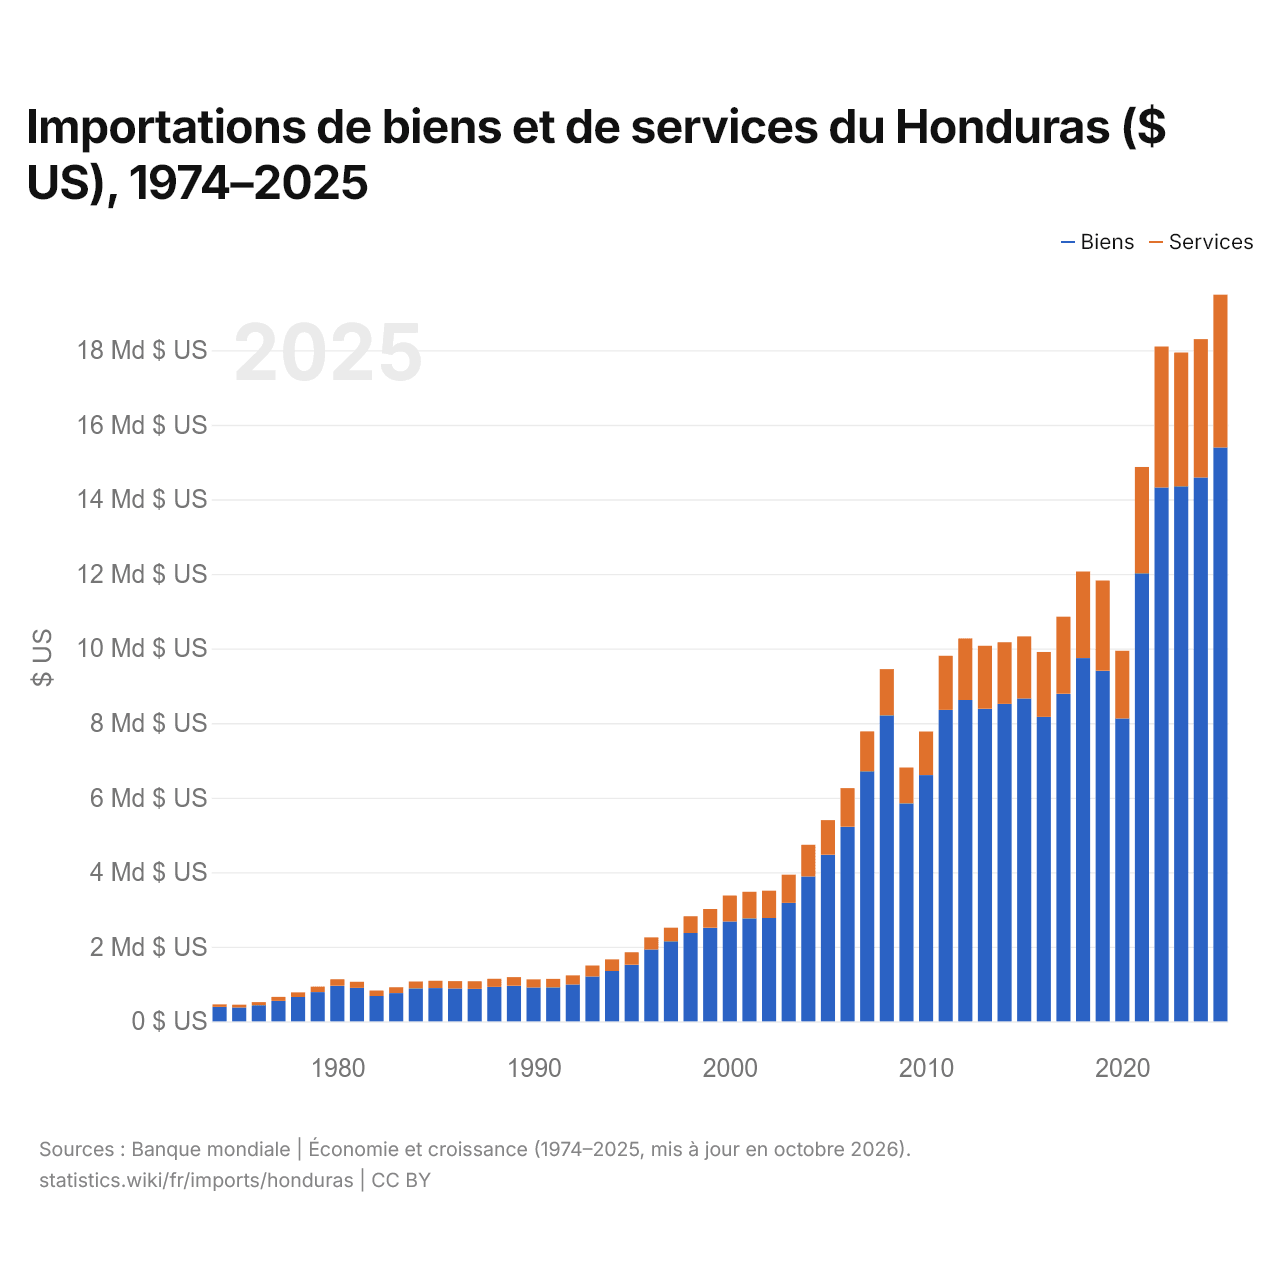
Importations de biens et de services du Honduras ($ US), 1974–2025
| Année | $ US | |
|---|---|---|
| Biens | Services | |
| 2025 | 15 392 664 837 $ US | 4 097 911 409 $ US |
| 2024 | 14 587 948 563 $ US | 3 709 018 245 $ US |
| 2023 | 14 351 873 091 $ US | 3 585 549 415 $ US |
| 2022 | 14 320 136 299 $ US | 3 780 795 929 $ US |
| 2021 | 12 018 881 831 $ US | 2 850 484 024 $ US |
| 2020 | 8 123 184 613 $ US | 1 816 700 510 $ US |
| 2019 | 9 405 698 554 $ US | 2 419 221 605 $ US |
| 2018 | 9 741 564 354 $ US | 2 324 820 836 $ US |
| 2017 | 8 786 637 435 $ US | 2 066 692 433 $ US |
| 2016 | 8 166 376 152 $ US | 1 740 812 282 $ US |
| 2015 | 8 659 659 366 $ US | 1 665 686 902 $ US |
| 2014 | 8 514 572 990 $ US | 1 653 748 027 $ US |
| 2013 | 8 384 481 062 $ US | 1 689 176 462 $ US |
| 2012 | 8 620 119 101 $ US | 1 649 734 962 $ US |
| 2011 | 8 355 941 673 $ US | 1 447 890 013 $ US |
| 2010 | 6 605 737 887 $ US | 1 169 457 798 $ US |
| 2009 | 5 845 153 889 $ US | 964 461 236 $ US |
| 2008 | 8 208 651 808 $ US | 1 239 058 011 $ US |
| 2007 | 6 707 189 163 $ US | 1 069 230 290 $ US |
| 2006 | 5 218 890 296 $ US | 1 035 866 464 $ US |
| 2005 | 4 468 269 511 $ US | 929 438 682 $ US |
| 2004 | 3 885 702 481 $ US | 849 536 503 $ US |
| 2003 | 3 179 124 764 $ US | 755 806 172 $ US |
| 2002 | 2 772 862 811 $ US | 732 222 210 $ US |
| 2001 | 2 761 168 312 $ US | 712 511 125 $ US |
| 2000 | 2 679 944 500 $ US | 693 838 927 $ US |
| 1999 | 2 509 600 000 $ US | 502 400 000 $ US |
| 1998 | 2 370 500 000 $ US | 446 800 000 $ US |
| 1997 | 2 148 500 000 $ US | 362 800 000 $ US |
| 1996 | 1 924 100 000 $ US | 329 500 000 $ US |
| 1995 | 1 518 600 000 $ US | 333 700 000 $ US |
| 1994 | 1 351 100 000 $ US | 311 000 000 $ US |
| 1993 | 1 203 100 000 $ US | 294 700 000 $ US |
| 1992 | 990 200 000 $ US | 243 200 000 $ US |
| 1991 | 912 500 000 $ US | 226 700 000 $ US |
| 1990 | 907 000 000 $ US | 219 800 000 $ US |
| 1989 | 955 700 000 $ US | 230 500 000 $ US |
| 1988 | 923 400 000 $ US | 217 500 000 $ US |
| 1987 | 871 400 000 $ US | 202 430 000 $ US |
| 1986 | 879 500 000 $ US | 198 600 000 $ US |
| 1985 | 891 700 000 $ US | 195 300 000 $ US |
| 1984 | 884 800 000 $ US | 183 150 000 $ US |
| 1983 | 756 250 000 $ US | 158 350 000 $ US |
| 1982 | 680 700 000 $ US | 144 250 000 $ US |
| 1981 | 898 600 000 $ US | 163 650 000 $ US |
| 1980 | 954 050 000 $ US | 173 950 000 $ US |
| 1979 | 783 450 000 $ US | 148 200 000 $ US |
| 1978 | 654 500 000 $ US | 123 100 000 $ US |
| 1977 | 550 100 000 $ US | 105 400 000 $ US |
| 1976 | 432 450 000 $ US | 82 150 000 $ US |
| 1975 | 372 350 000 $ US | 73 750 000 $ US |
| 1974 | 387 500 000 $ US | 68 300 000 $ US |
En 2025, les importations de biens du Honduras s'élevaient à 15,4 milliards de dollars et celles de services à 4,1 milliards de dollars ; les services représentaient 21,0 % du total, contre 15,0 % en 1974.
Le Honduras dans le classement mondial des importations, 2025
| Rang | Pays | Importations | Part mondiale | |
|---|---|---|---|---|
| 87 |
 Éthiopie |
25,5 Md $US | 0,08 % | |
| 88 |
 Sri Lanka |
24,9 Md $US | 0,07 % | |
| 89 |
 Côte d’Ivoire |
24,7 Md $US | 0,07 % | |
| 90 |
 Honduras |
22,4 Md $US | 0,07 % | |
| 91 |
Salvador
|
20,6 Md $US | 0,06 % | vs Salvador |
| 92 |
 Géorgie |
20,3 Md $US | 0,06 % | |
| 93 |
 Paraguay |
19,4 Md $US | 0,06 % |
Importations de biens et services du Honduras, % du PIB, 1960–2025
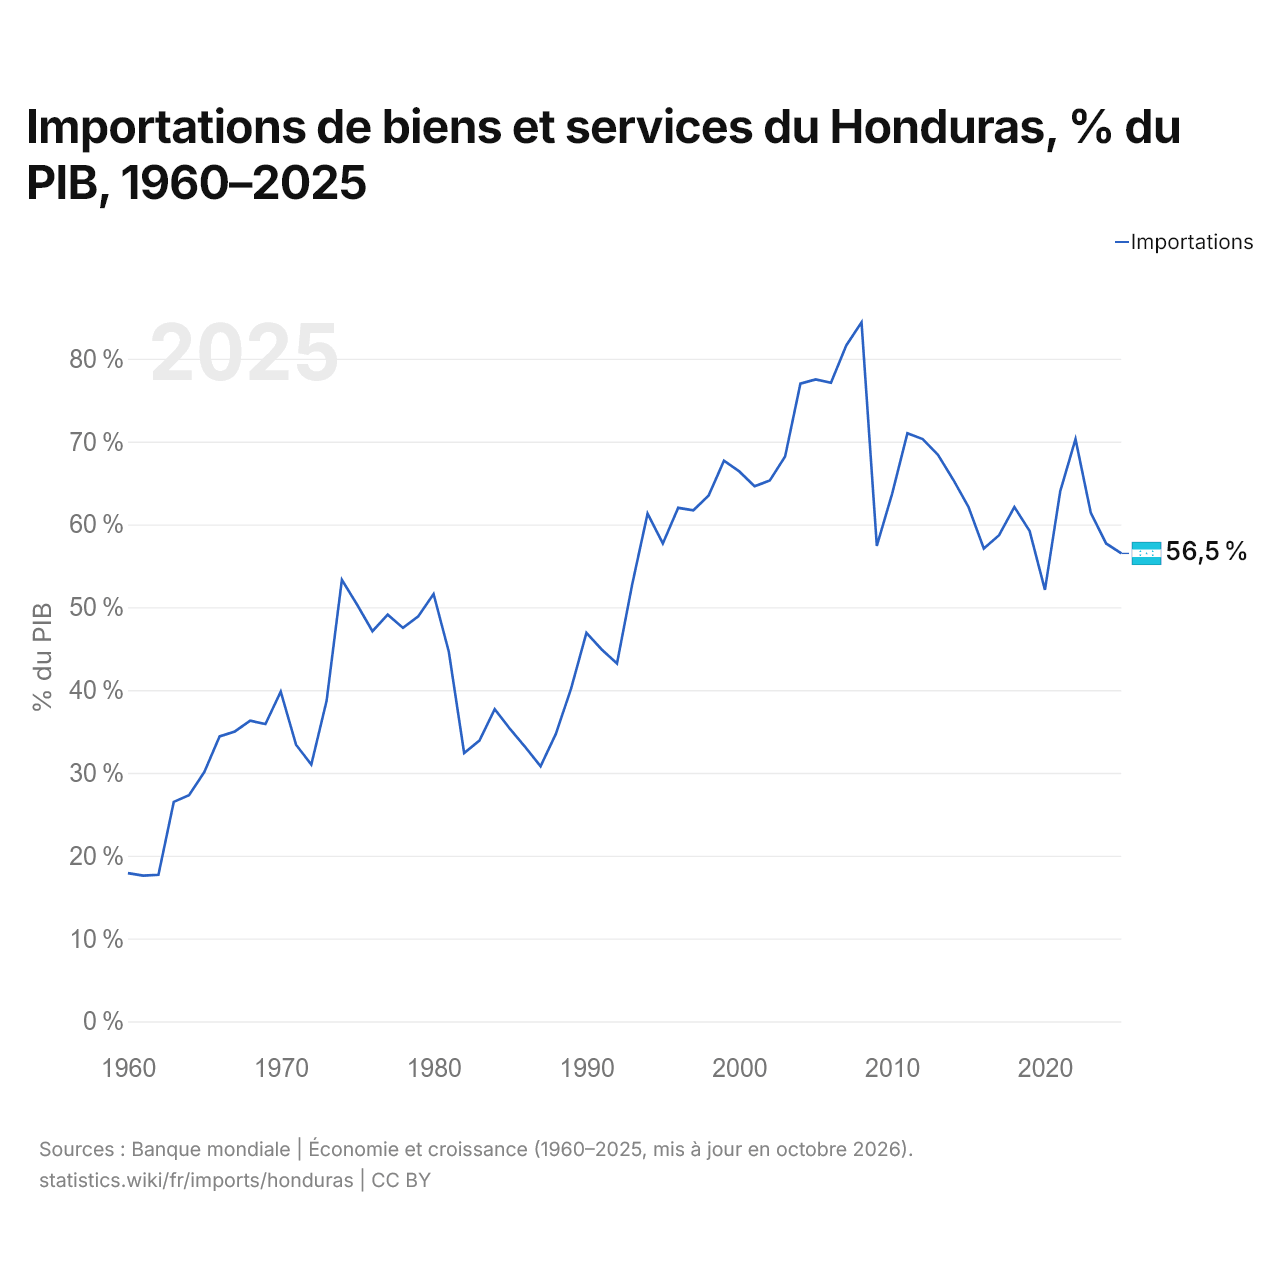
En 2025, les importations de biens et services du Honduras équivalaient à 56,5 % de son PIB, contre 17,9 % en 1960. La part la plus élevée a été de 84,4 %, en 2008.
Comparer les importations du Honduras avec celles d'autres pays
Sources :
- Banque mondiale | Économie et croissance (1960–2025, mis à jour en octobre 2026)
- TradeMap (2001–2024, mis à jour en octobre 2026)
Creative Commons Attribution (CC BY) : vous pouvez copier, partager, adapter et réutiliser ce contenu, y compris à des fins commerciales, à condition de citer statistics.wiki et d’indiquer les modifications apportées. Les sources citées ci-dessus peuvent avoir leurs propres conditions de licence.