
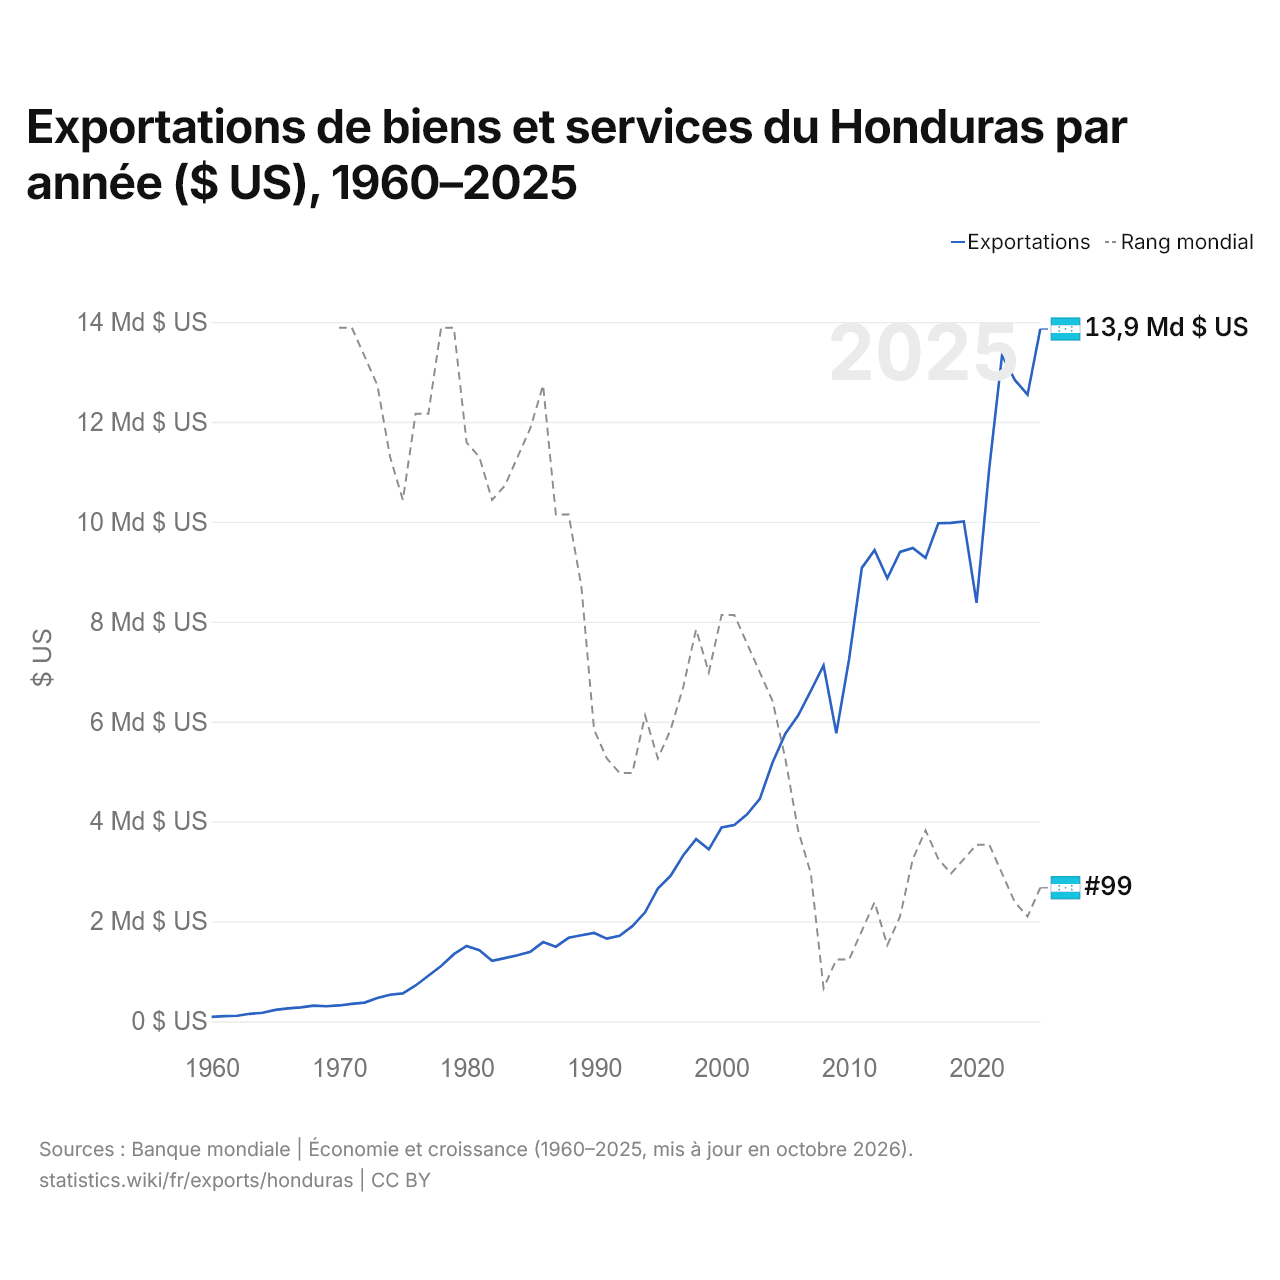
Exportations de biens et services du Honduras par année ($ US), 1960–2025
| Année | $ US | Rang mondial |
|---|---|---|
| Exportations | Rang mondial | |
| 2025 | 13 857 222 810 $ US | #99 |
| 2024 | 12 544 270 435 $ US | #101 |
| 2023 | 12 838 311 191 $ US | #100 |
| 2022 | 13 336 955 013 $ US | #98 |
| 2021 | 11 079 128 213 $ US | #96 |
| 2020 | 8 377 646 121 $ US | #96 |
| 2019 | 10 007 263 183 $ US | #97 |
| 2018 | 9 977 241 928 $ US | #98 |
| 2017 | 9 970 301 124 $ US | #97 |
| 2016 | 9 276 480 535 $ US | #95 |
| 2015 | 9 475 891 625 $ US | #97 |
| 2014 | 9 396 732 040 $ US | #101 |
| 2013 | 8 869 045 891 $ US | #103 |
| 2012 | 9 431 552 770 $ US | #100 |
| 2011 | 9 077 877 620 $ US | #102 |
| 2010 | 7 247 910 834 $ US | #104 |
| 2009 | 5 766 473 848 $ US | #104 |
| 2008 | 7 124 837 294 $ US | #106 |
| 2007 | 6 614 386 799 $ US | #98 |
| 2006 | 6 119 752 691 $ US | #95 |
| 2005 | 5 757 207 468 $ US | #90 |
| 2004 | 5 181 709 224 $ US | #86 |
| 2003 | 4 452 150 158 $ US | #84 |
| 2002 | 4 143 703 819 $ US | #82 |
| 2001 | 3 931 297 278 $ US | #80 |
| 2000 | 3 878 785 429 $ US | #80 |
| 1999 | 3 441 665 505 $ US | #84 |
| 1998 | 3 647 511 078 $ US | #81 |
| 1997 | 3 326 205 323 $ US | #85 |
| 1996 | 2 912 652 027 $ US | #88 |
| 1995 | 2 657 476 538 $ US | #90 |
| 1994 | 2 182 094 948 $ US | #87 |
| 1993 | 1 905 157 993 $ US | #91 |
| 1992 | 1 713 781 626 $ US | #91 |
| 1991 | 1 654 804 672 $ US | #90 |
| 1990 | 1 768 750 000 $ US | #88 |
| 1989 | 1 723 758 621 $ US | #78 |
| 1988 | 1 672 231 760 $ US | #73 |
| 1987 | 1 494 350 000 $ US | #73 |
| 1986 | 1 586 500 000 $ US | #64 |
| 1985 | 1 393 250 000 $ US | #67 |
| 1984 | 1 323 150 000 $ US | #69 |
| 1983 | 1 266 300 000 $ US | #71 |
| 1982 | 1 209 450 000 $ US | #72 |
| 1981 | 1 423 150 000 $ US | #69 |
| 1980 | 1 508 450 000 $ US | #68 |
| 1979 | 1 344 100 000 $ US | #60 |
| 1978 | 1 108 300 000 $ US | #60 |
| 1977 | 911 750 000 $ US | #66 |
| 1976 | 717 650 000 $ US | #66 |
| 1975 | 558 650 000 $ US | #72 |
| 1974 | 531 200 000 $ US | #69 |
| 1973 | 467 449 766 $ US | #64 |
| 1972 | 375 648 310 $ US | #62 |
| 1971 | 349 150 000 $ US | #60 |
| 1970 | 317 950 000 $ US | #60 |
| 1969 | 302 350 000 $ US | - |
| 1968 | 314 550 000 $ US | - |
| 1967 | 279 700 000 $ US | - |
| 1966 | 258 750 000 $ US | - |
| 1965 | 228 900 000 $ US | - |
| 1964 | 171 400 000 $ US | - |
| 1963 | 150 750 000 $ US | - |
| 1962 | 112 000 000 $ US | - |
| 1961 | 105 000 000 $ US | - |
| 1960 | 87 650 000 $ US | - |
En 2025, les exportations de biens et services du Honduras s'élevaient à 13,9 milliards de dollars, contre 87,6 millions de dollars en 1960. Elles se classaient au 99e rang mondial, en hausse par rapport au 101e rang en 2024. Leur meilleur rang a été le 60e, occupé pour la dernière fois en 1979.
En 2025, les exportations de biens et services du Honduras étaient les 15es plus élevées de 27 pays situés en Amérique latine. Les importations de biens et services du Honduras s'élevaient à 22,4 milliards de dollars en 2025, au 90e rang mondial. En 2025, les importations du Honduras dépassaient ses exportations de 8,52 milliards de dollars, soit un déficit commercial.
Exportations de biens du Honduras par catégorie
Exportations de biens, 2024: 6,97 Md $US
La première catégorie des exportations de biens du Honduras est « cultures, plantes et fleurs (céréales, fruits, légumes, café, oléagineux) », avec 26,9 %, suivie de « machines, électronique et véhicules », avec 21,8 %.
Destinations des exportations de biens du Honduras : les 10 premières
| Rang | Pays | Exportations de biens | Part | |
|---|---|---|---|---|
| 1 |
 États-Unis |
3,26 Md $US | 46,8 % | |
| 2 |
 Salvador |
473 M $US | 6,79 % | vs Salvador |
| 3 |
 Guatemala |
467 M $US | 6,7 % | vs Guatemala |
| 4 |
 Nicaragua |
382 M $US | 5,48 % | |
| 5 |
 Mexique |
338 M $US | 4,84 % | vs Mexique |
| 6 |
 Allemagne |
266 M $US | 3,82 % | |
| 7 |
 Pays-Bas |
171 M $US | 2,45 % | |
| 8 |
 Belgique |
165 M $US | 2,37 % | |
| 9 |
 Italie |
148 M $US | 2,12 % | |
| 10 |
 Costa Rica |
142 M $US | 2,03 % | |
| Autres partenaires et non précisés | 1,16 Md $US | 16,6 % |
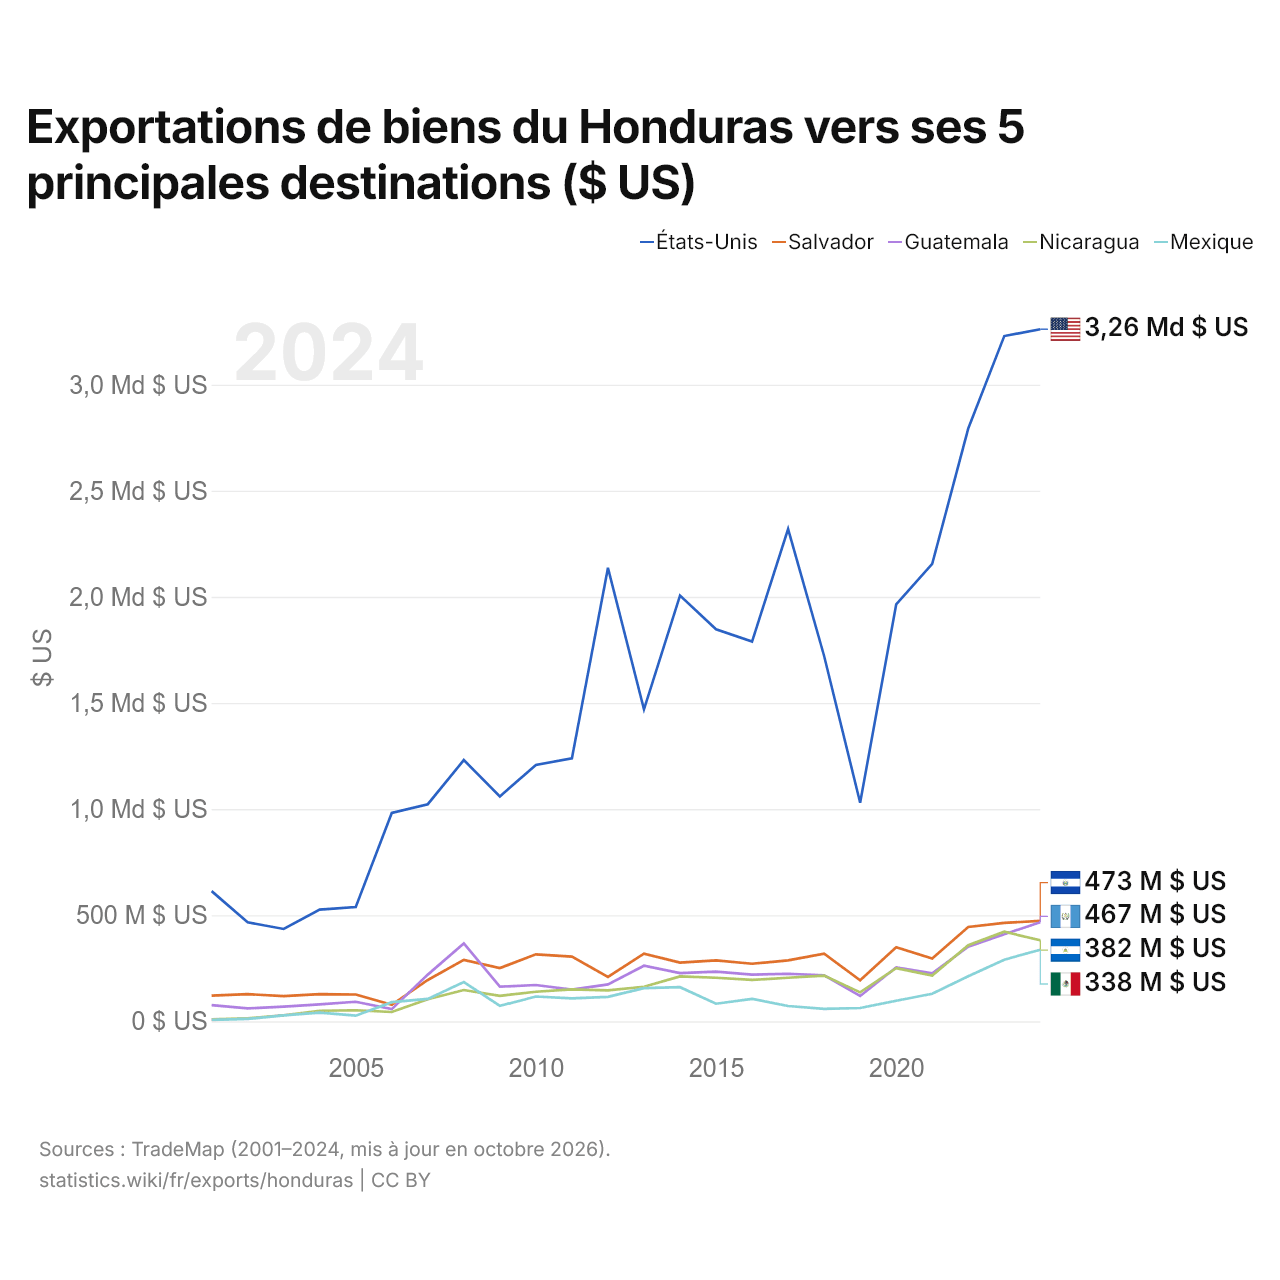
Exportations de biens du Honduras vers ses 5 principales destinations ($ US)
| Année | $ US | ||||
|---|---|---|---|---|---|
| États-Unis | Salvador | Guatemala | Nicaragua | Mexique | |
| 2024 | 3 261 183 000 $ US | 473 046 000 $ US | 466 974 000 $ US | 382 046 000 $ US | 337 568 000 $ US |
| 2023 | 3 228 891 000 $ US | 464 051 000 $ US | 410 412 000 $ US | 422 111 000 $ US | 290 499 000 $ US |
| 2022 | 2 793 161 000 $ US | 444 527 000 $ US | 351 832 000 $ US | 358 558 000 $ US | 212 286 000 $ US |
| 2021 | 2 155 135 000 $ US | 295 852 000 $ US | 226 343 000 $ US | 215 641 000 $ US | 129 754 000 $ US |
| 2020 | 1 964 247 000 $ US | 349 456 000 $ US | 254 270 000 $ US | 250 824 000 $ US | 97 288 000 $ US |
| 2019 | 1 029 911 000 $ US | 193 258 000 $ US | 119 627 000 $ US | 136 533 000 $ US | 63 021 000 $ US |
| 2018 | 1 721 396 000 $ US | 318 714 000 $ US | 216 563 000 $ US | 215 669 000 $ US | 58 655 000 $ US |
| 2017 | 2 319 594 000 $ US | 287 468 000 $ US | 224 091 000 $ US | 205 304 000 $ US | 72 092 000 $ US |
| 2016 | 1 789 375 000 $ US | 271 410 000 $ US | 219 763 000 $ US | 194 996 000 $ US | 105 972 000 $ US |
| 2015 | 1 847 263 000 $ US | 287 280 000 $ US | 234 536 000 $ US | 205 513 000 $ US | 83 002 000 $ US |
| 2014 | 2 006 406 000 $ US | 276 889 000 $ US | 227 199 000 $ US | 211 808 000 $ US | 161 033 000 $ US |
| 2013 | 1 470 220 000 $ US | 319 078 000 $ US | 262 202 000 $ US | 162 680 000 $ US | 156 278 000 $ US |
| 2012 | 2 136 639 000 $ US | 208 994 000 $ US | 174 328 000 $ US | 145 662 000 $ US | 115 469 000 $ US |
| 2011 | 1 239 533 000 $ US | 304 741 000 $ US | 149 512 000 $ US | 150 618 000 $ US | 107 971 000 $ US |
| 2010 | 1 208 217 000 $ US | 315 716 000 $ US | 171 329 000 $ US | 139 320 000 $ US | 117 011 000 $ US |
| 2009 | 1 059 558 000 $ US | 250 873 000 $ US | 163 173 000 $ US | 120 297 000 $ US | 72 806 000 $ US |
| 2008 | 1 231 139 000 $ US | 289 444 000 $ US | 367 293 000 $ US | 147 588 000 $ US | 184 797 000 $ US |
| 2007 | 1 023 037 000 $ US | 194 857 000 $ US | 220 150 000 $ US | 104 283 000 $ US | 105 879 000 $ US |
| 2006 | 981 604 000 $ US | 78 049 000 $ US | 57 274 000 $ US | 44 041 000 $ US | 90 286 000 $ US |
| 2005 | 538 618 000 $ US | 126 377 000 $ US | 92 240 000 $ US | 52 394 000 $ US | 26 847 000 $ US |
| 2004 | 526 276 000 $ US | 128 195 000 $ US | 79 570 000 $ US | 49 767 000 $ US | 40 879 000 $ US |
| 2003 | 435 186 000 $ US | 119 152 000 $ US | 69 196 000 $ US | 28 562 000 $ US | 27 770 000 $ US |
| 2002 | 466 393 000 $ US | 128 047 000 $ US | 61 051 000 $ US | 14 231 000 $ US | 11 464 000 $ US |
| 2001 | 613 414 000 $ US | 121 481 000 $ US | 76 506 000 $ US | 9 230 000 $ US | 6 618 000 $ US |
Les exportations de biens s'élèvent à 3,26 milliards de dollars vers les États-Unis (2024), 473 millions de dollars vers le Salvador (2024), 467 millions de dollars vers le Guatemala (2024), 382 millions de dollars vers le Nicaragua (2024) et 338 millions de dollars vers le Mexique (2024). Le premier rang des cinq destinations du Honduras est occupé par les États-Unis chaque année depuis 2001. Le changement le plus récent dans leur ordre remonte à 2024, quand les exportations du Honduras vers le Guatemala ont dépassé celles vers le Nicaragua.
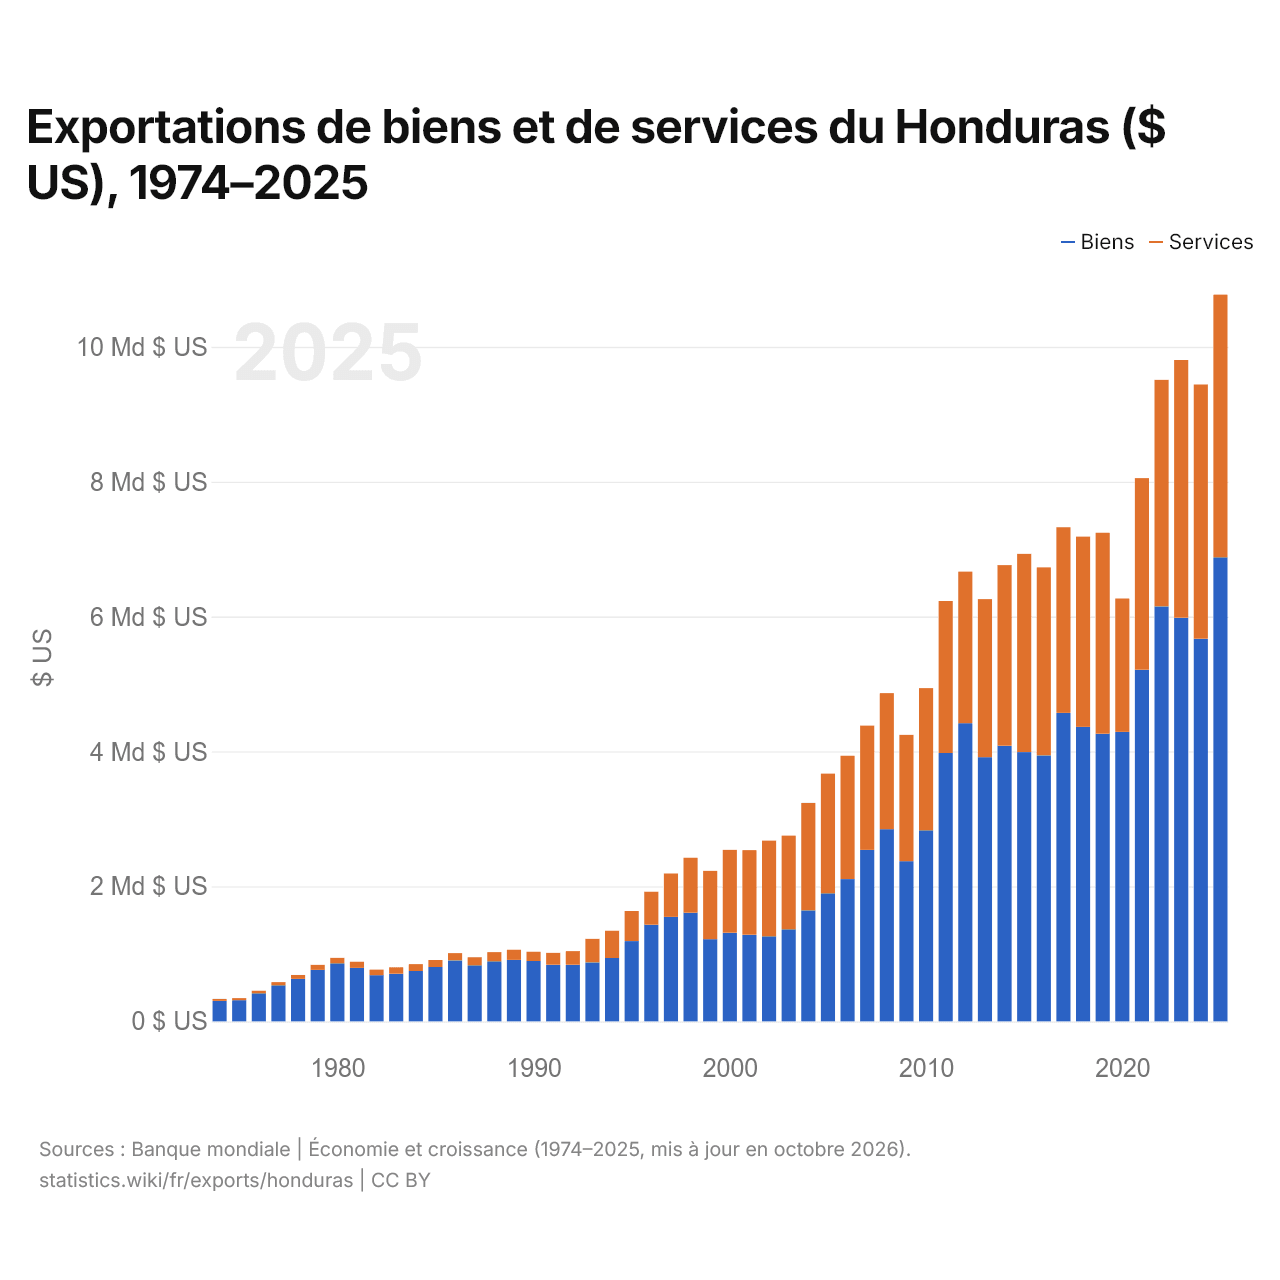
Exportations de biens et de services du Honduras ($ US), 1974–2025
| Année | $ US | |
|---|---|---|
| Biens | Services | |
| 2025 | 6 879 758 905 $ US | 3 893 248 524 $ US |
| 2024 | 5 673 307 366 $ US | 3 768 747 621 $ US |
| 2023 | 5 985 151 252 $ US | 3 819 368 806 $ US |
| 2022 | 6 149 924 231 $ US | 3 360 110 541 $ US |
| 2021 | 5 213 755 773 $ US | 2 838 427 742 $ US |
| 2020 | 4 291 559 021 $ US | 1 977 260 074 $ US |
| 2019 | 4 265 179 405 $ US | 2 977 815 805 $ US |
| 2018 | 4 365 091 335 $ US | 2 821 283 774 $ US |
| 2017 | 4 573 643 423 $ US | 2 751 413 283 $ US |
| 2016 | 3 940 383 961 $ US | 2 789 070 082 $ US |
| 2015 | 3 991 554 376 $ US | 2 939 714 171 $ US |
| 2014 | 4 087 751 951 $ US | 2 676 419 050 $ US |
| 2013 | 3 915 824 469 $ US | 2 343 041 686 $ US |
| 2012 | 4 419 765 998 $ US | 2 247 143 902 $ US |
| 2011 | 3 977 560 167 $ US | 2 253 952 809 $ US |
| 2010 | 2 831 735 681 $ US | 2 107 575 496 $ US |
| 2009 | 2 375 026 869 $ US | 1 871 407 828 $ US |
| 2008 | 2 848 173 165 $ US | 2 017 044 806 $ US |
| 2007 | 2 542 674 037 $ US | 1 841 551 787 $ US |
| 2006 | 2 108 748 546 $ US | 1 828 574 587 $ US |
| 2005 | 1 898 017 953 $ US | 1 773 844 173 $ US |
| 2004 | 1 645 233 030 $ US | 1 592 474 561 $ US |
| 2003 | 1 364 490 593 $ US | 1 388 286 505 $ US |
| 2002 | 1 260 374 972 $ US | 1 418 037 970 $ US |
| 2001 | 1 284 495 948 $ US | 1 253 311 950 $ US |
| 2000 | 1 314 705 270 $ US | 1 228 130 800 $ US |
| 1999 | 1 217 800 000 $ US | 1 012 600 000 $ US |
| 1998 | 1 611 900 000 $ US | 813 100 000 $ US |
| 1997 | 1 548 600 000 $ US | 642 800 000 $ US |
| 1996 | 1 434 500 000 $ US | 487 200 000 $ US |
| 1995 | 1 189 700 000 $ US | 445 100 000 $ US |
| 1994 | 939 500 000 $ US | 404 400 000 $ US |
| 1993 | 872 800 000 $ US | 350 700 000 $ US |
| 1992 | 839 300 000 $ US | 202 000 000 $ US |
| 1991 | 840 600 000 $ US | 175 000 000 $ US |
| 1990 | 895 200 000 $ US | 137 300 000 $ US |
| 1989 | 911 200 000 $ US | 149 700 000 $ US |
| 1988 | 889 450 000 $ US | 136 400 000 $ US |
| 1987 | 830 500 000 $ US | 119 650 000 $ US |
| 1986 | 902 100 000 $ US | 109 600 000 $ US |
| 1985 | 805 650 000 $ US | 103 750 000 $ US |
| 1984 | 746 200 000 $ US | 101 150 000 $ US |
| 1983 | 707 200 000 $ US | 93 800 000 $ US |
| 1982 | 685 050 000 $ US | 81 900 000 $ US |
| 1981 | 792 950 000 $ US | 90 600 000 $ US |
| 1980 | 860 100 000 $ US | 81 500 000 $ US |
| 1979 | 763 750 000 $ US | 74 250 000 $ US |
| 1978 | 631 200 000 $ US | 56 200 000 $ US |
| 1977 | 534 400 000 $ US | 46 250 000 $ US |
| 1976 | 415 500 000 $ US | 38 200 000 $ US |
| 1975 | 313 100 000 $ US | 31 250 000 $ US |
| 1974 | 303 950 000 $ US | 27 900 000 $ US |
En 2025, les exportations de biens du Honduras s'élevaient à 6,88 milliards de dollars et celles de services à 3,89 milliards de dollars ; les services représentaient 36,1 % du total, contre 8,4 % en 1974.
Le Honduras dans le classement mondial des exportations, 2025
| Rang | Pays | Exportations | Part mondiale | |
|---|---|---|---|---|
| 96 |
 Islande |
15,5 Md $US | 0,04 % | |
| 97 |
 Venezuela |
14,9 Md $US | 0,04 % | vs Venezuela |
| 98 |
 Arménie |
14,1 Md $US | 0,04 % | |
| 99 |
 Honduras |
13,9 Md $US | 0,04 % | |
| 100 |
 Guyana |
13,7 Md $US (2023) | 0,04 % | |
| 101 |
 Papouasie |
13,5 Md $US (2024) | 0,04 % | |
| 102 |
 Bosnie-Herzégovine |
13,4 Md $US | 0,04 % |
Exportations de biens et services du Honduras, % du PIB, 1960–2025
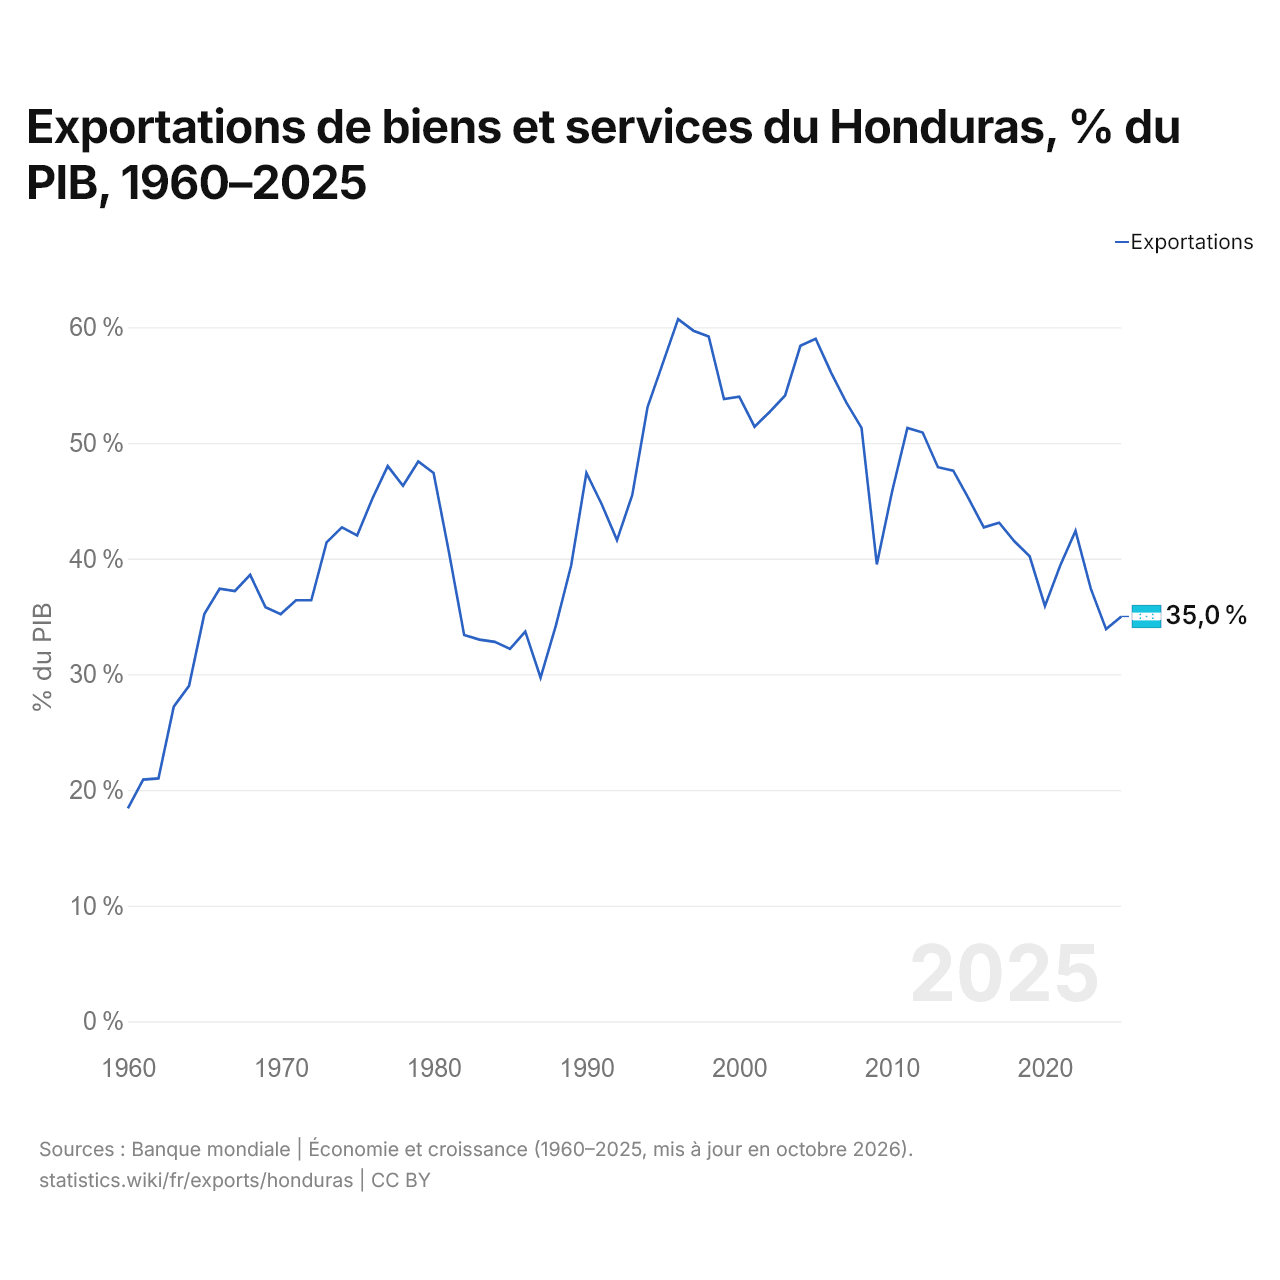
En 2025, les exportations de biens et services du Honduras équivalaient à 35,0 % de son PIB, contre 18,4 % en 1960. La part la plus élevée a été de 60,7 %, en 1996.
Comparer les exportations du Honduras avec celles d'autres pays
Sources :
- Banque mondiale | Économie et croissance (1960–2025, mis à jour en octobre 2026)
- TradeMap (2001–2024, mis à jour en octobre 2026)
Creative Commons Attribution (CC BY) : vous pouvez copier, partager, adapter et réutiliser ce contenu, y compris à des fins commerciales, à condition de citer statistics.wiki et d’indiquer les modifications apportées. Les sources citées ci-dessus peuvent avoir leurs propres conditions de licence.