
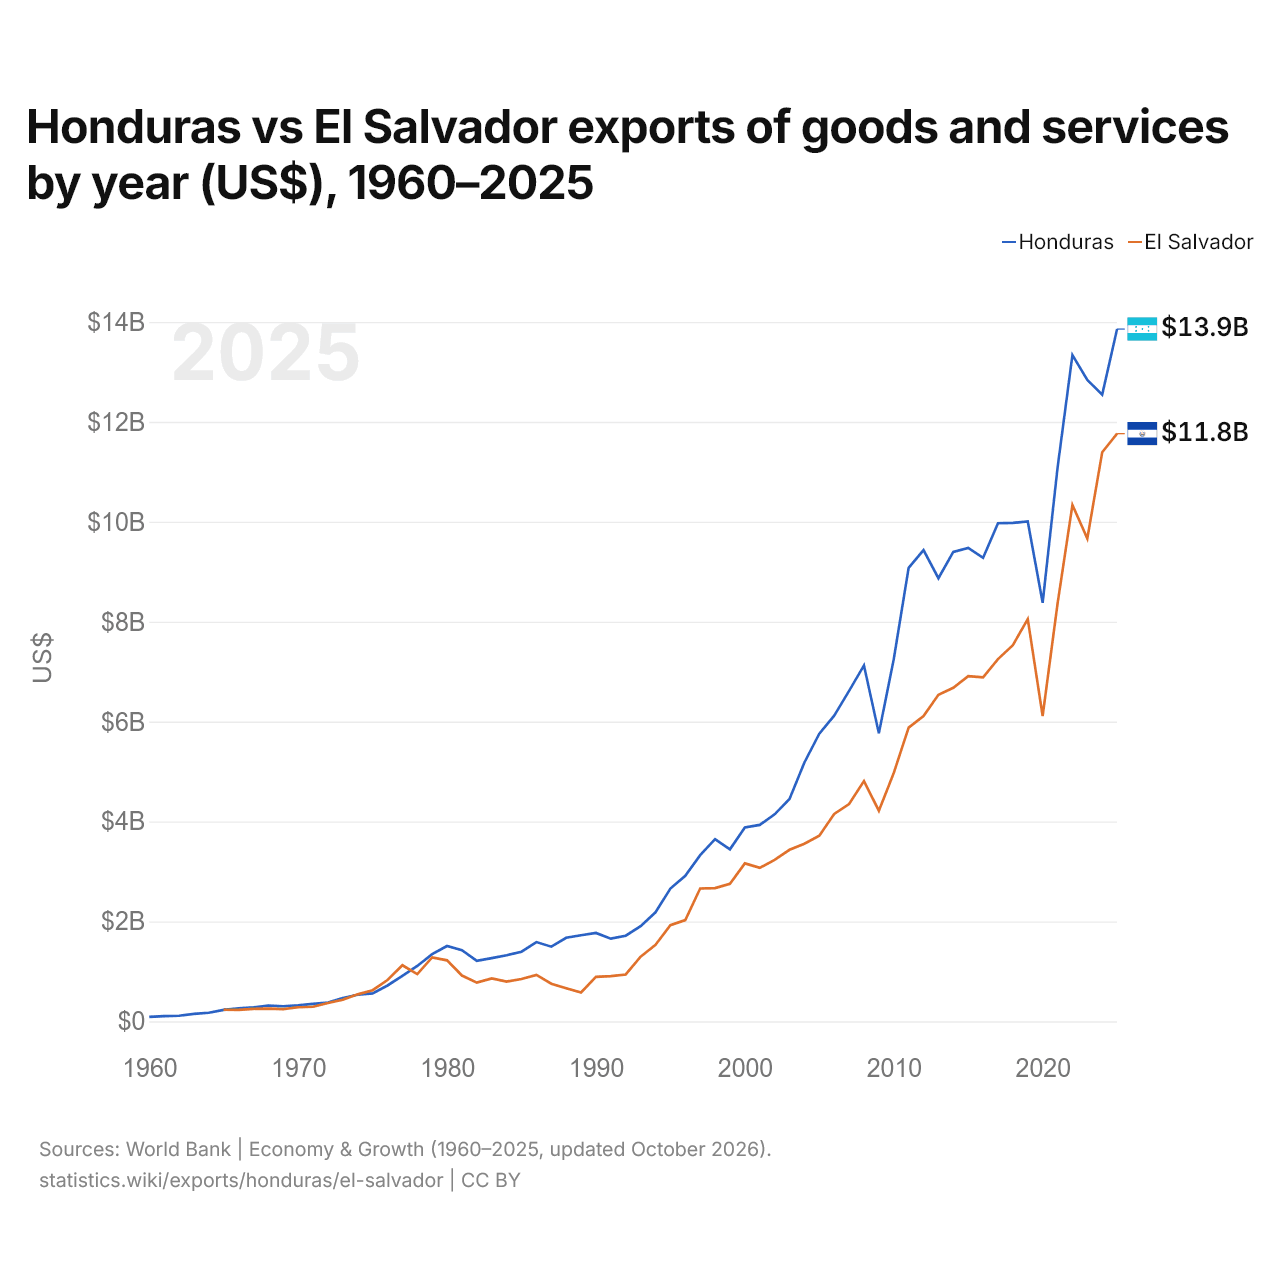
Honduras vs Salvador : exportations de biens et services par année ($ US), 1960–2025
| Année | $ US | |
|---|---|---|
 Honduras |
 Salvador |
|
| 2025 | 13 857 222 810 $ US | 11 763 690 000 $ US |
| 2024 | 12 544 270 435 $ US | 11 391 670 000 $ US |
| 2023 | 12 838 311 191 $ US | 9 664 110 000 $ US |
| 2022 | 13 336 955 013 $ US | 10 336 590 000 $ US |
| 2021 | 11 079 128 213 $ US | 8 359 050 000 $ US |
| 2020 | 8 377 646 121 $ US | 6 112 370 000 $ US |
| 2019 | 10 007 263 183 $ US | 8 052 490 000 $ US |
| 2018 | 9 977 241 928 $ US | 7 528 970 000 $ US |
| 2017 | 9 970 301 124 $ US | 7 251 400 000 $ US |
| 2016 | 9 276 480 535 $ US | 6 884 540 000 $ US |
| 2015 | 9 475 891 625 $ US | 6 911 040 000 $ US |
| 2014 | 9 396 732 040 $ US | 6 677 020 000 $ US |
| 2013 | 8 869 045 891 $ US | 6 536 790 000 $ US |
| 2012 | 9 431 552 770 $ US | 6 110 250 000 $ US |
| 2011 | 9 077 877 620 $ US | 5 878 600 000 $ US |
| 2010 | 7 247 910 834 $ US | 4 971 100 000 $ US |
| 2009 | 5 766 473 848 $ US | 4 215 800 000 $ US |
| 2008 | 7 124 837 294 $ US | 4 809 800 000 $ US |
| 2007 | 6 614 386 799 $ US | 4 349 400 000 $ US |
| 2006 | 6 119 752 691 $ US | 4 150 320 000 $ US |
| 2005 | 5 757 207 468 $ US | 3 713 680 000 $ US |
| 2004 | 5 181 709 224 $ US | 3 555 578 400 $ US |
| 2003 | 4 452 150 158 $ US | 3 433 269 900 $ US |
| 2002 | 4 143 703 819 $ US | 3 231 026 200 $ US |
| 2001 | 3 931 297 278 $ US | 3 071 774 700 $ US |
| 2000 | 3 878 785 429 $ US | 3 161 574 400 $ US |
| 1999 | 3 441 665 505 $ US | 2 752 938 000 $ US |
| 1998 | 3 647 511 078 $ US | 2 667 080 400 $ US |
| 1997 | 3 326 205 323 $ US | 2 659 875 600 $ US |
| 1996 | 2 912 652 027 $ US | 2 026 644 400 $ US |
| 1995 | 2 657 476 538 $ US | 1 923 081 200 $ US |
| 1994 | 2 182 094 948 $ US | 1 529 942 400 $ US |
| 1993 | 1 905 157 993 $ US | 1 294 122 000 $ US |
| 1992 | 1 713 781 626 $ US | 937 870 800 $ US |
| 1991 | 1 654 804 672 $ US | 904 756 600 $ US |
| 1990 | 1 768 750 000 $ US | 891 100 175 $ US |
| 1989 | 1 723 758 621 $ US | 578 784 600 $ US |
| 1988 | 1 672 231 760 $ US | 662 448 600 $ US |
| 1987 | 1 494 350 000 $ US | 751 724 100 $ US |
| 1986 | 1 586 500 000 $ US | 930 400 000 $ US |
| 1985 | 1 393 250 000 $ US | 848 385 400 $ US |
| 1984 | 1 323 150 000 $ US | 796 567 700 $ US |
| 1983 | 1 266 300 000 $ US | 858 652 600 $ US |
| 1982 | 1 209 450 000 $ US | 774 247 000 $ US |
| 1981 | 1 423 150 000 $ US | 917 000 000 $ US |
| 1980 | 1 508 450 000 $ US | 1 220 920 000 $ US |
| 1979 | 1 344 100 000 $ US | 1 280 560 000 $ US |
| 1978 | 1 108 300 000 $ US | 946 719 900 $ US |
| 1977 | 911 750 000 $ US | 1 122 680 000 $ US |
| 1976 | 717 650 000 $ US | 827 560 000 $ US |
| 1975 | 558 650 000 $ US | 622 640 000 $ US |
| 1974 | 531 200 000 $ US | 540 040 000 $ US |
| 1973 | 467 449 766 $ US | 432 120 000 $ US |
| 1972 | 375 648 310 $ US | 367 680 000 $ US |
| 1971 | 349 150 000 $ US | 292 160 000 $ US |
| 1970 | 317 950 000 $ US | 281 360 000 $ US |
| 1969 | 302 350 000 $ US | 243 320 000 $ US |
| 1968 | 314 550 000 $ US | 255 960 000 $ US |
| 1967 | 279 700 000 $ US | 250 280 000 $ US |
| 1966 | 258 750 000 $ US | 229 240 000 $ US |
| 1965 | 228 900 000 $ US | 231 600 000 $ US |
| 1964 | 171 400 000 $ US | - |
| 1963 | 150 750 000 $ US | - |
| 1962 | 112 000 000 $ US | - |
| 1961 | 105 000 000 $ US | - |
| 1960 | 87 650 000 $ US | - |
En 2025, les exportations de biens et services du Honduras s'élevaient à 13,9 milliards de dollars et celles du Salvador à 11,8 milliards de dollars : celles du Honduras étaient supérieures de 18 %. En 1965, les exportations du Salvador étaient supérieures de 1,2 % : 229 millions de dollars pour le Honduras et 232 millions de dollars pour le Salvador.
Les exportations de biens et services du Honduras sont supérieures à celles du Salvador chaque année depuis 1978.
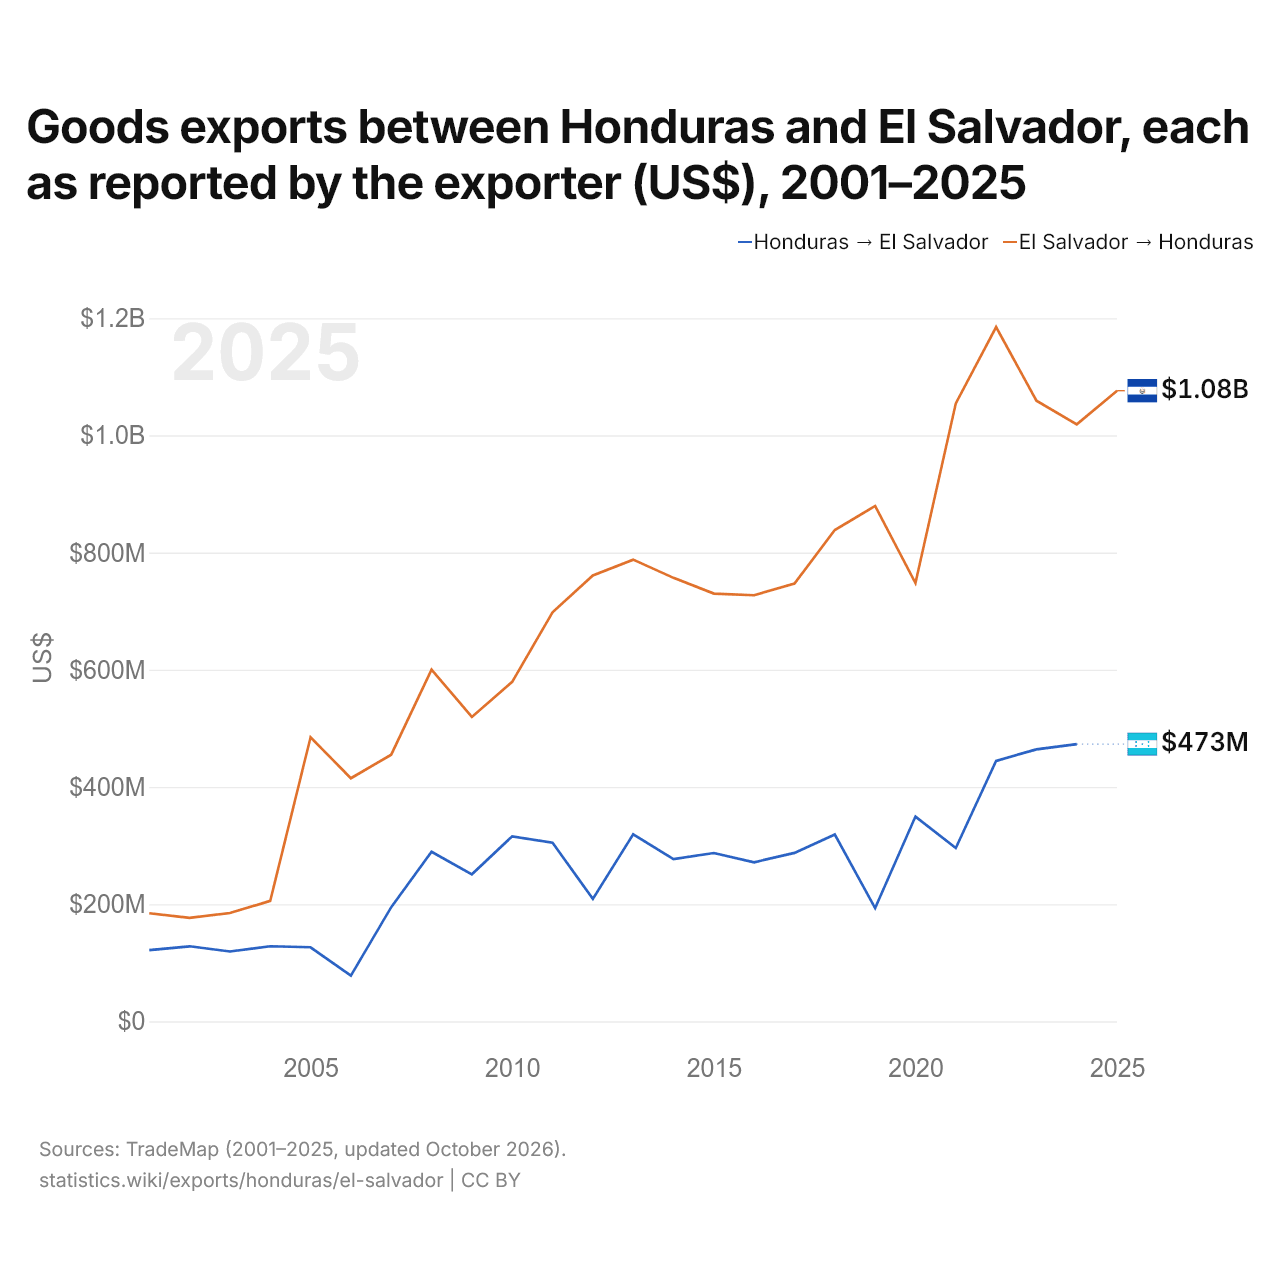
Exportations de biens entre le Honduras et le Salvador, selon chaque exportateur ($ US), 2001–2025
| Année | $ US | |
|---|---|---|
| Honduras → Salvador | Salvador → Honduras | |
| 2025 | - | 1 076 168 000 $ US |
| 2024 | 473 046 000 $ US | 1 018 837 000 $ US |
| 2023 | 464 051 000 $ US | 1 059 187 000 $ US |
| 2022 | 444 527 000 $ US | 1 184 754 000 $ US |
| 2021 | 295 852 000 $ US | 1 054 593 000 $ US |
| 2020 | 349 456 000 $ US | 747 928 000 $ US |
| 2019 | 193 258 000 $ US | 879 510 000 $ US |
| 2018 | 318 714 000 $ US | 838 522 000 $ US |
| 2017 | 287 468 000 $ US | 747 182 000 $ US |
| 2016 | 271 410 000 $ US | 727 084 000 $ US |
| 2015 | 287 280 000 $ US | 729 957 000 $ US |
| 2014 | 276 889 000 $ US | 756 818 000 $ US |
| 2013 | 319 078 000 $ US | 787 886 000 $ US |
| 2012 | 208 994 000 $ US | 760 987 000 $ US |
| 2011 | 304 741 000 $ US | 698 129 000 $ US |
| 2010 | 315 716 000 $ US | 579 376 000 $ US |
| 2009 | 250 873 000 $ US | 519 518 000 $ US |
| 2008 | 289 444 000 $ US | 600 197 000 $ US |
| 2007 | 194 857 000 $ US | 455 079 000 $ US |
| 2006 | 78 049 000 $ US | 414 779 000 $ US |
| 2005 | 126 377 000 $ US | 484 876 000 $ US |
| 2004 | 128 195 000 $ US | 205 520 000 $ US |
| 2003 | 119 152 000 $ US | 184 891 000 $ US |
| 2002 | 128 047 000 $ US | 176 611 000 $ US |
| 2001 | 121 481 000 $ US | 184 456 000 $ US |
Les exportations de biens du Honduras vers le Salvador, selon le Honduras, s'élevaient à 473 millions de dollars, et celles du Salvador vers le Honduras, selon le Salvador, à 1,02 milliard de dollars : 2,2 fois plus pour celles du Salvador. En 2001, elles s'élevaient à 121 millions de dollars pour le Honduras et à 184 millions de dollars pour le Salvador.
Honduras vs Salvador : chiffres des exportations
|
Honduras
|
Salvador
|
|
|---|---|---|
| Exportations | 13,9 Md $US (2025) | 11,8 Md $US (2025) |
| Rang mondial | 99/176 | 107/176 |
| Part mondiale | 0,04 % | 0,03 % |
| % du PIB | 35,0 % | 32,0 % |
| Première catégorie de biens | Cultures, plantes et fleurs (céréales, fruits, légumes, café, oléagineux) (26,9 %, 2024) | Textiles, vêtements, chaussures, meubles et jouets (32,5 %, 2025) |
| Première destination des biens | États-Unis (46,8 %, 2024) | États-Unis (32,8 %, 2025) |
Comparer les exportations de 2 pays au choix
Sources :
- Banque mondiale | Économie et croissance (1960–2025, mis à jour en octobre 2026)
- TradeMap (2001–2025, mis à jour en octobre 2026)
Creative Commons Attribution (CC BY) : vous pouvez copier, partager, adapter et réutiliser ce contenu, y compris à des fins commerciales, à condition de citer statistics.wiki et d’indiquer les modifications apportées. Les sources citées ci-dessus peuvent avoir leurs propres conditions de licence.