
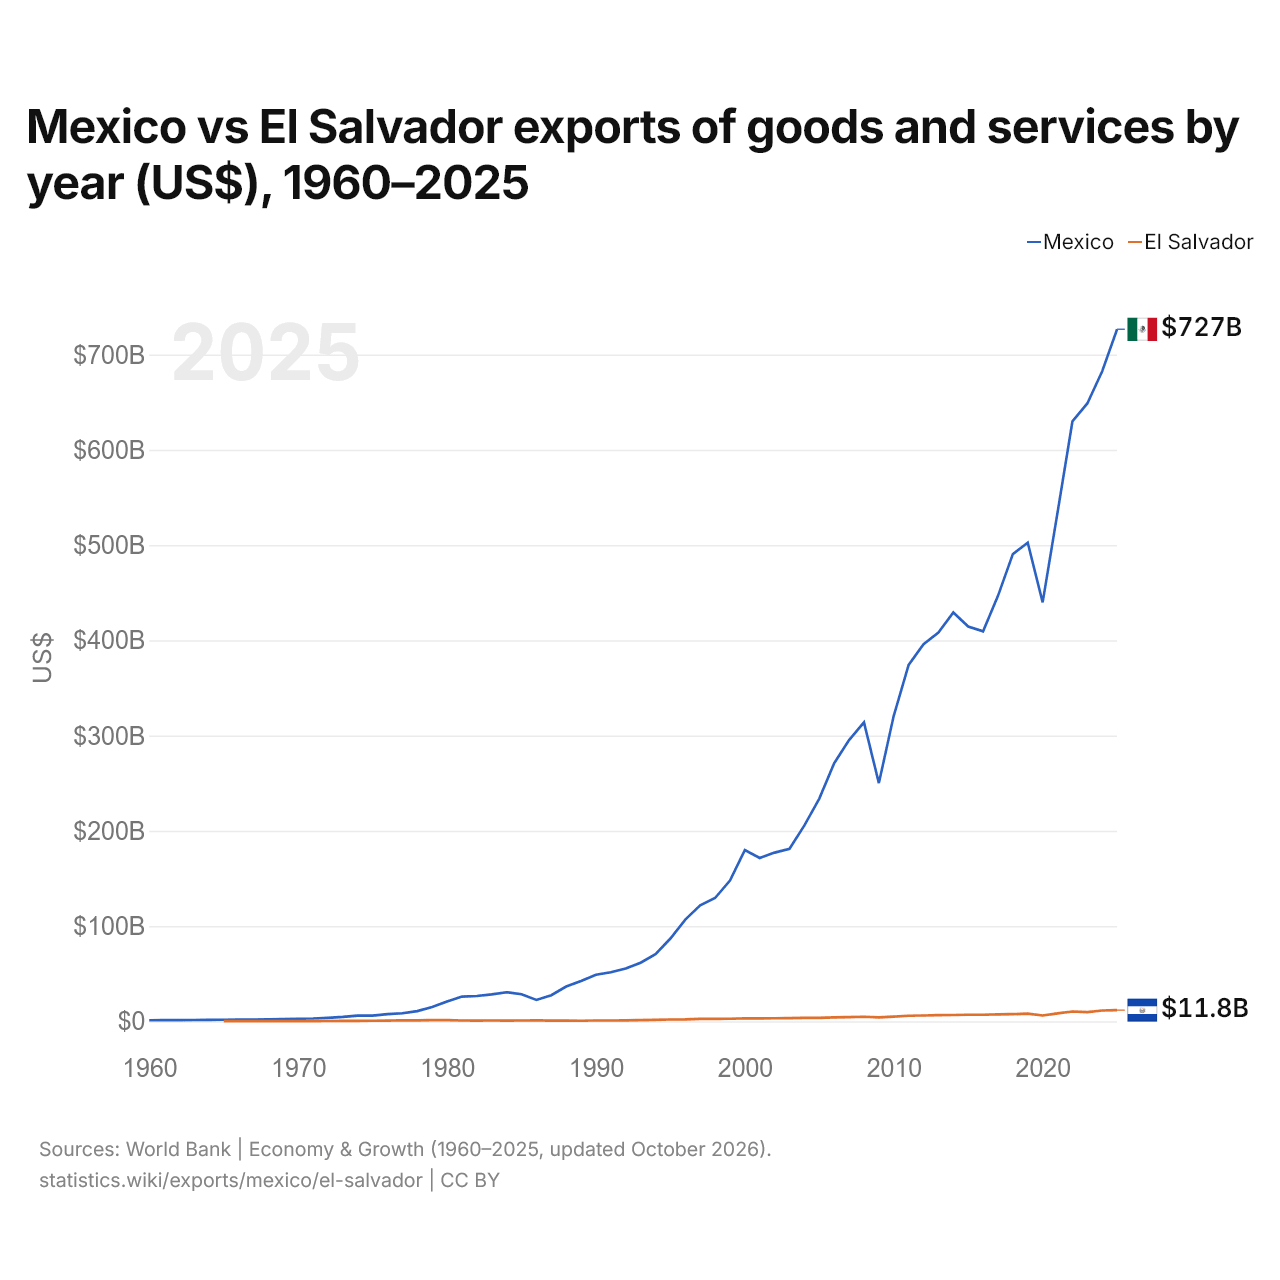
Mexique vs Salvador : exportations de biens et services par année ($ US), 1960–2025
| Année | $ US | |
|---|---|---|
 Mexique |
 Salvador |
|
| 2025 | 726 556 896 247 $ US | 11 763 690 000 $ US |
| 2024 | 682 472 609 894 $ US | 11 391 670 000 $ US |
| 2023 | 648 642 274 777 $ US | 9 664 110 000 $ US |
| 2022 | 629 788 673 074 $ US | 10 336 590 000 $ US |
| 2021 | 534 121 610 565 $ US | 8 359 050 000 $ US |
| 2020 | 439 853 932 828 $ US | 6 112 370 000 $ US |
| 2019 | 502 467 566 320 $ US | 8 052 490 000 $ US |
| 2018 | 490 508 969 545 $ US | 7 528 970 000 $ US |
| 2017 | 446 688 309 687 $ US | 7 251 400 000 $ US |
| 2016 | 409 476 294 705 $ US | 6 884 540 000 $ US |
| 2015 | 414 495 031 034 $ US | 6 911 040 000 $ US |
| 2014 | 429 314 956 761 $ US | 6 677 020 000 $ US |
| 2013 | 408 263 658 324 $ US | 6 536 790 000 $ US |
| 2012 | 395 854 929 793 $ US | 6 110 250 000 $ US |
| 2011 | 374 148 226 662 $ US | 5 878 600 000 $ US |
| 2010 | 320 766 037 581 $ US | 4 971 100 000 $ US |
| 2009 | 250 136 106 516 $ US | 4 215 800 000 $ US |
| 2008 | 313 852 456 087 $ US | 4 809 800 000 $ US |
| 2007 | 295 222 517 229 $ US | 4 349 400 000 $ US |
| 2006 | 270 928 816 793 $ US | 4 150 320 000 $ US |
| 2005 | 233 862 215 739 $ US | 3 713 680 000 $ US |
| 2004 | 205 711 767 188 $ US | 3 555 578 400 $ US |
| 2003 | 181 095 388 469 $ US | 3 433 269 900 $ US |
| 2002 | 177 144 829 752 $ US | 3 231 026 200 $ US |
| 2001 | 171 481 946 818 $ US | 3 071 774 700 $ US |
| 2000 | 179 810 168 051 $ US | 3 161 574 400 $ US |
| 1999 | 147 818 774 072 $ US | 2 752 938 000 $ US |
| 1998 | 129 452 220 228 $ US | 2 667 080 400 $ US |
| 1997 | 121 731 183 210 $ US | 2 659 875 600 $ US |
| 1996 | 106 842 978 990 $ US | 2 026 644 400 $ US |
| 1995 | 86 926 529 245 $ US | 1 923 081 200 $ US |
| 1994 | 70 611 769 311 $ US | 1 529 942 400 $ US |
| 1993 | 61 477 360 985 $ US | 1 294 122 000 $ US |
| 1992 | 55 406 062 494 $ US | 937 870 800 $ US |
| 1991 | 51 459 461 044 $ US | 904 756 600 $ US |
| 1990 | 48 866 118 135 $ US | 891 100 175 $ US |
| 1989 | 42 359 282 023 $ US | 578 784 600 $ US |
| 1988 | 36 496 678 772 $ US | 662 448 600 $ US |
| 1987 | 27 349 325 162 $ US | 751 724 100 $ US |
| 1986 | 22 446 879 807 $ US | 930 400 000 $ US |
| 1985 | 28 439 428 976 $ US | 848 385 400 $ US |
| 1984 | 30 521 772 291 $ US | 796 567 700 $ US |
| 1983 | 28 289 706 397 $ US | 858 652 600 $ US |
| 1982 | 26 632 371 193 $ US | 774 247 000 $ US |
| 1981 | 26 014 603 304 $ US | 917 000 000 $ US |
| 1980 | 20 850 899 743 $ US | 1 220 920 000 $ US |
| 1979 | 15 052 992 765 $ US | 1 280 560 000 $ US |
| 1978 | 10 748 302 367 $ US | 946 719 900 $ US |
| 1977 | 8 452 576 086 $ US | 1 122 680 000 $ US |
| 1976 | 7 545 416 829 $ US | 827 560 000 $ US |
| 1975 | 6 067 120 000 $ US | 622 640 000 $ US |
| 1974 | 6 054 240 000 $ US | 540 040 000 $ US |
| 1973 | 4 650 160 000 $ US | 432 120 000 $ US |
| 1972 | 3 643 200 000 $ US | 367 680 000 $ US |
| 1971 | 2 995 040 000 $ US | 292 160 000 $ US |
| 1970 | 2 754 440 000 $ US | 281 360 000 $ US |
| 1969 | 2 451 096 000 $ US | 243 320 000 $ US |
| 1968 | 2 066 336 000 $ US | 255 960 000 $ US |
| 1967 | 1 824 072 000 $ US | 250 280 000 $ US |
| 1966 | 1 816 952 000 $ US | 229 240 000 $ US |
| 1965 | 1 667 320 000 $ US | 231 600 000 $ US |
| 1964 | 1 532 720 000 $ US | - |
| 1963 | 1 411 096 000 $ US | - |
| 1962 | 1 302 504 000 $ US | - |
| 1961 | 1 191 208 000 $ US | - |
| 1960 | 1 109 120 000 $ US | - |
En 2025, les exportations de biens et services du Mexique s'élevaient à 727 milliards de dollars et celles du Salvador à 11,8 milliards de dollars : celles du Mexique étaient 62 fois plus élevées. En 1965, les exportations du Mexique étaient 7,2 fois plus élevées : 1,67 milliard de dollars pour le Mexique et 232 millions de dollars pour le Salvador.
Les exportations de biens et services du Mexique sont supérieures à celles du Salvador chaque année depuis 1965.
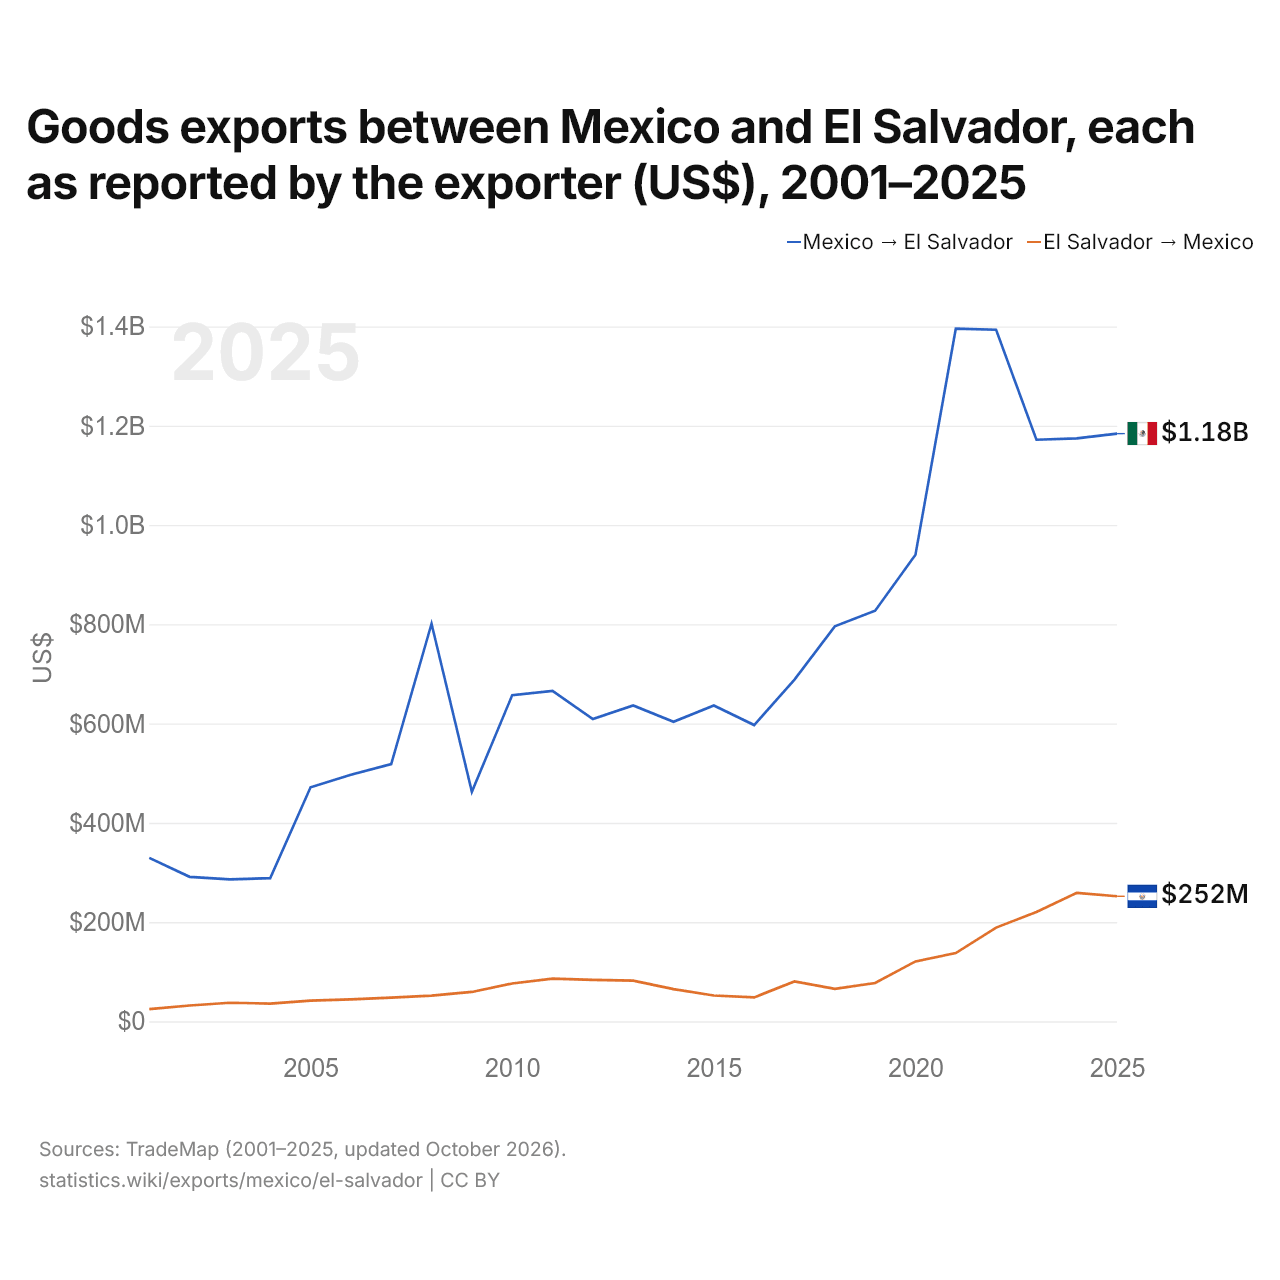
Exportations de biens entre le Mexique et le Salvador, selon chaque exportateur ($ US), 2001–2025
| Année | $ US | |
|---|---|---|
| Mexique → Salvador | Salvador → Mexique | |
| 2025 | 1 184 115 000 $ US | 251 943 000 $ US |
| 2024 | 1 174 356 000 $ US | 258 779 000 $ US |
| 2023 | 1 171 743 000 $ US | 220 222 000 $ US |
| 2022 | 1 393 336 000 $ US | 188 871 000 $ US |
| 2021 | 1 395 496 000 $ US | 137 493 000 $ US |
| 2020 | 940 122 000 $ US | 120 748 000 $ US |
| 2019 | 827 206 000 $ US | 77 196 000 $ US |
| 2018 | 795 873 000 $ US | 65 288 000 $ US |
| 2017 | 688 557 000 $ US | 80 414 000 $ US |
| 2016 | 596 938 000 $ US | 48 272 000 $ US |
| 2015 | 636 412 000 $ US | 52 064 000 $ US |
| 2014 | 603 391 000 $ US | 64 837 000 $ US |
| 2013 | 636 483 000 $ US | 81 896 000 $ US |
| 2012 | 608 851 000 $ US | 83 365 000 $ US |
| 2011 | 665 820 000 $ US | 86 148 000 $ US |
| 2010 | 657 077 000 $ US | 76 234 000 $ US |
| 2009 | 462 485 000 $ US | 59 207 000 $ US |
| 2008 | 801 084 000 $ US | 51 899 000 $ US |
| 2007 | 518 339 000 $ US | 47 872 000 $ US |
| 2006 | 496 914 000 $ US | 44 376 000 $ US |
| 2005 | 471 600 000 $ US | 41 672 000 $ US |
| 2004 | 288 429 000 $ US | 35 803 000 $ US |
| 2003 | 286 114 000 $ US | 37 383 000 $ US |
| 2002 | 291 156 000 $ US | 31 912 000 $ US |
| 2001 | 329 277 000 $ US | 24 631 000 $ US |
En 2025, les exportations de biens du Mexique vers le Salvador, selon le Mexique, s'élevaient à 1,18 milliard de dollars, et celles du Salvador vers le Mexique, selon le Salvador, à 252 millions de dollars : 4,7 fois plus pour celles du Mexique. En 2001, elles s'élevaient à 329 millions de dollars pour le Mexique et à 24,6 millions de dollars pour le Salvador.
Mexique vs Salvador : chiffres des exportations
|
Mexique
|
Salvador
|
|
|---|---|---|
| Exportations | 727 Md $US (2025) | 11,8 Md $US (2025) |
| Rang mondial | 15/176 | 107/176 |
| Part mondiale | 2,08 % | 0,03 % |
| % du PIB | 39,6 % | 32,0 % |
| Première catégorie de biens | Machines, électronique et véhicules (70,3 %, 2025) | Textiles, vêtements, chaussures, meubles et jouets (32,5 %, 2025) |
| Première destination des biens | États-Unis (81,9 %, 2025) | États-Unis (32,8 %, 2025) |
Comparer les exportations de 2 pays au choix
Sources :
- Banque mondiale | Économie et croissance (1960–2025, mis à jour en octobre 2026)
- TradeMap (2001–2025, mis à jour en octobre 2026)
Creative Commons Attribution (CC BY) : vous pouvez copier, partager, adapter et réutiliser ce contenu, y compris à des fins commerciales, à condition de citer statistics.wiki et d’indiquer les modifications apportées. Les sources citées ci-dessus peuvent avoir leurs propres conditions de licence.