
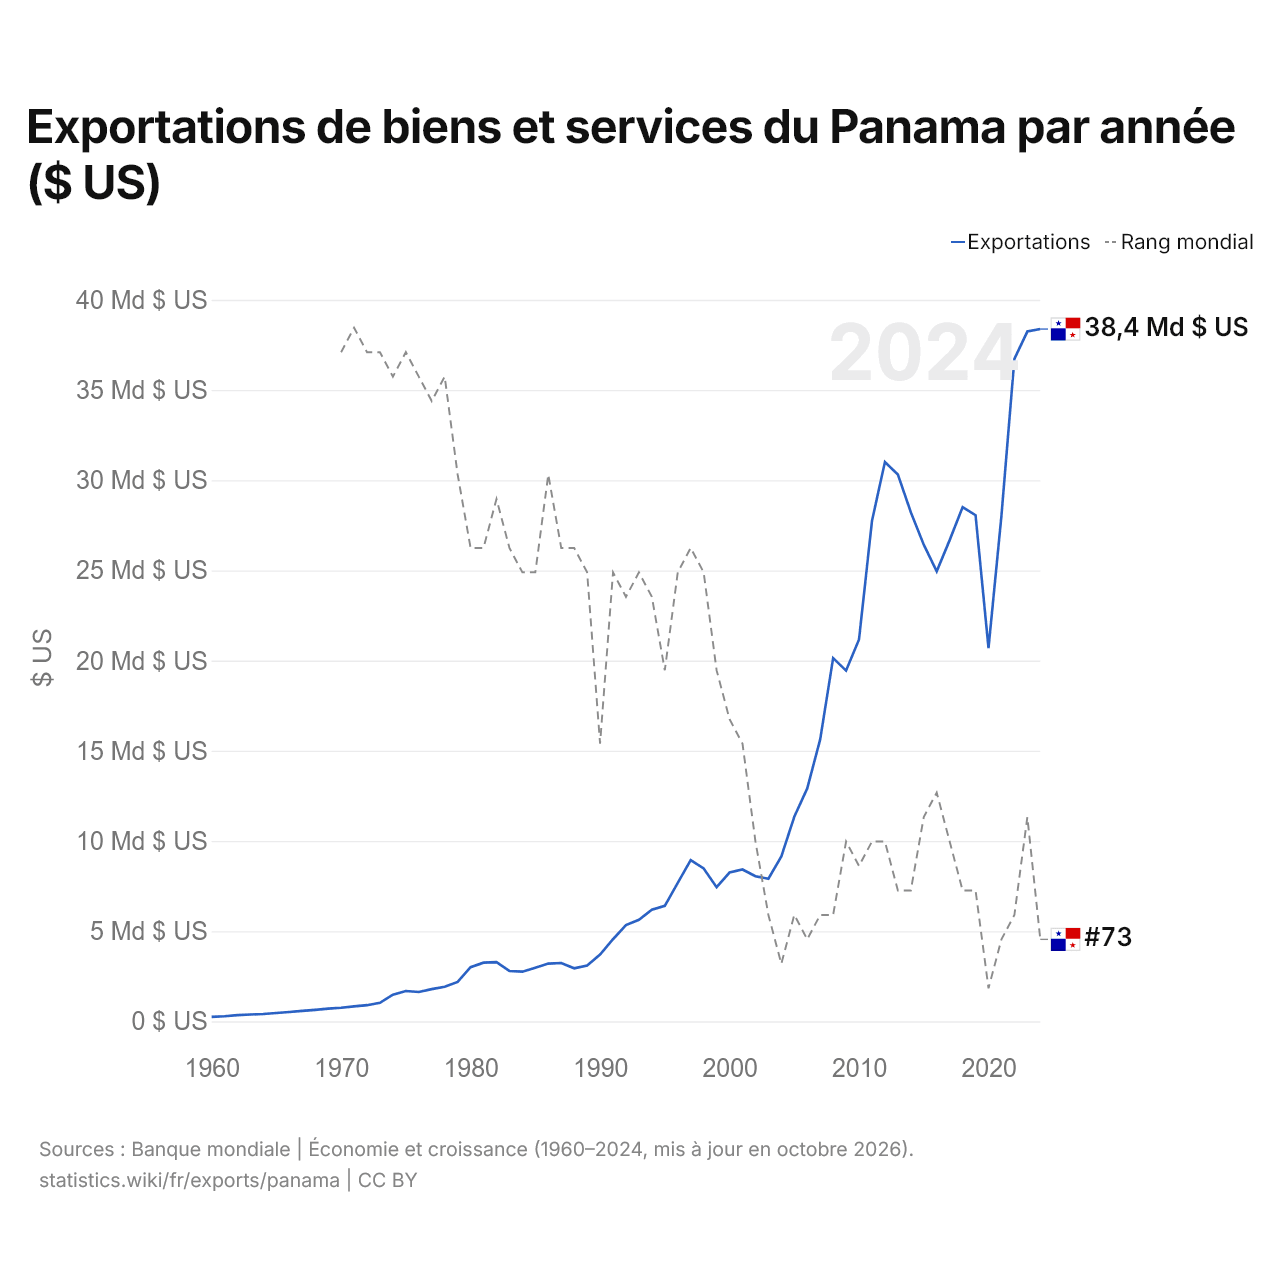
Exportations de biens et services du Panama par année ($ US)
| Année | $ US | Rang mondial |
|---|---|---|
| Exportations | Rang mondial | |
| 2024 | 38 380 161 300 $ US | #73 |
| 2023 | 38 242 852 800 $ US | #68 |
| 2022 | 36 730 408 000 $ US | #72 |
| 2021 | 28 041 417 500 $ US | #73 |
| 2020 | 20 695 086 000 $ US | #75 |
| 2019 | 28 061 045 300 $ US | #71 |
| 2018 | 28 506 576 400 $ US | #71 |
| 2017 | 26 677 342 700 $ US | #69 |
| 2016 | 24 944 633 900 $ US | #67 |
| 2015 | 26 426 478 300 $ US | #68 |
| 2014 | 28 227 865 800 $ US | #71 |
| 2013 | 30 311 100 700 $ US | #71 |
| 2012 | 31 007 035 900 $ US | #69 |
| 2011 | 27 745 672 000 $ US | #69 |
| 2010 | 21 169 337 600 $ US | #70 |
| 2009 | 19 444 070 800 $ US | #69 |
| 2008 | 20 139 437 700 $ US | #72 |
| 2007 | 15 632 029 200 $ US | #72 |
| 2006 | 12 911 451 400 $ US | #73 |
| 2005 | 11 343 421 800 $ US | #72 |
| 2004 | 9 147 223 700 $ US | #74 |
| 2003 | 7 908 174 700 $ US | #72 |
| 2002 | 8 042 654 200 $ US | #69 |
| 2001 | 8 417 757 100 $ US | #65 |
| 2000 | 8 252 110 300 $ US | #64 |
| 1999 | 7 437 744 600 $ US | #62 |
| 1998 | 8 476 358 300 $ US | #58 |
| 1997 | 8 944 359 100 $ US | #57 |
| 1996 | 7 673 646 700 $ US | #58 |
| 1995 | 6 399 816 900 $ US | #62 |
| 1994 | 6 185 029 900 $ US | #59 |
| 1993 | 5 626 006 400 $ US | #58 |
| 1992 | 5 336 629 500 $ US | #59 |
| 1991 | 4 552 713 300 $ US | #58 |
| 1990 | 3 699 099 600 $ US | #65 |
| 1989 | 3 092 916 000 $ US | #58 |
| 1988 | 2 940 126 900 $ US | #57 |
| 1987 | 3 233 834 800 $ US | #57 |
| 1986 | 3 202 394 800 $ US | #54 |
| 1985 | 2 972 609 600 $ US | #58 |
| 1984 | 2 752 048 000 $ US | #58 |
| 1983 | 2 792 310 500 $ US | #57 |
| 1982 | 3 277 786 800 $ US | #55 |
| 1981 | 3 253 003 600 $ US | #57 |
| 1980 | 3 000 600 900 $ US | #57 |
| 1979 | 2 183 808 400 $ US | #54 |
| 1978 | 1 915 103 700 $ US | #50 |
| 1977 | 1 788 323 200 $ US | #51 |
| 1976 | 1 626 595 600 $ US | #50 |
| 1975 | 1 680 181 200 $ US | #49 |
| 1974 | 1 479 040 900 $ US | #50 |
| 1973 | 1 025 310 500 $ US | #49 |
| 1972 | 894 452 800 $ US | #49 |
| 1971 | 827 859 100 $ US | #48 |
| 1970 | 753 693 500 $ US | #49 |
| 1969 | 701 141 700 $ US | - |
| 1968 | 637 577 200 $ US | - |
| 1967 | 582 900 100 $ US | - |
| 1966 | 518 176 300 $ US | - |
| 1965 | 464 078 900 $ US | - |
| 1964 | 407 276 600 $ US | - |
| 1963 | 380 614 200 $ US | - |
| 1962 | 346 803 300 $ US | - |
| 1961 | 282 659 200 $ US | - |
| 1960 | 245 950 200 $ US | - |
Les exportations de biens et services du Panama s'élèvent à 38,4 milliards de dollars (2024), contre 246 millions de dollars en 1960. Elles se classent au 73e rang mondial, en baisse par rapport au 68e rang l'année précédente. Leur meilleur rang a été le 48e, occupé pour la dernière fois en 1971.
Les exportations de biens et services du Panama sont les 9es plus élevées de 27 pays situés en Amérique latine. Les importations de biens et services du Panama s'élèvent à 34 milliards de dollars (2024), au 77e rang mondial. Les exportations du Panama dépassent ses importations de 4,36 milliards de dollars, soit un excédent commercial (2024).
Exportations de biens du Panama par catégorie, 2025
Exportations de biens, 2025: 12,3 Md $US
En 2025, la première catégorie des exportations de biens du Panama était « machines, électronique et véhicules », avec 28,5 %, suivie de « produits chimiques, pharmaceutiques et plastiques », avec 27,9 %.
Destinations des exportations de biens du Panama : les 10 premières, 2025
| Rang | Pays | Exportations de biens | Part | |
|---|---|---|---|---|
| 1 |
 Colombie |
981 M $US | 7,95 % | |
| 2 |
 Venezuela |
926 M $US | 7,5 % | vs Venezuela |
| 3 |
 Costa Rica |
897 M $US | 7,27 % | vs Costa Rica |
| 4 |
 États-Unis |
839 M $US | 6,8 % | |
| 5 |
 Guatemala |
706 M $US | 5,72 % | |
| 6 |
 Cuba |
582 M $US | 4,72 % | |
| 7 |
 Rép. dominicaine |
510 M $US | 4,13 % | vs Rép. dominicaine |
| 8 |
 Honduras |
461 M $US | 3,73 % | |
| 9 |
 Nicaragua |
443 M $US | 3,59 % | |
| 10 |
 Salvador |
415 M $US | 3,36 % | |
| Autres partenaires et non précisés | 5,58 Md $US | 45,2 % |
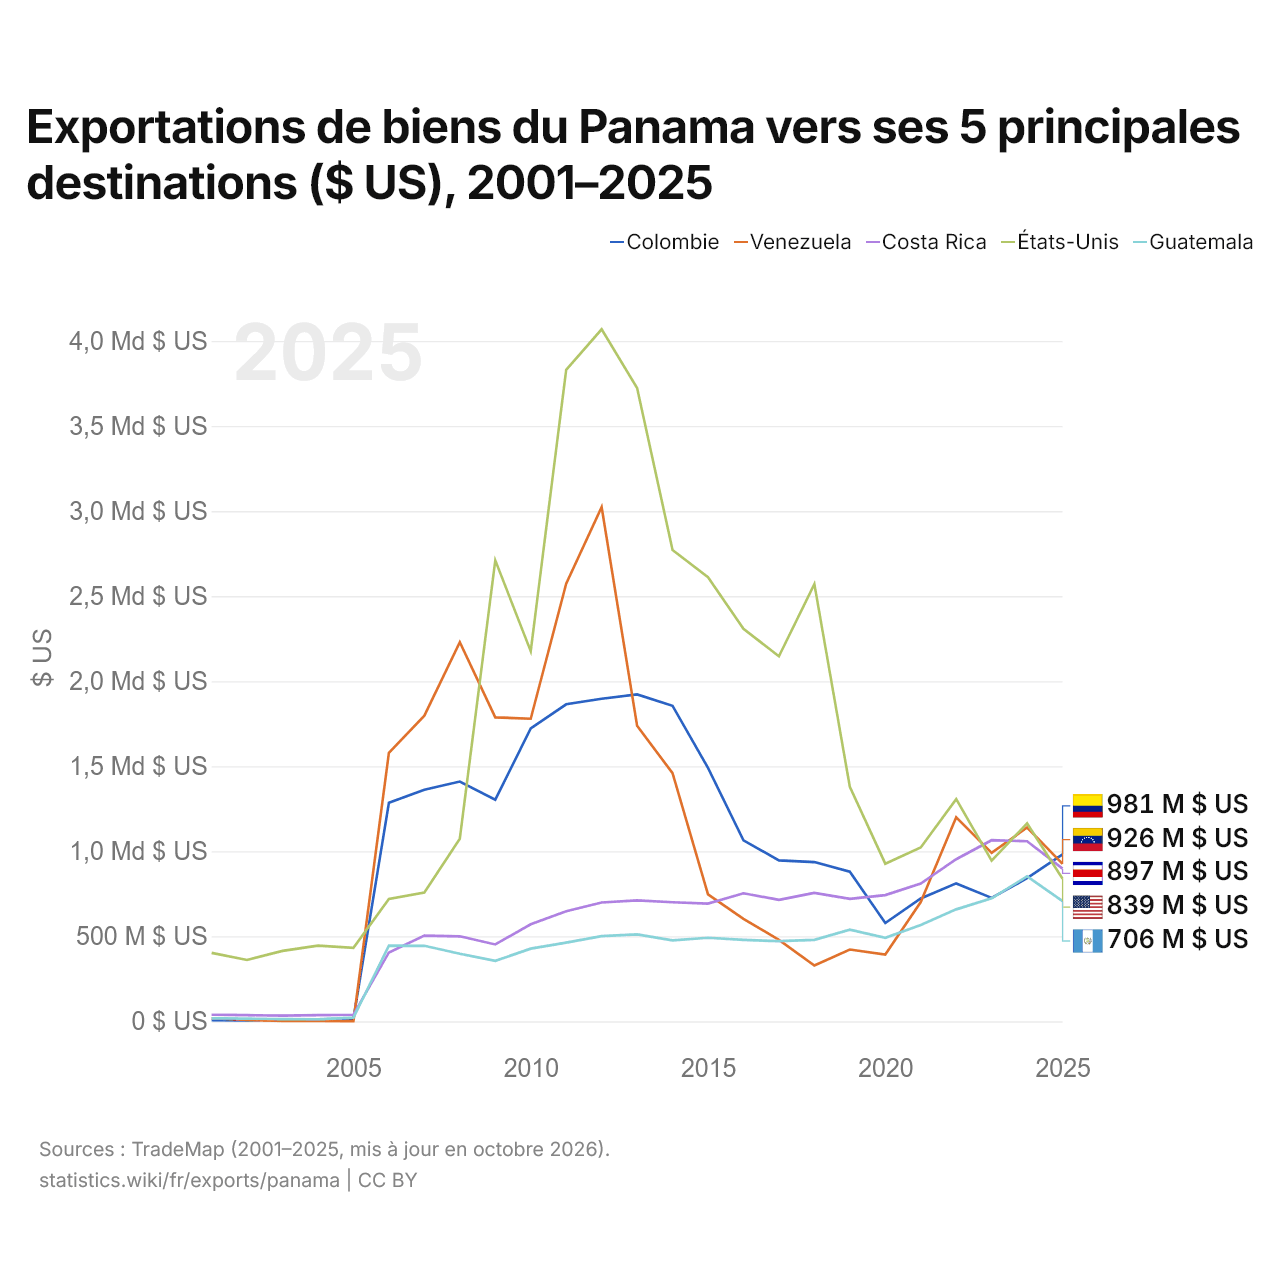
Exportations de biens du Panama vers ses 5 principales destinations ($ US), 2001–2025
| Année | $ US | ||||
|---|---|---|---|---|---|
| Colombie | Venezuela | Costa Rica | États-Unis | Guatemala | |
| 2025 | 980 979 000 $ US | 925 566 000 $ US | 897 403 000 $ US | 838 734 000 $ US | 706 145 000 $ US |
| 2024 | 841 390 000 $ US | 1 139 574 000 $ US | 1 058 553 000 $ US | 1 163 674 000 $ US | 852 355 000 $ US |
| 2023 | 725 683 000 $ US | 990 552 000 $ US | 1 064 960 000 $ US | 945 054 000 $ US | 722 968 000 $ US |
| 2022 | 810 999 000 $ US | 1 199 890 000 $ US | 953 033 000 $ US | 1 306 169 000 $ US | 658 241 000 $ US |
| 2021 | 722 485 000 $ US | 701 720 000 $ US | 809 563 000 $ US | 1 022 219 000 $ US | 566 891 000 $ US |
| 2020 | 577 817 000 $ US | 392 636 000 $ US | 742 165 000 $ US | 926 751 000 $ US | 490 897 000 $ US |
| 2019 | 879 599 000 $ US | 422 259 000 $ US | 719 622 000 $ US | 1 378 531 000 $ US | 539 092 000 $ US |
| 2018 | 936 250 000 $ US | 328 031 000 $ US | 754 706 000 $ US | 2 570 756 000 $ US | 479 315 000 $ US |
| 2017 | 946 082 000 $ US | 479 424 000 $ US | 714 390 000 $ US | 2 145 797 000 $ US | 471 217 000 $ US |
| 2016 | 1 063 778 000 $ US | 602 271 000 $ US | 752 971 000 $ US | 2 307 641 000 $ US | 479 105 000 $ US |
| 2015 | 1 490 146 000 $ US | 746 581 000 $ US | 692 318 000 $ US | 2 611 397 000 $ US | 491 315 000 $ US |
| 2014 | 1 854 810 000 $ US | 1 458 803 000 $ US | 699 894 000 $ US | 2 771 052 000 $ US | 475 711 000 $ US |
| 2013 | 1 921 891 000 $ US | 1 737 391 000 $ US | 711 584 000 $ US | 3 723 386 000 $ US | 511 103 000 $ US |
| 2012 | 1 896 258 000 $ US | 3 023 286 000 $ US | 698 565 000 $ US | 4 068 799 000 $ US | 500 669 000 $ US |
| 2011 | 1 863 857 000 $ US | 2 572 485 000 $ US | 647 391 000 $ US | 3 830 681 000 $ US | 462 426 000 $ US |
| 2010 | 1 721 822 000 $ US | 1 779 025 000 $ US | 570 241 000 $ US | 2 176 384 000 $ US | 427 202 000 $ US |
| 2009 | 1 302 797 000 $ US | 1 787 055 000 $ US | 451 963 000 $ US | 2 710 136 000 $ US | 355 380 000 $ US |
| 2008 | 1 409 745 000 $ US | 2 229 113 000 $ US | 499 789 000 $ US | 1 074 065 000 $ US | 397 099 000 $ US |
| 2007 | 1 361 862 000 $ US | 1 797 038 000 $ US | 504 068 000 $ US | 756 710 000 $ US | 444 049 000 $ US |
| 2006 | 1 284 794 000 $ US | 1 578 783 000 $ US | 405 175 000 $ US | 718 959 000 $ US | 444 845 000 $ US |
| 2005 | 15 375 000 $ US | 1 294 000 $ US | 38 746 000 $ US | 432 526 000 $ US | 21 450 000 $ US |
| 2004 | 11 892 000 $ US | 2 147 000 $ US | 36 772 000 $ US | 444 956 000 $ US | 11 612 000 $ US |
| 2003 | 8 579 000 $ US | 2 305 000 $ US | 33 466 000 $ US | 414 467 000 $ US | 13 254 000 $ US |
| 2002 | 5 752 000 $ US | 8 582 000 $ US | 36 133 000 $ US | 360 921 000 $ US | 15 903 000 $ US |
| 2001 | 6 282 000 $ US | 18 192 000 $ US | 38 773 000 $ US | 402 427 000 $ US | 17 129 000 $ US |
En 2025, les exportations de biens s'élevaient à 981 millions de dollars vers la Colombie, 926 millions de dollars vers le Venezuela, 897 millions de dollars vers le Costa Rica, 839 millions de dollars vers les États-Unis et 706 millions de dollars vers le Guatemala. Le changement le plus récent dans leur ordre remonte à 2025, quand les exportations du Panama vers la Colombie ont dépassé celles vers le Venezuela.
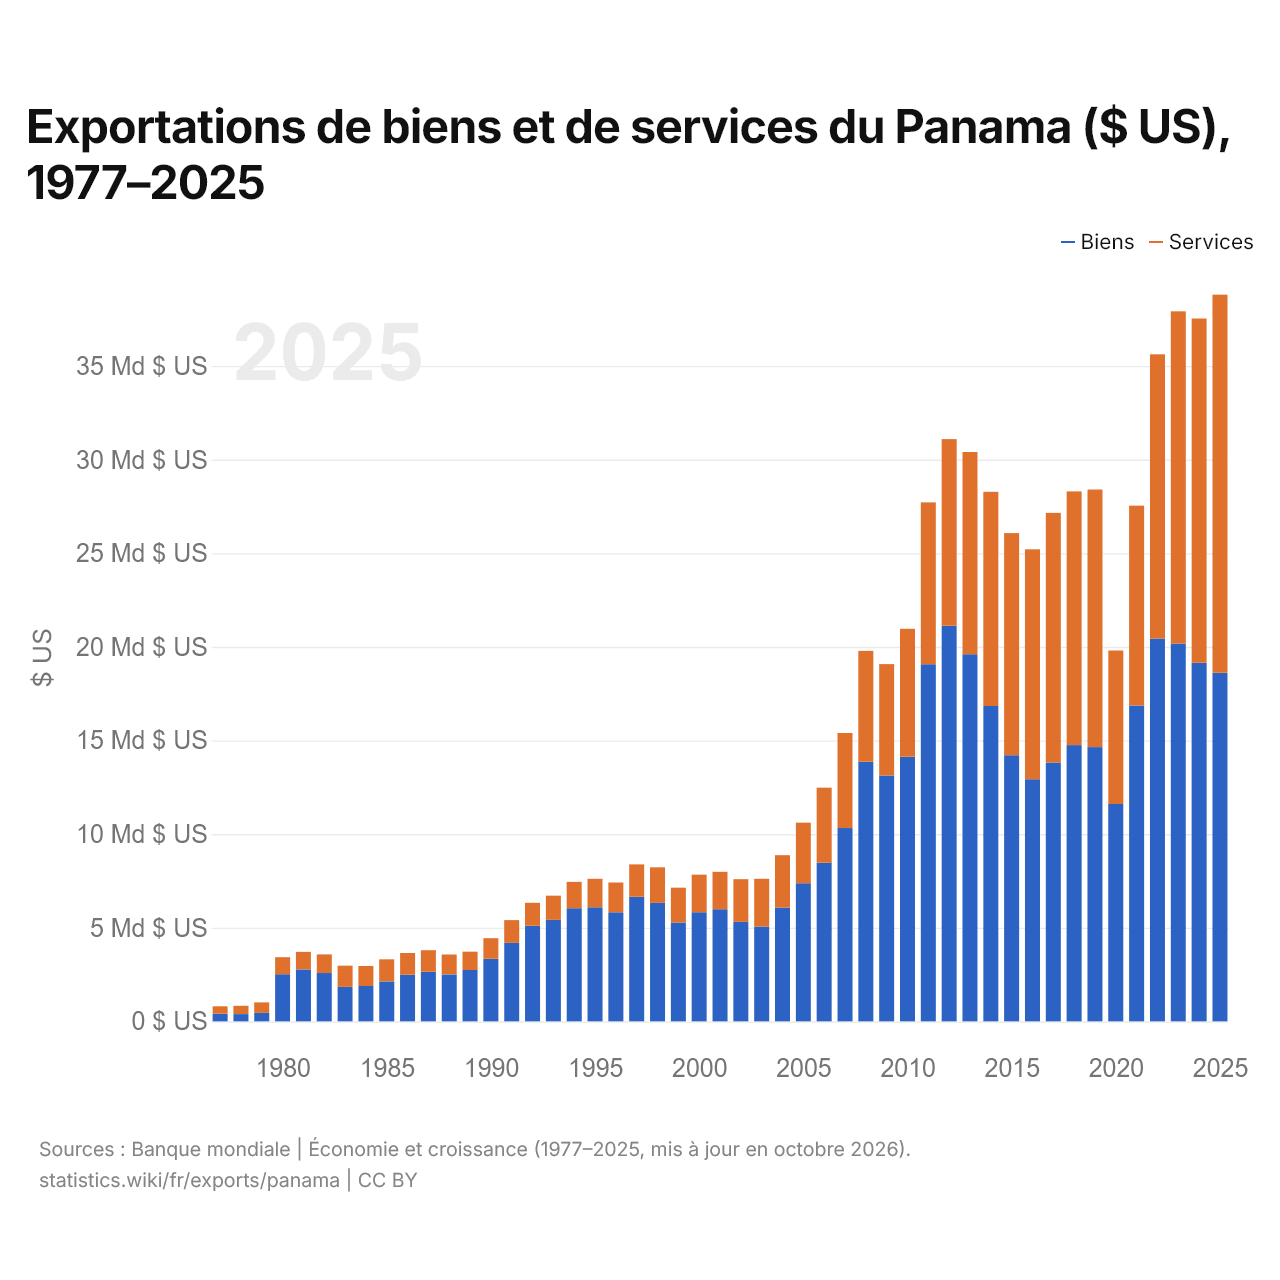
Exportations de biens et de services du Panama ($ US), 1977–2025
| Année | $ US | |
|---|---|---|
| Biens | Services | |
| 2025 | 18 612 208 801 $ US | 20 194 027 092 $ US |
| 2024 | 19 146 373 460 $ US | 18 385 726 106 $ US |
| 2023 | 20 175 110 674 $ US | 17 740 985 940 $ US |
| 2022 | 20 443 146 327 $ US | 15 177 354 678 $ US |
| 2021 | 16 862 531 705 $ US | 10 674 058 282 $ US |
| 2020 | 11 606 810 904 $ US | 8 196 633 411 $ US |
| 2019 | 14 645 533 398 $ US | 13 754 432 415 $ US |
| 2018 | 14 751 852 903 $ US | 13 546 691 922 $ US |
| 2017 | 13 817 445 648 $ US | 13 333 807 243 $ US |
| 2016 | 12 932 849 900 $ US | 12 275 087 934 $ US |
| 2015 | 14 208 600 000 $ US | 11 865 500 000 $ US |
| 2014 | 16 840 800 000 $ US | 11 437 600 000 $ US |
| 2013 | 19 603 000 000 $ US | 10 800 500 000 $ US |
| 2012 | 21 121 900 000 $ US | 9 970 000 000 $ US |
| 2011 | 19 067 700 000 $ US | 8 643 800 000 $ US |
| 2010 | 14 130 800 000 $ US | 6 833 600 000 $ US |
| 2009 | 13 126 000 000 $ US | 5 953 200 000 $ US |
| 2008 | 13 864 900 000 $ US | 5 919 000 000 $ US |
| 2007 | 10 322 000 000 $ US | 5 076 400 000 $ US |
| 2006 | 8 472 700 000 $ US | 4 002 800 000 $ US |
| 2005 | 7 372 600 000 $ US | 3 233 900 000 $ US |
| 2004 | 6 075 700 000 $ US | 2 797 900 000 $ US |
| 2003 | 5 067 200 000 $ US | 2 544 800 000 $ US |
| 2002 | 5 309 500 000 $ US | 2 283 100 000 $ US |
| 2001 | 5 986 800 000 $ US | 1 998 400 000 $ US |
| 2000 | 5 824 200 000 $ US | 2 008 700 000 $ US |
| 1999 | 5 280 000 000 $ US | 1 855 600 000 $ US |
| 1998 | 6 322 700 000 $ US | 1 900 600 000 $ US |
| 1997 | 6 649 600 000 $ US | 1 730 900 000 $ US |
| 1996 | 5 821 100 000 $ US | 1 593 800 000 $ US |
| 1995 | 6 089 700 000 $ US | 1 520 600 000 $ US |
| 1994 | 6 044 200 000 $ US | 1 404 300 000 $ US |
| 1993 | 5 416 600 000 $ US | 1 297 700 000 $ US |
| 1992 | 5 103 800 000 $ US | 1 225 800 000 $ US |
| 1991 | 4 190 500 000 $ US | 1 217 700 000 $ US |
| 1990 | 3 345 600 000 $ US | 1 092 700 000 $ US |
| 1989 | 2 741 300 000 $ US | 982 000 000 $ US |
| 1988 | 2 505 100 000 $ US | 1 063 000 000 $ US |
| 1987 | 2 649 700 000 $ US | 1 151 000 000 $ US |
| 1986 | 2 490 000 000 $ US | 1 159 800 000 $ US |
| 1985 | 2 132 300 000 $ US | 1 180 700 000 $ US |
| 1984 | 1 889 400 000 $ US | 1 066 300 000 $ US |
| 1983 | 1 839 700 000 $ US | 1 131 800 000 $ US |
| 1982 | 2 579 200 000 $ US | 994 300 000 $ US |
| 1981 | 2 773 700 000 $ US | 933 200 000 $ US |
| 1980 | 2 518 800 000 $ US | 902 900 000 $ US |
| 1979 | 453 200 000 $ US | 559 500 000 $ US |
| 1978 | 385 700 000 $ US | 442 500 000 $ US |
| 1977 | 401 000 000 $ US | 401 200 000 $ US |
En 2025, les exportations de biens du Panama s'élevaient à 18,6 milliards de dollars et celles de services à 20,2 milliards de dollars ; les services représentaient 52,0 % du total, contre 50,0 % en 1977.
Le Panama dans le classement mondial des exportations
| Rang | Pays | Exportations | Part mondiale | |
|---|---|---|---|---|
| 70 |
 Chypre |
40,2 Md $US (2025) | 0,12 % | |
| 71 |
Costa Rica
|
40,0 Md $US (2025) | 0,11 % | vs Costa Rica |
| 72 |
 RDC |
39,5 Md $US (2025) | 0,11 % | |
| 73 |
 Panama |
38,4 Md $US | 0,12 % | |
| 74 |
 Estonie |
36,9 Md $US (2025) | 0,11 % | |
| 75 |
 Cambodge |
35,2 Md $US (2025) | 0,1 % | |
| 76 |
 Libye |
34,5 Md $US (2025) | 0,1 % |
Exportations de biens et services du Panama, % du PIB
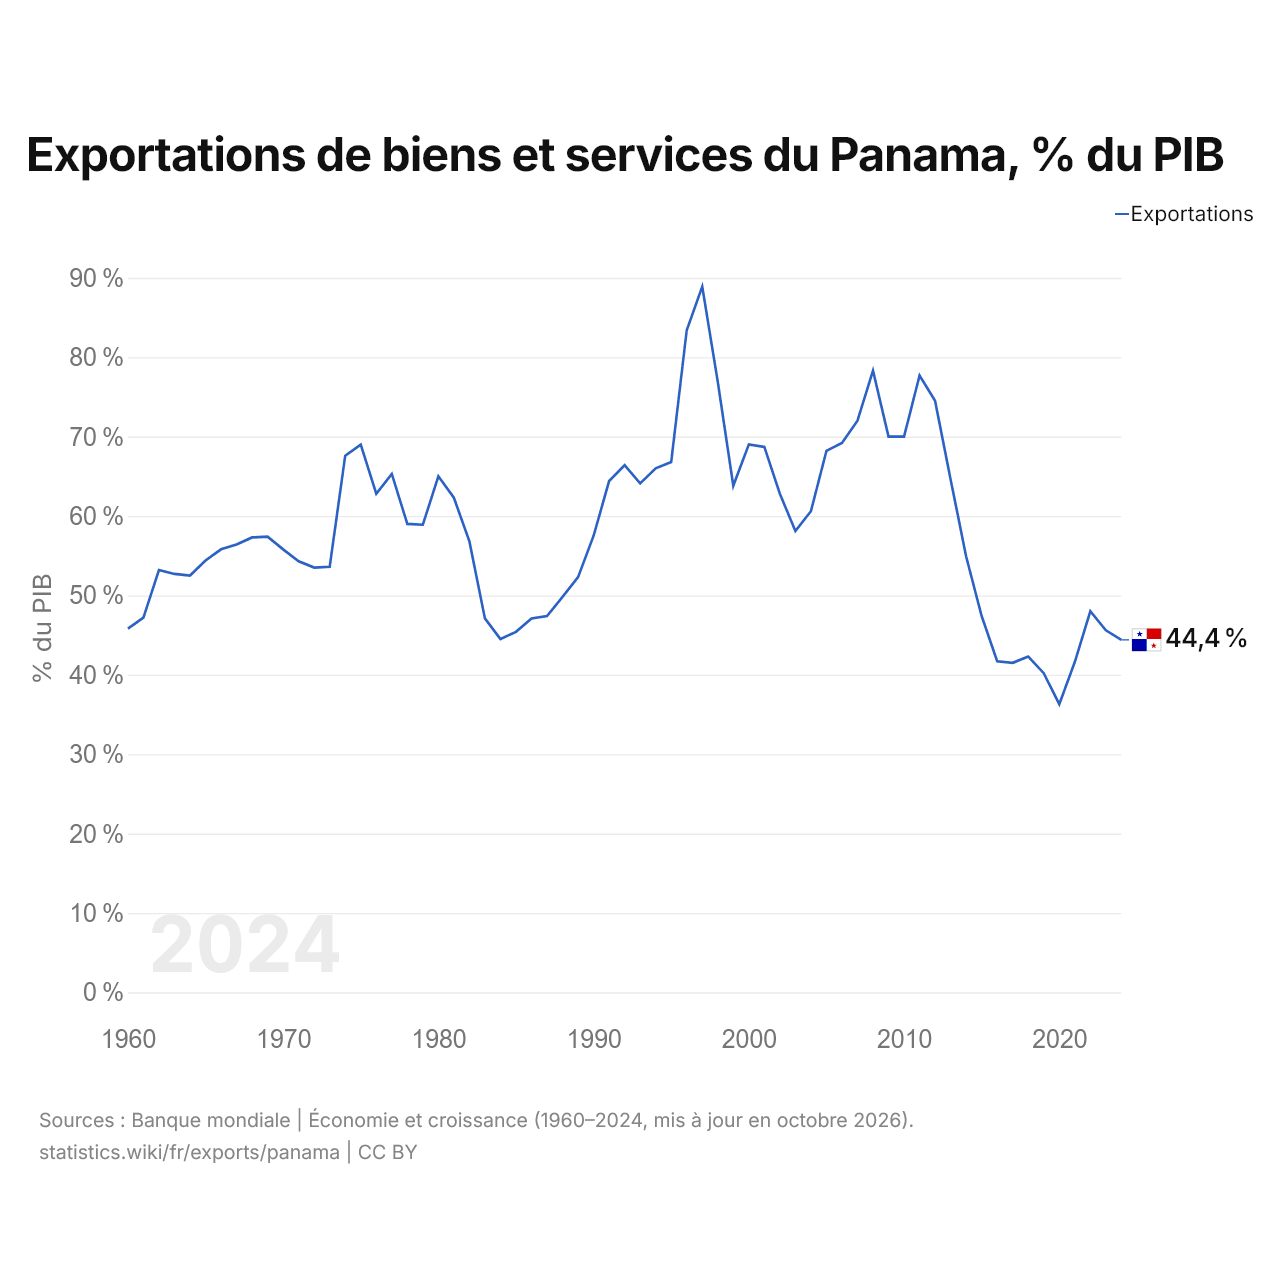
Les exportations de biens et services du Panama équivalent à 44,4 % de son PIB (2024), contre 45,8 % en 1960. La part la plus élevée a été de 88,9 %, en 1997.
Comparer les exportations du Panama avec celles d'autres pays
Sources :
- Banque mondiale | Économie et croissance (1960–2025, mis à jour en octobre 2026)
- TradeMap (2001–2025, mis à jour en octobre 2026)
Creative Commons Attribution (CC BY) : vous pouvez copier, partager, adapter et réutiliser ce contenu, y compris à des fins commerciales, à condition de citer statistics.wiki et d’indiquer les modifications apportées. Les sources citées ci-dessus peuvent avoir leurs propres conditions de licence.