
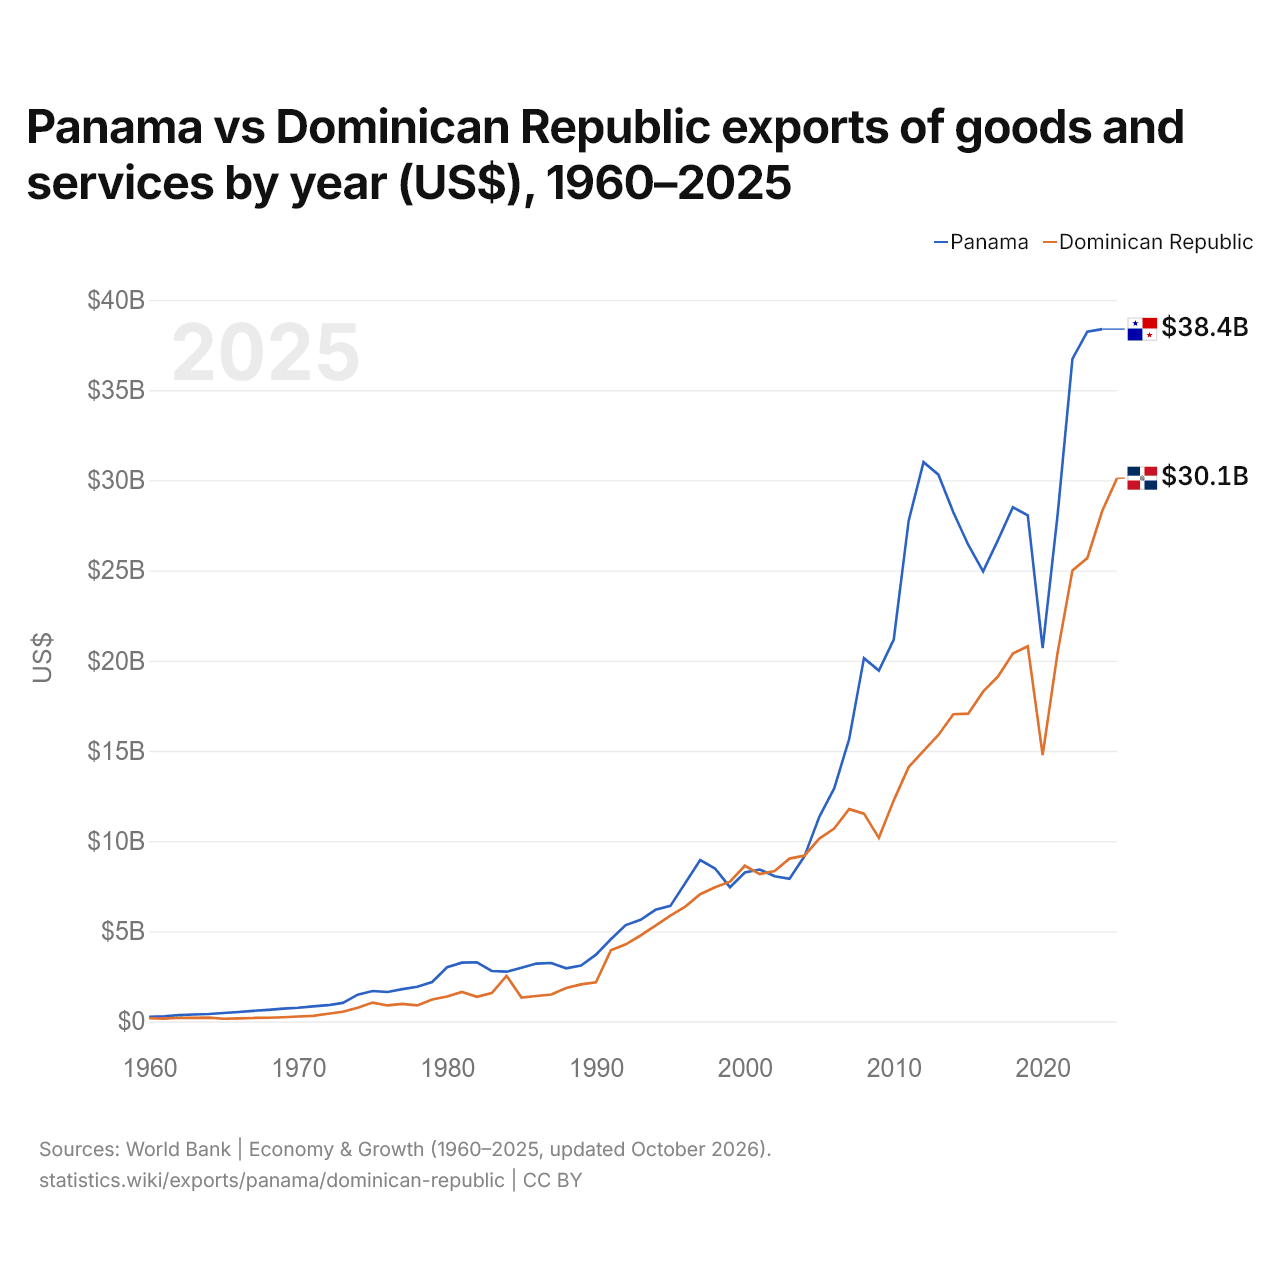
Panama vs République dominicaine : exportations de biens et services par année ($ US), 1960–2025
| Année | $ US | |
|---|---|---|
 Panama |
 Rép. dominicaine |
|
| 2025 | - | 30 119 023 791 $ US |
| 2024 | 38 380 161 300 $ US | 28 296 491 456 $ US |
| 2023 | 38 242 852 800 $ US | 25 685 265 157 $ US |
| 2022 | 36 730 408 000 $ US | 24 994 898 871 $ US |
| 2021 | 28 041 417 500 $ US | 20 419 747 259 $ US |
| 2020 | 20 695 086 000 $ US | 14 764 580 794 $ US |
| 2019 | 28 061 045 300 $ US | 20 793 631 484 $ US |
| 2018 | 28 506 576 400 $ US | 20 392 862 253 $ US |
| 2017 | 26 677 342 700 $ US | 19 118 996 310 $ US |
| 2016 | 24 944 633 900 $ US | 18 279 168 808 $ US |
| 2015 | 26 426 478 300 $ US | 17 058 168 236 $ US |
| 2014 | 28 227 865 800 $ US | 17 026 265 384 $ US |
| 2013 | 30 311 100 700 $ US | 15 878 953 122 $ US |
| 2012 | 31 007 035 900 $ US | 14 999 070 991 $ US |
| 2011 | 27 745 672 000 $ US | 14 097 050 548 $ US |
| 2010 | 21 169 337 600 $ US | 12 253 253 718 $ US |
| 2009 | 19 444 070 800 $ US | 10 171 930 289 $ US |
| 2008 | 20 139 437 700 $ US | 11 517 105 550 $ US |
| 2007 | 15 632 029 200 $ US | 11 766 045 684 $ US |
| 2006 | 12 911 451 400 $ US | 10 691 550 324 $ US |
| 2005 | 11 343 421 800 $ US | 10 136 190 145 $ US |
| 2004 | 9 147 223 700 $ US | 9 185 099 134 $ US |
| 2003 | 7 908 174 700 $ US | 9 022 076 949 $ US |
| 2002 | 8 042 654 200 $ US | 8 337 710 063 $ US |
| 2001 | 8 417 757 100 $ US | 8 164 580 328 $ US |
| 2000 | 8 252 110 300 $ US | 8 628 023 507 $ US |
| 1999 | 7 437 744 600 $ US | 7 743 619 442 $ US |
| 1998 | 8 476 358 300 $ US | 7 435 712 075 $ US |
| 1997 | 8 944 359 100 $ US | 7 050 603 812 $ US |
| 1996 | 7 673 646 700 $ US | 6 363 901 907 $ US |
| 1995 | 6 399 816 900 $ US | 5 860 800 311 $ US |
| 1994 | 6 185 029 900 $ US | 5 302 644 573 $ US |
| 1993 | 5 626 006 400 $ US | 4 760 104 000 $ US |
| 1992 | 5 336 629 500 $ US | 4 271 216 000 $ US |
| 1991 | 4 552 713 300 $ US | 3 937 453 796 $ US |
| 1990 | 3 699 099 600 $ US | 2 165 302 159 $ US |
| 1989 | 3 092 916 000 $ US | 2 050 889 905 $ US |
| 1988 | 2 940 126 900 $ US | 1 853 151 083 $ US |
| 1987 | 3 233 834 800 $ US | 1 487 383 601 $ US |
| 1986 | 3 202 394 800 $ US | 1 404 388 030 $ US |
| 1985 | 2 972 609 600 $ US | 1 319 814 445 $ US |
| 1984 | 2 752 048 000 $ US | 2 519 773 064 $ US |
| 1983 | 2 792 310 500 $ US | 1 565 486 937 $ US |
| 1982 | 3 277 786 800 $ US | 1 359 153 860 $ US |
| 1981 | 3 253 003 600 $ US | 1 634 265 438 $ US |
| 1980 | 3 000 600 900 $ US | 1 375 636 561 $ US |
| 1979 | 2 183 808 400 $ US | 1 211 190 560 $ US |
| 1978 | 1 915 103 700 $ US | 882 809 470 $ US |
| 1977 | 1 788 323 200 $ US | 966 710 293 $ US |
| 1976 | 1 626 595 600 $ US | 880 982 316 $ US |
| 1975 | 1 680 181 200 $ US | 1 039 406 497 $ US |
| 1974 | 1 479 040 900 $ US | 749 535 909 $ US |
| 1973 | 1 025 310 500 $ US | 529 005 317 $ US |
| 1972 | 894 452 800 $ US | 422 847 716 $ US |
| 1971 | 827 859 100 $ US | 300 134 133 $ US |
| 1970 | 753 693 500 $ US | 266 692 194 $ US |
| 1969 | 701 141 700 $ US | 227 400 000 $ US |
| 1968 | 637 577 200 $ US | 199 500 000 $ US |
| 1967 | 582 900 100 $ US | 187 100 000 $ US |
| 1966 | 518 176 300 $ US | 160 800 000 $ US |
| 1965 | 464 078 900 $ US | 144 800 000 $ US |
| 1964 | 407 276 600 $ US | 202 000 000 $ US |
| 1963 | 380 614 200 $ US | 195 000 000 $ US |
| 1962 | 346 803 300 $ US | 196 700 000 $ US |
| 1961 | 282 659 200 $ US | 152 100 000 $ US |
| 1960 | 245 950 200 $ US | 172 100 000 $ US |
Les exportations de biens et services du Panama s'élevaient à 38,4 milliards de dollars (2024) et celles de la République dominicaine à 28,3 milliards de dollars (2024) : celles du Panama étaient supérieures de 36 %. En 1960, les exportations du Panama étaient supérieures de 43 % : 246 millions de dollars pour le Panama et 172 millions de dollars pour la République dominicaine.
Les exportations de biens et services du Panama sont supérieures à celles de la République dominicaine chaque année depuis 2005.
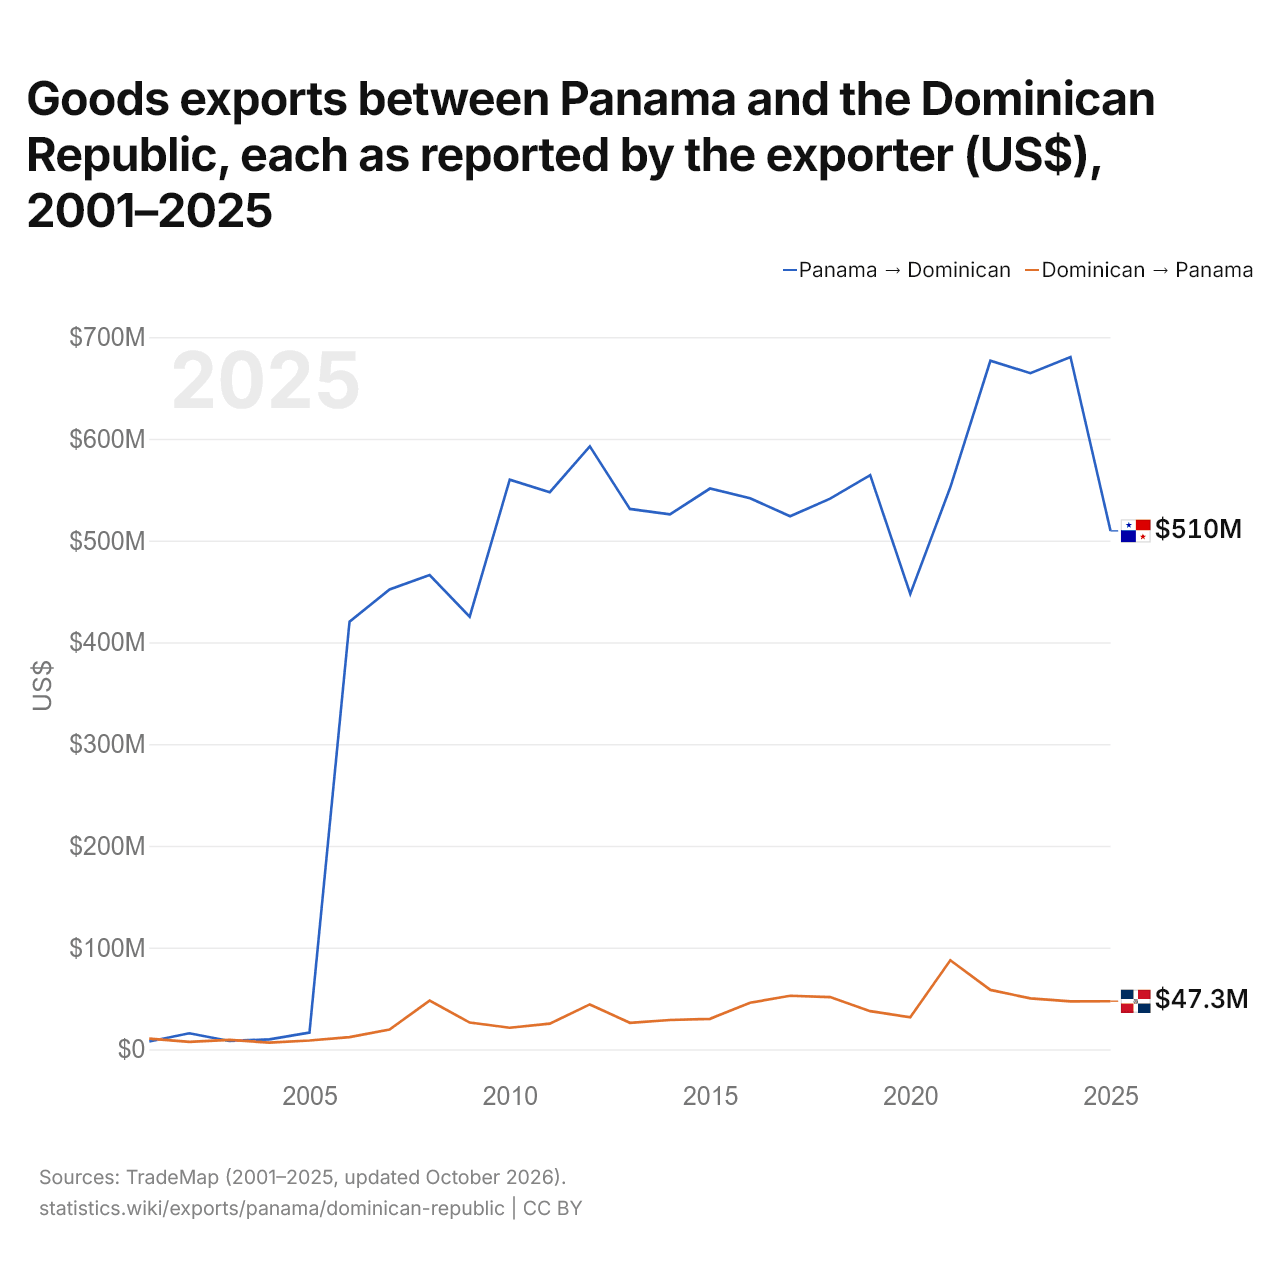
Exportations de biens entre le Panama et la République dominicaine, selon chaque exportateur ($ US), 2001–2025
| Année | $ US | |
|---|---|---|
| Panama → Rép. [...] | Rép. [...] → Panama | |
| 2025 | 509 523 000 $ US | 47 285 000 $ US |
| 2024 | 680 500 000 $ US | 47 099 000 $ US |
| 2023 | 664 524 000 $ US | 50 069 000 $ US |
| 2022 | 676 771 000 $ US | 58 393 000 $ US |
| 2021 | 552 375 000 $ US | 87 519 000 $ US |
| 2020 | 447 640 000 $ US | 31 527 000 $ US |
| 2019 | 564 325 000 $ US | 37 532 000 $ US |
| 2018 | 541 225 000 $ US | 51 352 000 $ US |
| 2017 | 523 920 000 $ US | 52 643 000 $ US |
| 2016 | 541 662 000 $ US | 45 824 000 $ US |
| 2015 | 551 176 000 $ US | 30 005 000 $ US |
| 2014 | 525 746 000 $ US | 28 841 000 $ US |
| 2013 | 531 135 000 $ US | 26 064 000 $ US |
| 2012 | 592 628 000 $ US | 44 157 000 $ US |
| 2011 | 547 538 000 $ US | 25 212 000 $ US |
| 2010 | 559 891 000 $ US | 21 196 000 $ US |
| 2009 | 425 190 000 $ US | 26 312 000 $ US |
| 2008 | 466 238 000 $ US | 47 824 000 $ US |
| 2007 | 452 024 000 $ US | 19 508 000 $ US |
| 2006 | 420 340 000 $ US | 11 962 000 $ US |
| 2005 | 16 455 000 $ US | 8 680 000 $ US |
| 2004 | 9 744 000 $ US | 6 672 000 $ US |
| 2003 | 8 238 000 $ US | 9 220 000 $ US |
| 2002 | 15 793 000 $ US | 7 377 000 $ US |
| 2001 | 7 760 000 $ US | 10 469 000 $ US |
En 2025, les exportations de biens du Panama vers la République dominicaine, selon le Panama, s'élevaient à 510 millions de dollars, et celles de la République dominicaine vers le Panama, selon la République dominicaine, à 47,3 millions de dollars : 11 fois plus pour celles du Panama. En 2001, elles s'élevaient à 7,76 millions de dollars pour le Panama et à 10,5 millions de dollars pour la République dominicaine.
Panama vs République dominicaine : chiffres des exportations
|
Panama
|
Rép. dominicaine
|
|
|---|---|---|
| Exportations | 38,4 Md $US (2024) | 30,1 Md $US (2025) |
| Rang mondial | 73/176 | 81/176 |
| Part mondiale | 0,12 % | 0,09 % |
| % du PIB | 44,4 % | 23,6 % |
| Première catégorie de biens | Machines, électronique et véhicules (28,5 %, 2025) | Machines, électronique et véhicules (24,1 %, 2025) |
| Première destination des biens | Colombie (7,95 %, 2025) | États-Unis (53,5 %, 2025) |
Comparer les exportations de 2 pays au choix
Sources :
- Banque mondiale | Économie et croissance (1960–2025, mis à jour en octobre 2026)
- TradeMap (2001–2025, mis à jour en octobre 2026)
Creative Commons Attribution (CC BY) : vous pouvez copier, partager, adapter et réutiliser ce contenu, y compris à des fins commerciales, à condition de citer statistics.wiki et d’indiquer les modifications apportées. Les sources citées ci-dessus peuvent avoir leurs propres conditions de licence.