
Exportations de biens et services de la Jamaïque par année ($ US)
| Année | $ US |
|---|---|
| Exportations | |
| 2019 | 6 476 125 525 $ US |
| 2018 | 6 500 109 389 $ US |
| 2017 | 5 470 126 318 $ US |
| 2016 | 4 739 886 674 $ US |
| 2015 | 4 477 355 318 $ US |
| 2014 | 4 344 148 359 $ US |
| 2013 | 4 361 406 704 $ US |
| 2012 | 4 469 328 281 $ US |
| 2011 | 4 386 643 486 $ US |
| 2010 | 4 142 694 564 $ US |
| 2009 | 4 179 085 017 $ US |
| 2008 | 5 750 176 380 $ US |
| 2007 | 5 085 113 542 $ US |
| 2006 | 4 787 762 836 $ US |
| 2005 | 3 966 075 213 $ US |
| 2004 | 3 819 978 692 $ US |
| 2003 | 3 452 736 098 $ US |
| 2002 | 3 184 137 159 $ US |
| 2001 | 3 270 027 448 $ US |
| 2000 | 3 493 068 625 $ US |
| 1999 | 3 469 205 912 $ US |
| 1998 | 3 377 181 943 $ US |
| 1997 | 3 409 513 268 $ US |
| 1996 | 3 345 729 494 $ US |
| 1995 | 3 372 676 723 $ US |
| 1994 | 3 029 414 344 $ US |
| 1993 | 2 398 215 528 $ US |
| 1992 | 2 201 691 650 $ US |
| 1991 | 2 061 617 580 $ US |
| 1990 | 2 207 161 027 $ US |
| 1989 | 1 921 094 526 $ US |
| 1988 | 1 670 348 930 $ US |
| 1987 | 1 531 804 281 $ US |
| 1986 | 1 345 404 287 $ US |
| 1985 | 1 173 217 910 $ US |
| 1984 | 1 319 188 070 $ US |
| 1983 | 1 291 935 637 $ US |
| 1982 | 1 252 876 862 $ US |
| 1981 | 1 405 788 641 $ US |
| 1980 | 1 368 290 409 $ US |
| 1979 | 1 207 857 306 $ US |
| 1978 | 1 072 415 652 $ US |
| 1977 | 967 340 967 $ US |
| 1976 | 861 520 862 $ US |
| 1975 | 1 008 701 009 $ US |
| 1974 | 847 330 847 $ US |
| 1973 | 601 285 461 $ US |
| 1972 | 614 624 866 $ US |
| 1971 | 520 772 044 $ US |
| 1970 | 466 800 187 $ US |
| 1969 | 437 879 650 $ US |
| 1968 | 399 239 681 $ US |
| 1967 | 413 831 957 $ US |
| 1966 | 410 759 836 $ US |
| 1965 | 323 539 871 $ US |
| 1964 | 300 429 940 $ US |
| 1963 | 282 455 487 $ US |
| 1962 | 256 777 677 $ US |
| 1961 | 249 074 320 $ US |
| 1960 | 232 383 807 $ US |
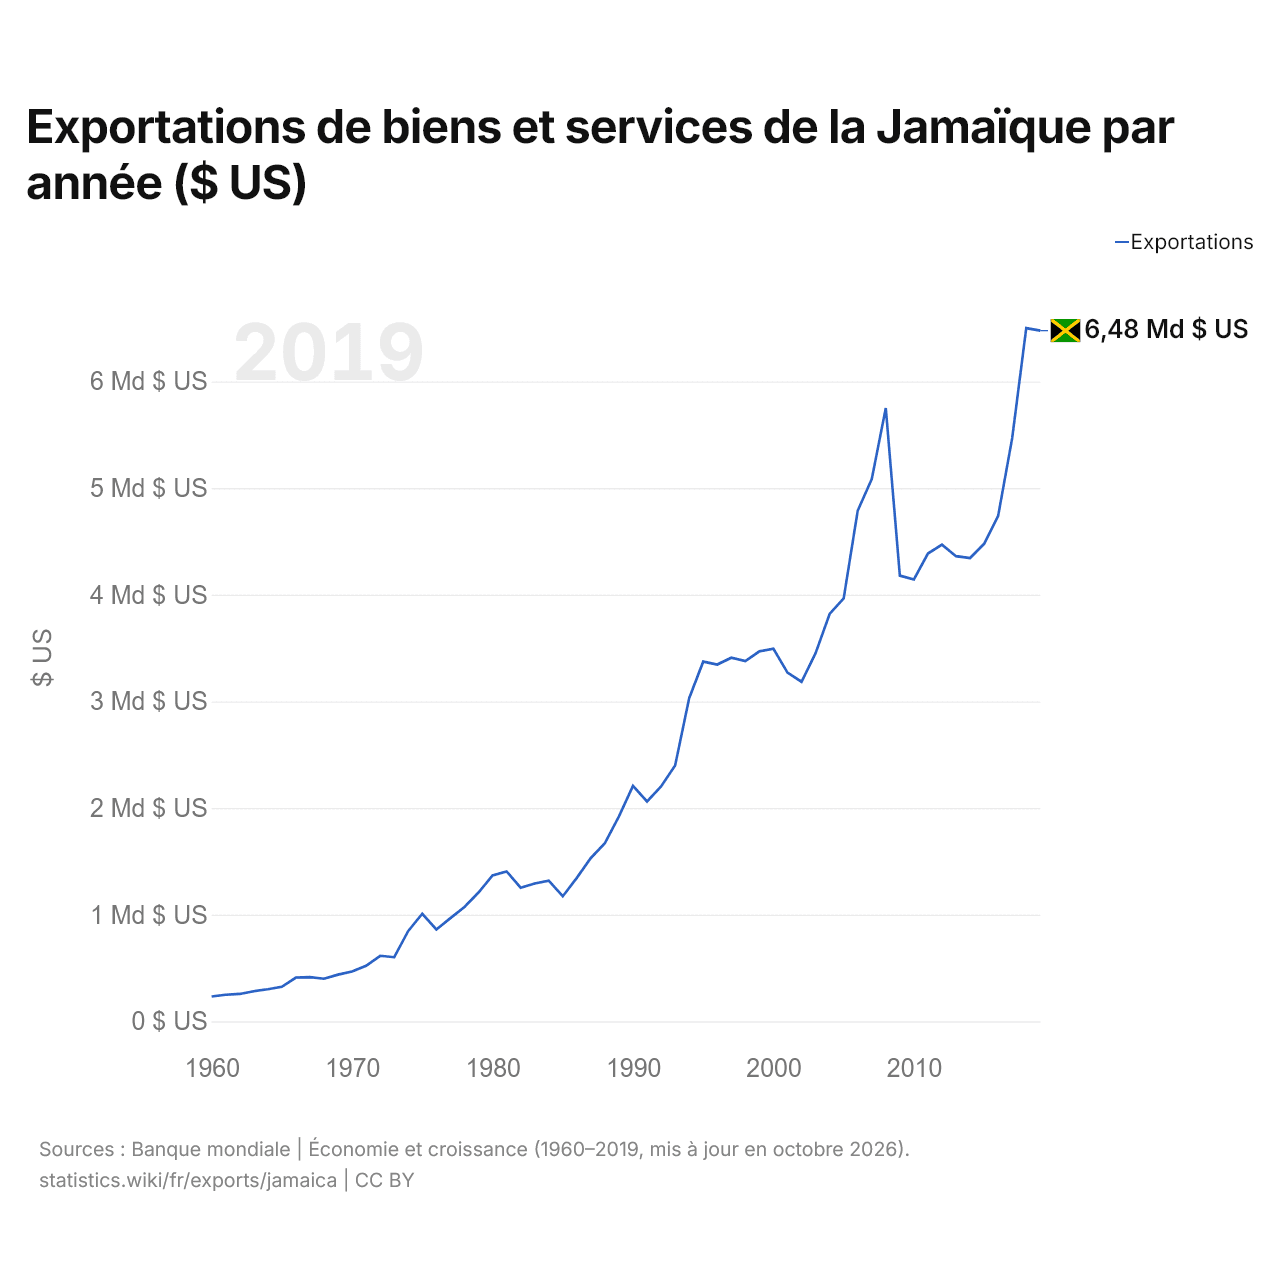
Les exportations de biens et services de la Jamaïque s'élèvent à 6,48 milliards de dollars (2019), contre 232 millions de dollars en 1960. Le maximum a été de 6,5 milliards de dollars, en 2018.
Les importations de biens et services de la Jamaïque s'élèvent à 8,87 milliards de dollars (2019). Les importations de la Jamaïque dépassent ses exportations de 2,39 milliards de dollars, soit un déficit commercial (2019).
Exportations de biens de la Jamaïque par catégorie, 2025
Exportations de biens, 2025: 1,65 Md $US
En 2025, la première catégorie des exportations de biens de la Jamaïque était « pétrole, gaz, minerais et autres matières premières », avec 66,8 %, suivie de « aliments transformés, huiles, aliments pour animaux, boissons et tabac », avec 20,2 %.
Destinations des exportations de biens de la Jamaïque : les 10 premières, 2025
| Rang | Pays | Exportations de biens | Part | |
|---|---|---|---|---|
| 1 |
 États-Unis |
675 M $US | 40,8 % | |
| 2 |
 Russie |
187 M $US | 11,3 % | |
| 3 |
 Islande |
112 M $US | 6,8 % | |
| 4 |
 Canada |
101 M $US | 6,11 % | vs Canada |
| 5 |
 Pays-Bas |
81,9 M $US | 4,96 % | |
| 6 |
 Trinité-et-Tobago |
75,4 M $US | 4,56 % | |
| 7 |
 Royaume-Uni |
65,9 M $US | 3,99 % | |
| 8 |
 France |
55,4 M $US | 3,35 % | vs France |
| 9 |
 Îles Caïmans |
32,9 M $US | 1,99 % | |
| 10 |
 Chine |
25,9 M $US | 1,57 % | |
| Autres partenaires et non précisés | 240 M $US | 14,5 % |
Exportations de biens de la Jamaïque vers ses 5 principales destinations ($ US), 2001–2025
| Année | $ US | ||||
|---|---|---|---|---|---|
| États-Unis | Russie | Islande | Canada | Pays-Bas | |
| 2025 | 674 641 000 $ US | 186 510 000 $ US | 112 408 000 $ US | 100 903 000 $ US | 81 923 000 $ US |
| 2024 | 776 664 000 $ US | 236 042 000 $ US | 126 690 000 $ US | 135 156 000 $ US | 193 099 000 $ US |
| 2023 | 718 249 000 $ US | 138 050 000 $ US | 94 902 000 $ US | 44 240 000 $ US | 56 004 000 $ US |
| 2022 | 1 154 463 000 $ US | 99 747 000 $ US | 44 378 000 $ US | 76 041 000 $ US | 16 865 000 $ US |
| 2021 | 756 398 000 $ US | 44 170 000 $ US | 29 452 000 $ US | 98 469 000 $ US | 146 857 000 $ US |
| 2020 | 570 568 000 $ US | 68 354 000 $ US | 83 696 000 $ US | 118 896 000 $ US | 98 072 000 $ US |
| 2019 | 633 734 000 $ US | 64 897 000 $ US | 115 257 000 $ US | 137 873 000 $ US | 210 109 000 $ US |
| 2018 | 582 856 000 $ US | 67 741 000 $ US | 107 096 000 $ US | 208 139 000 $ US | 199 141 000 $ US |
| 2017 | 537 740 000 $ US | 49 068 000 $ US | 50 797 000 $ US | 125 610 000 $ US | 157 118 000 $ US |
| 2016 | 498 424 000 $ US | 70 567 000 $ US | 23 839 000 $ US | 145 312 000 $ US | 124 429 000 $ US |
| 2015 | 467 011 000 $ US | 87 766 000 $ US | 99 002 000 $ US | 182 458 000 $ US | 110 353 000 $ US |
| 2014 | 571 614 000 $ US | 74 704 000 $ US | 64 015 000 $ US | 222 343 000 $ US | 82 737 000 $ US |
| 2013 | 770 756 000 $ US | 25 216 000 $ US | 37 581 000 $ US | 225 075 000 $ US | 108 502 000 $ US |
| 2012 | 823 450 000 $ US | 59 225 000 $ US | 27 151 000 $ US | 121 583 000 $ US | 70 610 000 $ US |
| 2011 | 839 308 000 $ US | 10 734 000 $ US | 7 775 000 $ US | 263 658 000 $ US | 91 352 000 $ US |
| 2010 | 659 125 000 $ US | 37 297 000 $ US | 18 325 000 $ US | 163 437 000 $ US | 68 269 000 $ US |
| 2009 | 649 095 000 $ US | 4 623 000 $ US | 40 776 000 $ US | 131 629 000 $ US | 35 391 000 $ US |
| 2008 | 983 153 000 $ US | 127 484 000 $ US | 78 764 000 $ US | 258 993 000 $ US | 191 583 000 $ US |
| 2007 | 827 816 000 $ US | 75 904 000 $ US | 68 118 000 $ US | 333 304 000 $ US | 201 105 000 $ US |
| 2006 | 605 295 000 $ US | 24 699 000 $ US | 15 845 000 $ US | 309 440 000 $ US | 138 849 000 $ US |
| 2005 | 387 127 000 $ US | 21 653 000 $ US | 6 132 000 $ US | 293 855 000 $ US | 34 396 000 $ US |
| 2004 | 302 571 000 $ US | 3 000 $ US | - | 273 520 000 $ US | 117 052 000 $ US |
| 2003 | 341 703 000 $ US | 18 354 000 $ US | - | 192 411 000 $ US | 62 624 000 $ US |
| 2002 | 313 014 000 $ US | 8 596 000 $ US | 4 141 000 $ US | 156 864 000 $ US | 135 186 000 $ US |
| 2001 | 403 656 000 $ US | 18 108 000 $ US | - | 191 119 000 $ US | 135 975 000 $ US |
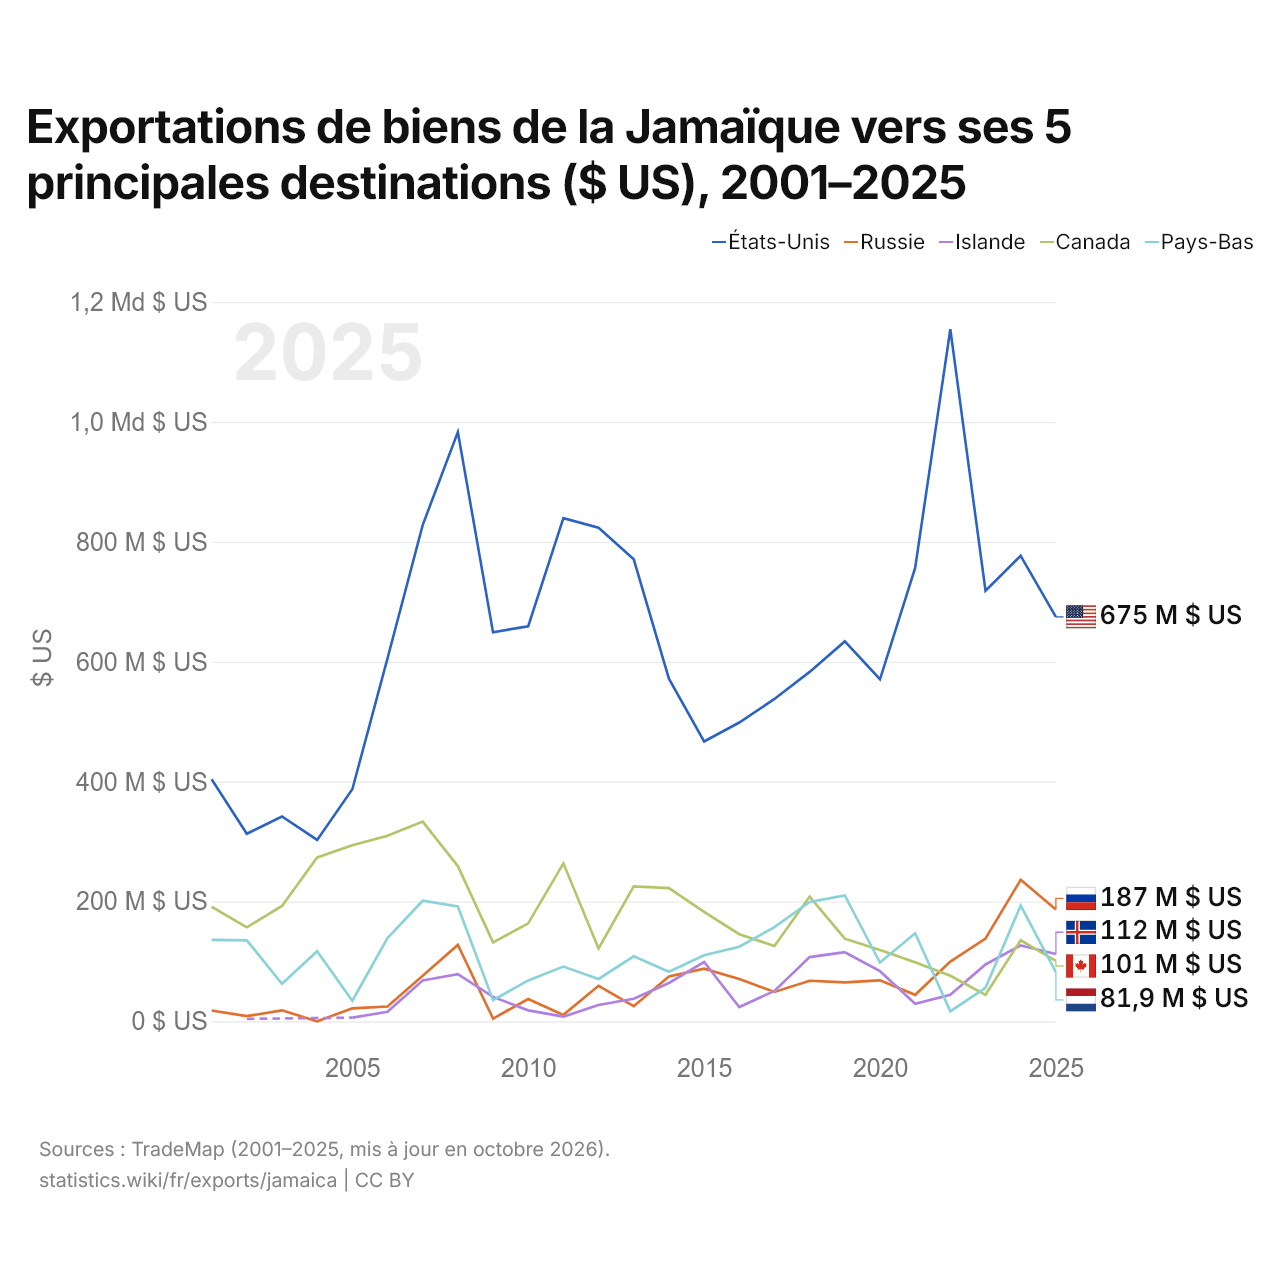
En 2025, les exportations de biens s'élevaient à 675 millions de dollars vers les États-Unis, 187 millions de dollars vers la Russie, 112 millions de dollars vers l'Islande, 101 millions de dollars vers le Canada et 81,9 millions de dollars vers les Pays-Bas. Le premier rang des cinq destinations de la Jamaïque est occupé par les États-Unis chaque année depuis 2001. Le changement le plus récent dans leur ordre remonte à 2025, quand les exportations de la Jamaïque vers l'Islande ont dépassé celles vers le Canada.
Exportations de biens et de services de la Jamaïque ($ US), 1976–2025
| Année | $ US | |
|---|---|---|
| Biens | Services | |
| 2025 | 1 652 185 898 $ US | 5 057 675 990 $ US |
| 2024 | 1 867 260 797 $ US | 5 255 661 680 $ US |
| 2023 | 2 001 896 638 $ US | 5 273 023 932 $ US |
| 2022 | 1 901 510 456 $ US | 4 522 117 818 $ US |
| 2021 | 1 480 794 869 $ US | 2 919 909 882 $ US |
| 2020 | 1 250 578 464 $ US | 1 998 847 616 $ US |
| 2019 | 1 653 218 414 $ US | 4 377 675 211 $ US |
| 2018 | 1 960 961 118 $ US | 3 829 668 377 $ US |
| 2017 | 1 350 869 098 $ US | 3 516 155 119 $ US |
| 2016 | 1 188 319 201 $ US | 3 216 454 600 $ US |
| 2015 | 1 254 861 538 $ US | 3 058 766 644 $ US |
| 2014 | 1 448 619 237 $ US | 2 952 204 894 $ US |
| 2013 | 1 580 479 634 $ US | 2 755 115 840 $ US |
| 2012 | 1 728 499 366 $ US | 2 755 722 980 $ US |
| 2011 | 1 666 090 336 $ US | 2 620 213 778 $ US |
| 2010 | 1 370 358 549 $ US | 2 634 015 282 $ US |
| 2009 | 1 387 723 875 $ US | 2 650 557 208 $ US |
| 2008 | 2 743 891 964 $ US | 2 795 222 625 $ US |
| 2007 | 2 362 580 537 $ US | 2 706 554 061 $ US |
| 2006 | 2 133 613 000 $ US | 2 648 677 832 $ US |
| 2005 | 1 664 320 000 $ US | 2 329 673 014 $ US |
| 2004 | 1 601 625 808 $ US | 2 297 132 310 $ US |
| 2003 | 1 385 600 000 $ US | 2 137 730 000 $ US |
| 2002 | 1 309 100 000 $ US | 1 912 260 000 $ US |
| 2001 | 1 454 400 000 $ US | 1 897 000 000 $ US |
| 2000 | 1 562 800 000 $ US | 2 025 700 000 $ US |
| 1999 | 1 499 100 000 $ US | 1 978 400 000 $ US |
| 1998 | 1 613 400 000 $ US | 1 770 400 000 $ US |
| 1997 | 1 700 300 000 $ US | 1 698 900 000 $ US |
| 1996 | 1 721 000 000 $ US | 1 601 900 000 $ US |
| 1995 | 1 796 000 000 $ US | 1 597 900 000 $ US |
| 1994 | 1 548 000 000 $ US | 1 480 200 000 $ US |
| 1993 | 1 105 400 000 $ US | 1 260 690 000 $ US |
| 1992 | 1 116 500 000 $ US | 1 104 000 000 $ US |
| 1991 | 1 196 700 000 $ US | 992 100 000 $ US |
| 1990 | 1 190 600 000 $ US | 1 026 500 000 $ US |
| 1989 | 1 028 900 000 $ US | 876 100 000 $ US |
| 1988 | 898 400 000 $ US | 785 300 000 $ US |
| 1987 | 725 200 000 $ US | 837 500 000 $ US |
| 1986 | 589 500 000 $ US | 753 500 000 $ US |
| 1985 | 568 600 000 $ US | 609 500 000 $ US |
| 1984 | 702 300 000 $ US | 566 300 000 $ US |
| 1983 | 685 700 000 $ US | 540 100 000 $ US |
| 1982 | 767 400 000 $ US | 493 000 000 $ US |
| 1981 | 974 000 000 $ US | 430 900 000 $ US |
| 1980 | 962 700 000 $ US | 400 700 000 $ US |
| 1979 | 818 200 000 $ US | 351 800 000 $ US |
| 1978 | 831 100 000 $ US | 285 400 000 $ US |
| 1977 | 737 800 000 $ US | 217 200 000 $ US |
| 1976 | 656 400 000 $ US | 232 700 000 $ US |
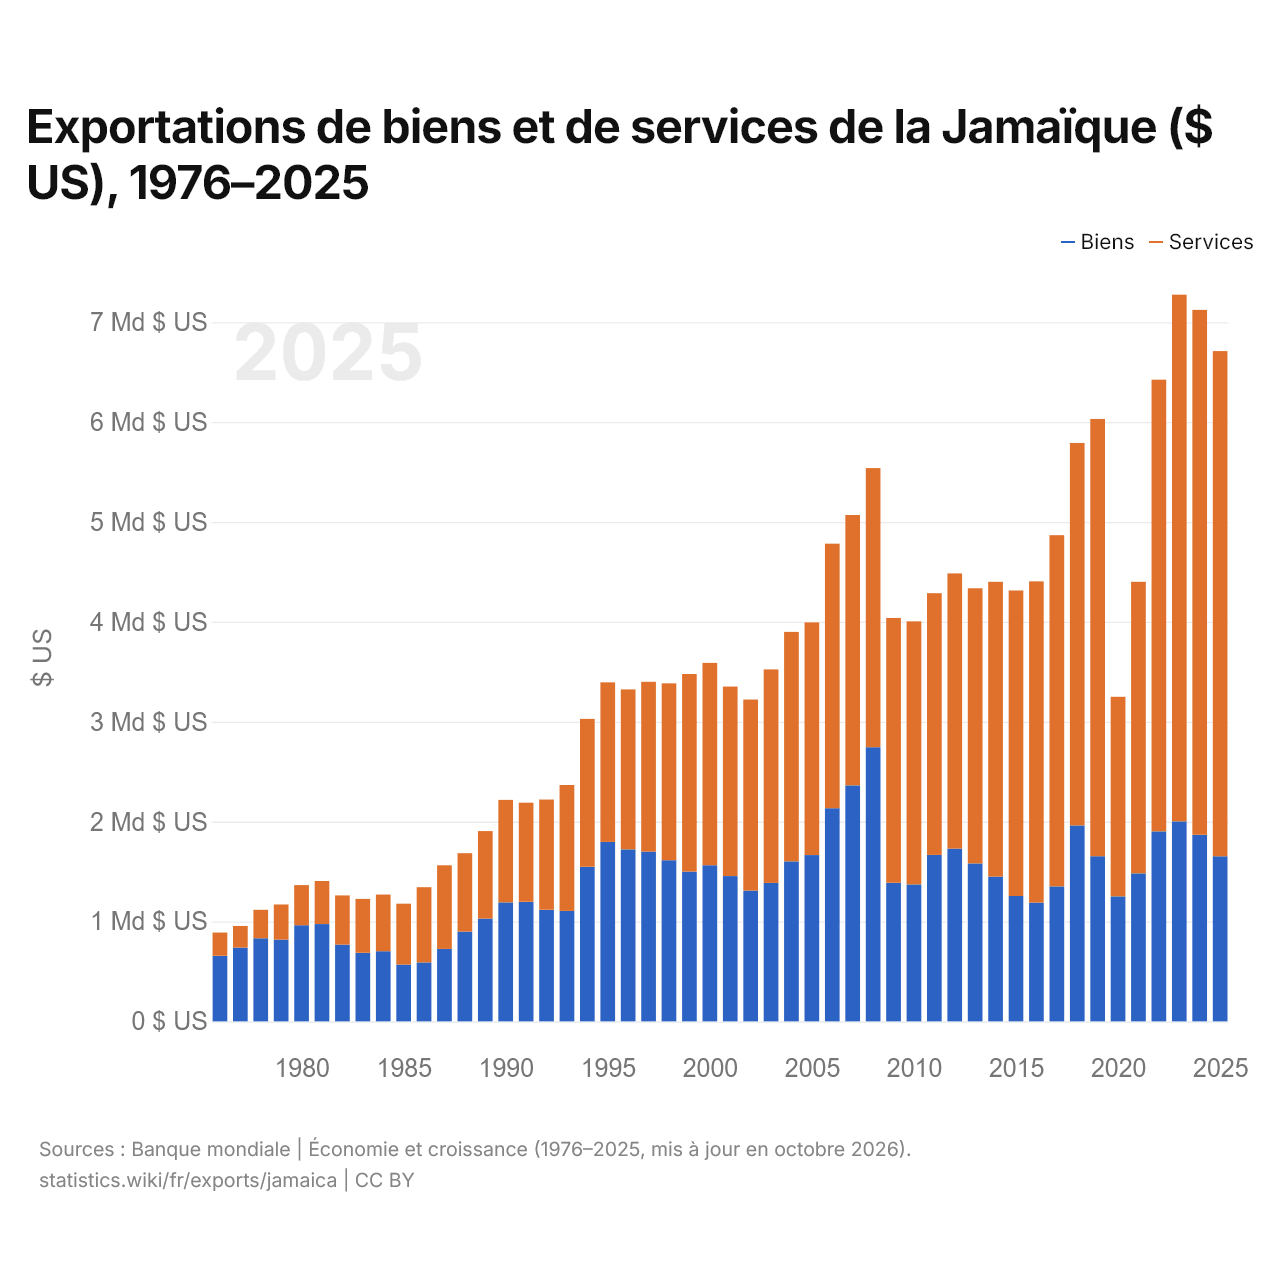
En 2025, les exportations de biens de la Jamaïque s'élevaient à 1,65 milliard de dollars et celles de services à 5,06 milliards de dollars ; les services représentaient 75,4 % du total, contre 26,2 % en 1976.
Exportations de biens et services de la Jamaïque, % du PIB
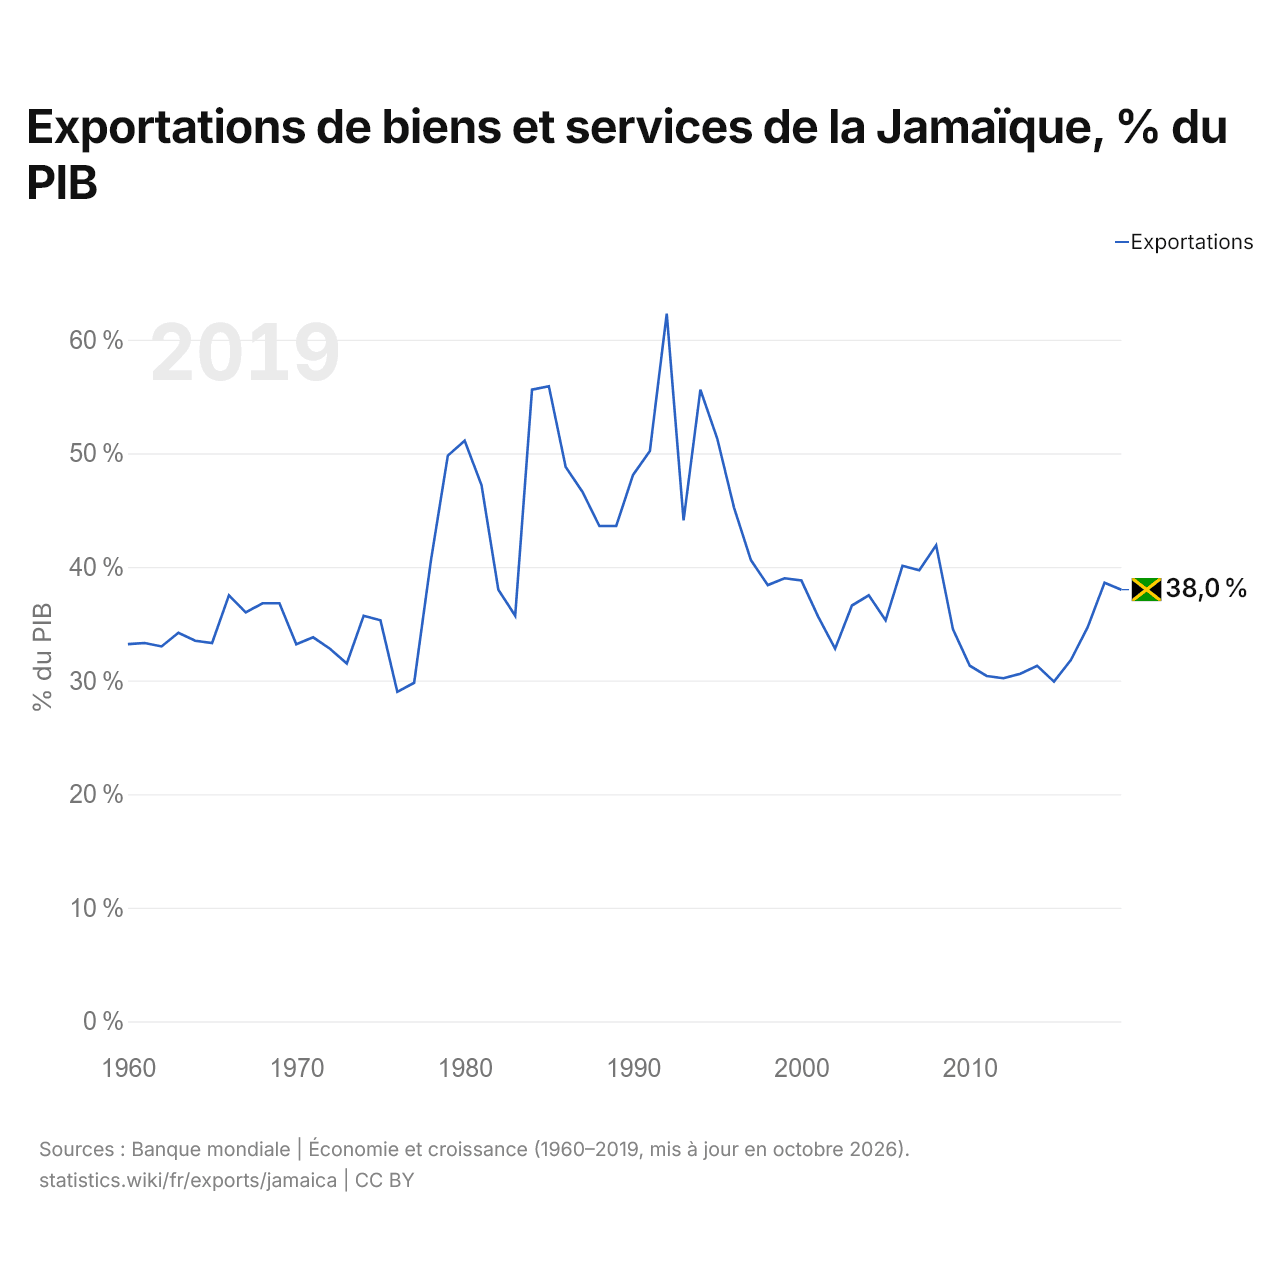
Les exportations de biens et services de la Jamaïque équivalent à 38,0 % de son PIB (2019), contre 33,2 % en 1960. La part la plus élevée a été de 62,3 %, en 1992.
Comparer les exportations de la Jamaïque avec celles d'autres pays
Sources :
- Banque mondiale | Économie et croissance (1960–2025, mis à jour en octobre 2026)
- TradeMap (2001–2025, mis à jour en octobre 2026)
Creative Commons Attribution (CC BY) : vous pouvez copier, partager, adapter et réutiliser ce contenu, y compris à des fins commerciales, à condition de citer statistics.wiki et d’indiquer les modifications apportées. Les sources citées ci-dessus peuvent avoir leurs propres conditions de licence.